Anchoring Bias in Trading: How Mental Price Traps Cost You Money
This article is for informational and educational purposes only. Nothing here constitutes financial advice or a recommendation to buy, sell, or hold any financial instrument.
Anchoring bias quietly warps your decision-making by locking your brain onto a single reference point (usually a price) and filtering everything else through that lens. As a result, you make choices based on where price was rather than where it is, or where it’s likely headed.
This guide breaks down exactly how anchoring bias works in trading, reveals where it hides in your own process, and gives you a practical framework to catch it before it eats into your returns.

What Is Anchoring Bias?
Chances are you’ve experienced this outside of trading without even realizing it. Walk into a clothing store, see a jacket “marked down” from $400 to $180, and suddenly $180 feels like a steal, even if the jacket is only worth $120. That $400 tag did its job. It anchored your sense of value before you had time to think.
The Psychology Behind Mental Anchors
Anchoring bias is a cognitive bias where your brain latches onto the first piece of information it encounters (the “anchor”) and uses it as a baseline for every judgment that follows. Daniel Kahneman and Amos Tversky identified this pattern decades ago, and it shows up everywhere: salary negotiations, real estate, and yes, your trading screen.
Why does your brain do this? Because processing every variable from scratch for every decision is exhausting. Mental shortcuts, known as heuristics, save energy. But in environments where conditions shift constantly, like financial markets, those shortcuts become liabilities. The anchor that felt relevant an hour ago may have zero bearing on what’s happening right now.
Why Traders Are Especially Vulnerable
Trading is essentially an anchor factory. Think about how many numbers your brain absorbs in a single session: your entry price, yesterday’s high, a 52-week low, an analyst’s price target, a round number like $100 or $50. Each one is a potential anchor waiting to distort your next decision.
What makes the problem worse is the emotional weight behind these numbers. Your entry price is tied to your ego, your P&L, and your sense of being “right.” That emotional charge makes the anchor stickier and far harder to override with logic.
So what does this actually look like when you’re staring at a live chart?
How Anchoring Bias Shows Up in Trading
Anchoring bias wears the mask of “conviction” or “analysis,” which is precisely what makes it dangerous. Below are the most common places it embeds itself in your trading decisions.
Anchoring to Entry Price
This is the big one. The moment you enter a trade, your buy price becomes the center of your mental universe. Every tick gets measured against it. You’re “up” or “down” relative to your number, not relative to what the market is actually communicating.
The problem is that the market doesn’t know or care where you got in. Your entry price is meaningful to your P&L, but it carries zero predictive value for where price goes next. Yet it shapes your exits, your stop adjustments, and your willingness to add or reduce size.
Anchoring to Historical Highs and Lows
“It hit $150 last year, so it should get back there.” Sound familiar? Historical price levels create powerful anchors, particularly all-time highs and significant lows. Traders frequently assume these levels act like magnets that price will eventually return to, even when the fundamental landscape has completely changed.
A stock that traded at $150 before a major earnings miss and sector rotation may never revisit that level. But the anchor makes you hold, wait, or even add to the position based on a number that belongs to a different market environment entirely.
Anchoring to Round Numbers and Key Levels
Round numbers ($50, $100, $200) carry psychological weight far beyond their technical significance. They become mental reference points that influence where you set targets, stops, and alerts. You might pass on a long entry at $101 because “it just broke $100 and that’s already a big move,” even though the chart structure supports continuation.
Similarly, support and resistance levels can quietly become anchors if you treat them as fixed truths rather than dynamic zones that shift with volume and context.
Anchoring to Analyst Targets and Earnings Estimates
When you read that an analyst has a $75 price target, that number lodges itself in your brain whether you respect the analyst or not. From that point forward, $75 becomes a lens. If the stock is at $60, it “has room.” If it’s at $80, it’s “overextended.” You’ve stopped analyzing and started comparing to someone else’s anchor.
Earnings estimates work the same way. A company beats estimates by a penny and the stock sells off. Traders anchored to the “beat” can’t understand why. The market had already priced in more than that anchor accounted for.
Knowing where anchoring hides is valuable, but it’s only half the picture. What does it actually look like in the heat of a real trade?
Real Trading Scenarios Where Anchoring Bias Takes Hold
Reading about bias in theory is comfortable. Recognizing it in your own behavior while real money is on the line is a completely different challenge.
Holding Losers Because of Your Buy Price
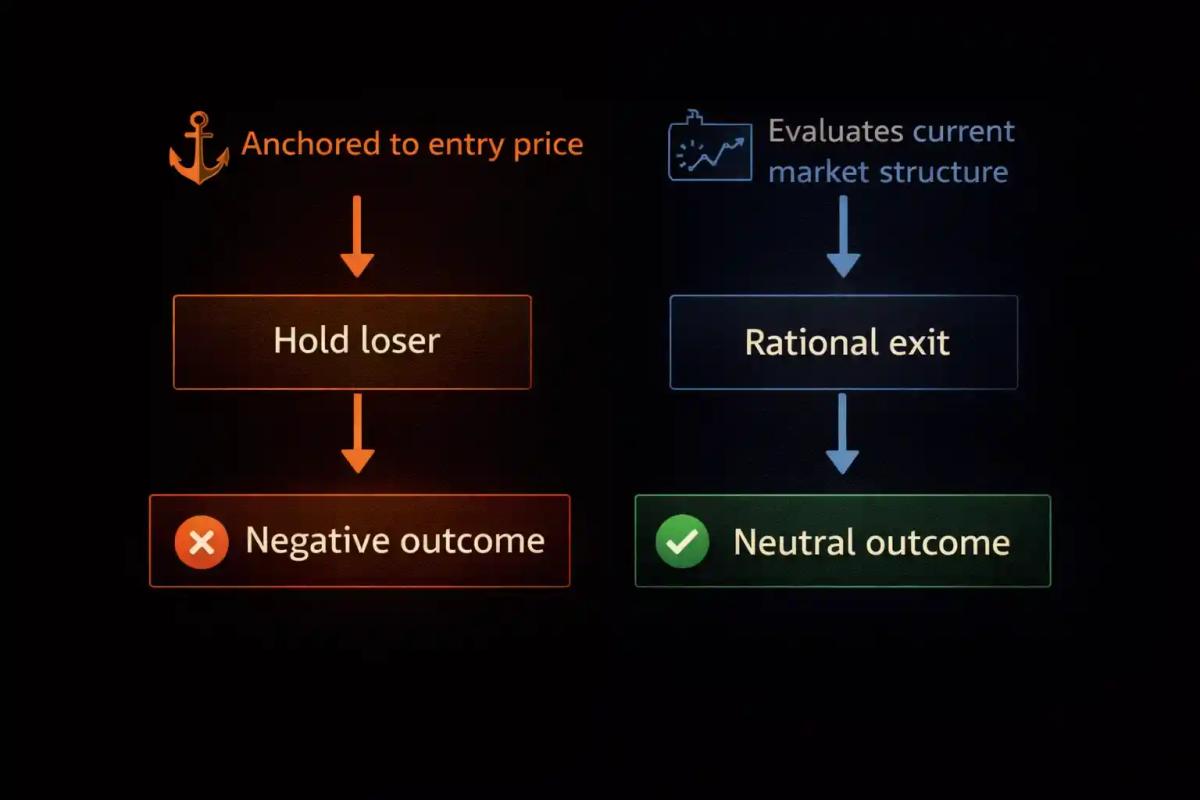
You bought a stock at $45. It drops to $38, but you hold because “it was just at $45.” You’re not evaluating the current price action, the volume, or whether the setup that got you in still exists. You’re waiting for the market to come back to your number so you can exit without taking the emotional hit of a loss.
This is anchoring in its purest form. Your buy price is dictating your exit strategy instead of the actual market structure. The rational question isn’t “how far am I from my entry?” It’s “if I had no position right now, would I buy this here?”
Refusing to Enter Because Price “Already Moved”
You were watching a stock at $20 last week. Today it’s at $28 with strong momentum, a clean breakout, and solid volume. But you can’t pull the trigger because $20 is burned into your memory. It feels “too expensive” relative to the price you first noticed it at, even though $28 might be a perfectly valid entry on the current chart.
This version of anchoring is quieter but equally costly. It keeps you on the sidelines while the trade you identified plays out without you.
Setting Stops Based on Your Entry, Not the Chart
You enter a trade at $62 and set your stop at $60 because “I don’t want to lose more than $2.” That logic sounds like risk management, but it’s really anchoring disguised as discipline. Your stop should sit where the trade idea is invalidated: a key level, a moving average, a structure break. Not at an arbitrary dollar amount measured from your entry.
When your stop placement is anchored to your entry rather than the chart, you either get stopped out by normal noise or, worse, you place it too far away and absorb a bigger loss than necessary.
If these scenarios hit close to home, that’s actually a good sign. It means you’re starting to see the bias clearly. Now the question becomes: how do you build a system to detect it before it influences your trades?
How to Identify Anchoring Bias in Your Own Trading
The trickiest thing about anchoring bias is that it feels like rational analysis. That’s exactly why detection requires deliberate tools and habits, not just awareness alone.
Warning Signs in Your Decision Process
Watch for these patterns in your own thinking:
- You catch yourself using phrases like “it was just at…” or “it should get back to…”
- Your exit plan revolves around your entry price rather than market levels
- You feel a strong reluctance to buy something that’s “moved too much” without actually checking the current setup
- You dismiss new information because it conflicts with an earlier price or target you’ve internalized
- You’re holding a position primarily because selling would mean accepting a loss relative to your anchor
These aren’t minor habits. Each one signals that a fixed reference point is overriding your real-time analysis.
Journaling as a Detection Tool
A trading journal is one of the most effective tools for spotting anchoring bias after the fact. But it only works if you record the why behind each trade, not just the what.
For every entry and exit, write down what information drove the decision. When you review your journal weekly, look for patterns: Are your exits consistently clustered around your entries? Do you avoid trades that have “moved too far” from a prior level? Do analyst targets or round numbers keep showing up as unexamined reasons?
Over time, your journal becomes a mirror. It shows you the anchors you can’t see in real time.
Once you’ve learned to spot anchoring, the natural next question is: how do you actually break free from it?
Practical Techniques to Break Anchoring Bias
Knowing about anchoring bias won’t make it disappear. It’s baked into how your brain processes information. But you can build habits and systems that weaken its grip on your decisions.
Reframe Using Current Market Structure
Every time you catch yourself referencing a past price, force yourself to answer one question: “What is the chart telling me right now?” Look at current price action, volume, trend direction, and volatility. Strip away the historical anchor and evaluate the setup as if you just opened the chart for the first time.
This reframing takes practice. But it gradually trains your brain to weigh present conditions over past reference points.
Use Multiple Reference Points Instead of One
A single anchor is powerful partly because it has no competition. Your brain defaults to the one number it has. Counter this by deliberately gathering multiple data points before making a decision:
- What does the current trend structure suggest?
- Where are the nearest volume-based levels?
- What are multiple timeframes showing?
- What’s the broader sector and market context?
When you flood your analysis with relevant reference points, no single anchor can dominate your thinking.
Pre-Trade Checklists and Decision Frameworks
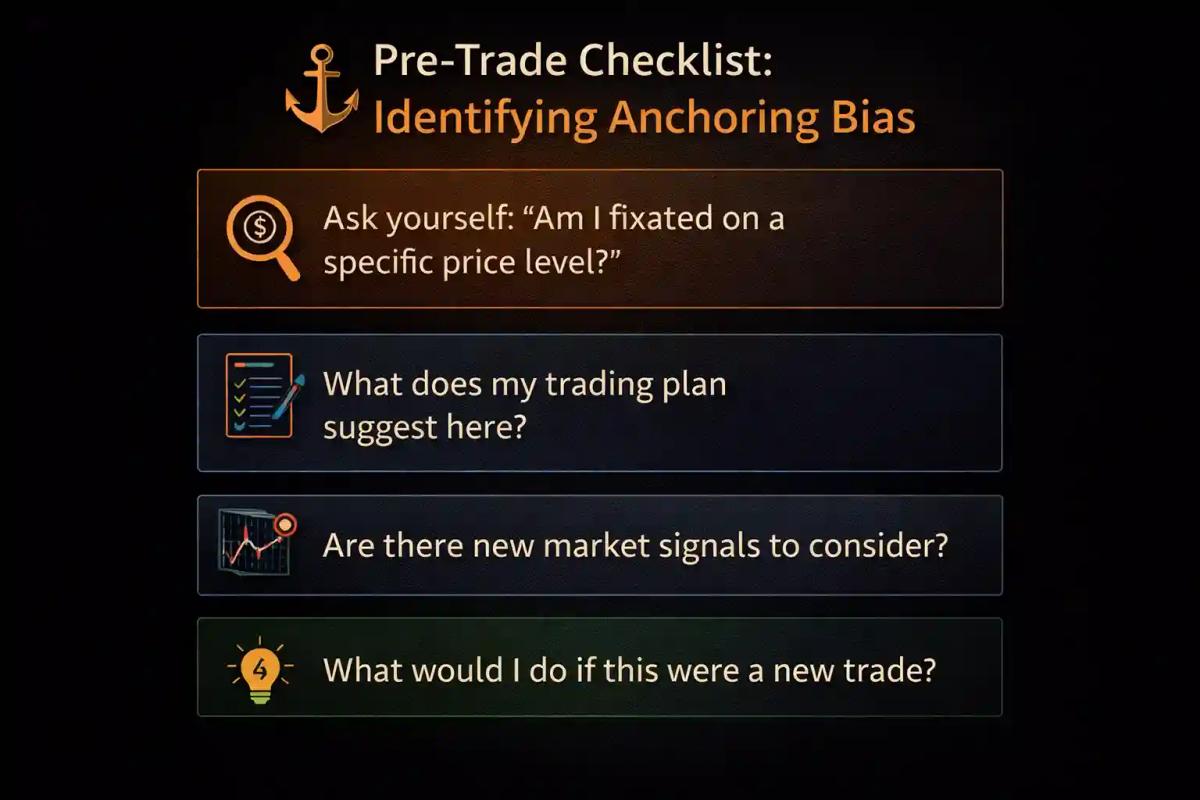
A written pre-trade checklist acts as a circuit breaker between impulse and action. Before entering or exiting any trade, run through a short set of questions designed to surface hidden anchors:
- What is my reason for this trade right now, based on current conditions?
- Am I referencing any price that the market no longer cares about?
- Would I take this same action if I had no existing position?
- Is my stop/target based on the chart or on my entry?
The checklist needs to interrupt the automatic process long enough for you to pressure-test your reasoning.
The Role of a Trading Plan in Reducing Bias
A solid trading plan is your best structural defense against anchoring bias. When your entries, exits, position sizes, and risk parameters are defined before the trade, you’ve already made the key decisions in a calm, unanchored state.
The plan won’t eliminate bias completely, but it gives you an objective standard to measure your in-the-moment decisions against. When you feel the pull of an anchor, you can check it against your plan and ask: “Is this what I decided beforehand, or am I improvising based on a number stuck in my head?”
Of course, anchoring doesn’t work alone. Understanding how it connects to other cognitive biases helps you see the bigger picture.
Anchoring Bias vs. Other Cognitive Biases in Trading
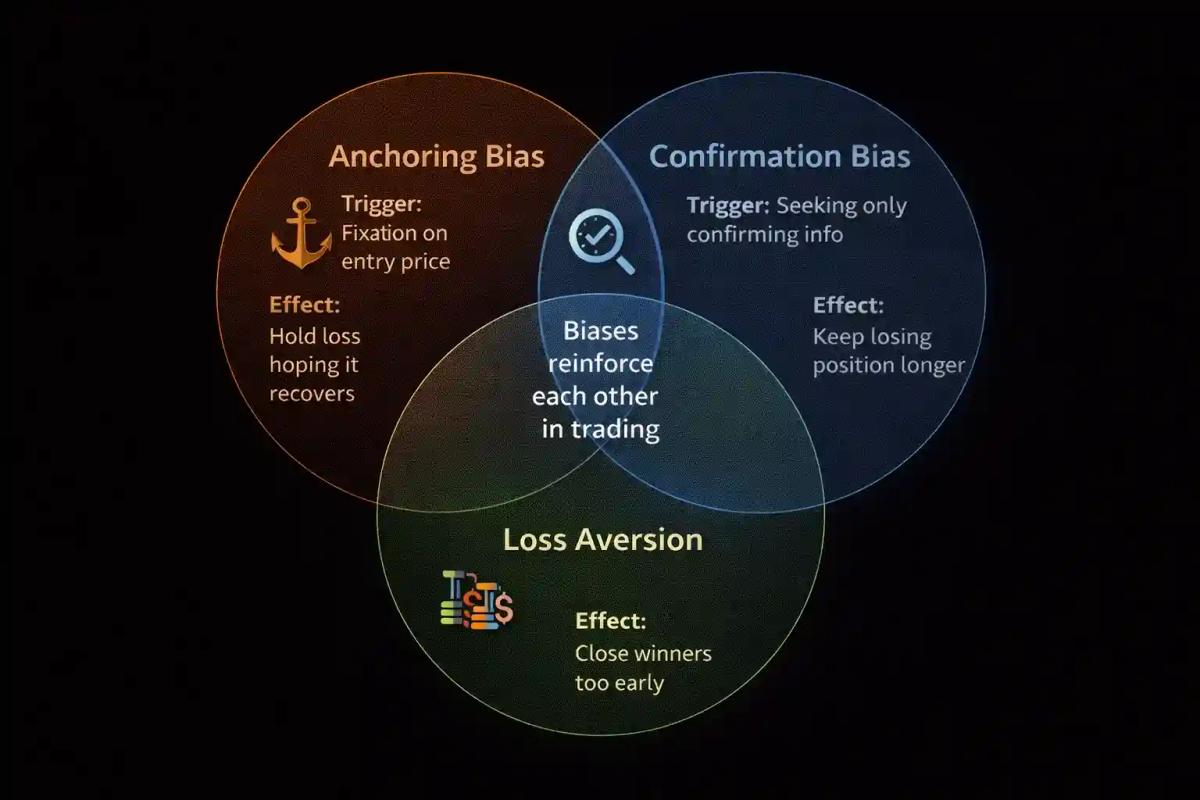
Anchoring bias rarely operates in isolation. It often teams up with other cognitive biases to compound its effect on your trading. Recognizing where they overlap, and where they differ, helps you diagnose what’s really driving a bad decision.
These biases frequently reinforce each other. You anchor to your entry price (anchoring), then selectively read news that supports the trade going back to that price (confirmation bias), all while refusing to take the loss because it feels twice as painful as a gain of the same size (loss aversion). One bad decision becomes a three-bias pileup.
The key distinction is the trigger. Anchoring starts with a specific number. Confirmation bias starts with a belief. Loss aversion starts with the emotional asymmetry between gains and losses. Knowing which bias is driving the behavior helps you apply the right counter-technique.
Frequently Asked Questions
What is anchoring bias in simple terms?
Anchoring bias is your brain's tendency to rely too heavily on the first piece of information it encounters when making decisions. In trading, this usually means fixating on a specific price (like your entry, a past high, or an analyst target) and letting that number influence your choices even when it's no longer relevant to current market conditions.
What's the most common example of anchoring bias in day trading?
The most common example is holding a losing trade because you're anchored to your buy price. Instead of evaluating whether the current setup still makes sense, you wait for price to "come back" to your entry so you can exit without a loss.
How is anchoring bias different from confirmation bias?
Anchoring bias starts with a fixed reference point (a number) that distorts your judgment. Confirmation bias starts with a belief and causes you to seek out only information that supports it. They often work together, but the root cause is different. You can be anchored to a price without consciously holding a belief, and you can have confirmation bias without a specific price anchor.
Are experienced traders affected by anchoring bias too?
Yes. Experience reduces some biases, but anchoring is deeply wired into human cognition. Experienced traders may anchor to different things (longer-term levels, historical patterns, or their own track record on a particular stock), but they're not immune. The advantage experienced traders tend to have is better systems and habits to catch it.
How can a trading journal help me detect anchoring bias?
By recording the reasoning behind every entry and exit, you create a written record you can review with fresh eyes. When you look back at your journal, patterns emerge: exits clustered around entry prices, reluctance to take setups that "moved too far," or decisions shaped by external price targets. These patterns are nearly invisible in real time but obvious on paper.
Does technical analysis create anchoring bias with support and resistance levels?
It can, if you treat those levels as absolute truth rather than probabilistic zones. A support level drawn from last month's price action is a useful tool, but if you refuse to sell below it simply because "support is there," you've turned an analytical tool into a mental anchor. The key is to treat levels as inputs to your decision.
How long does it take to reduce the effects of anchoring bias?
There's no fixed timeline. Anchoring bias is a cognitive tendency, not a habit you can break in 21 days. What improves is your ability to catch it and override it using tools like checklists, journaling, and deliberate reframing. Most traders notice improvement within a few weeks of consistent journaling and pre-trade review, but managing bias is an ongoing practice.
About the authors


Related articles

Analysis Paralysis in Trading: Why You Freeze and How to Fix It
Learn to recognize analysis paralysis in trading, understand its psychological roots, and build a decision-making framework with confident execution.
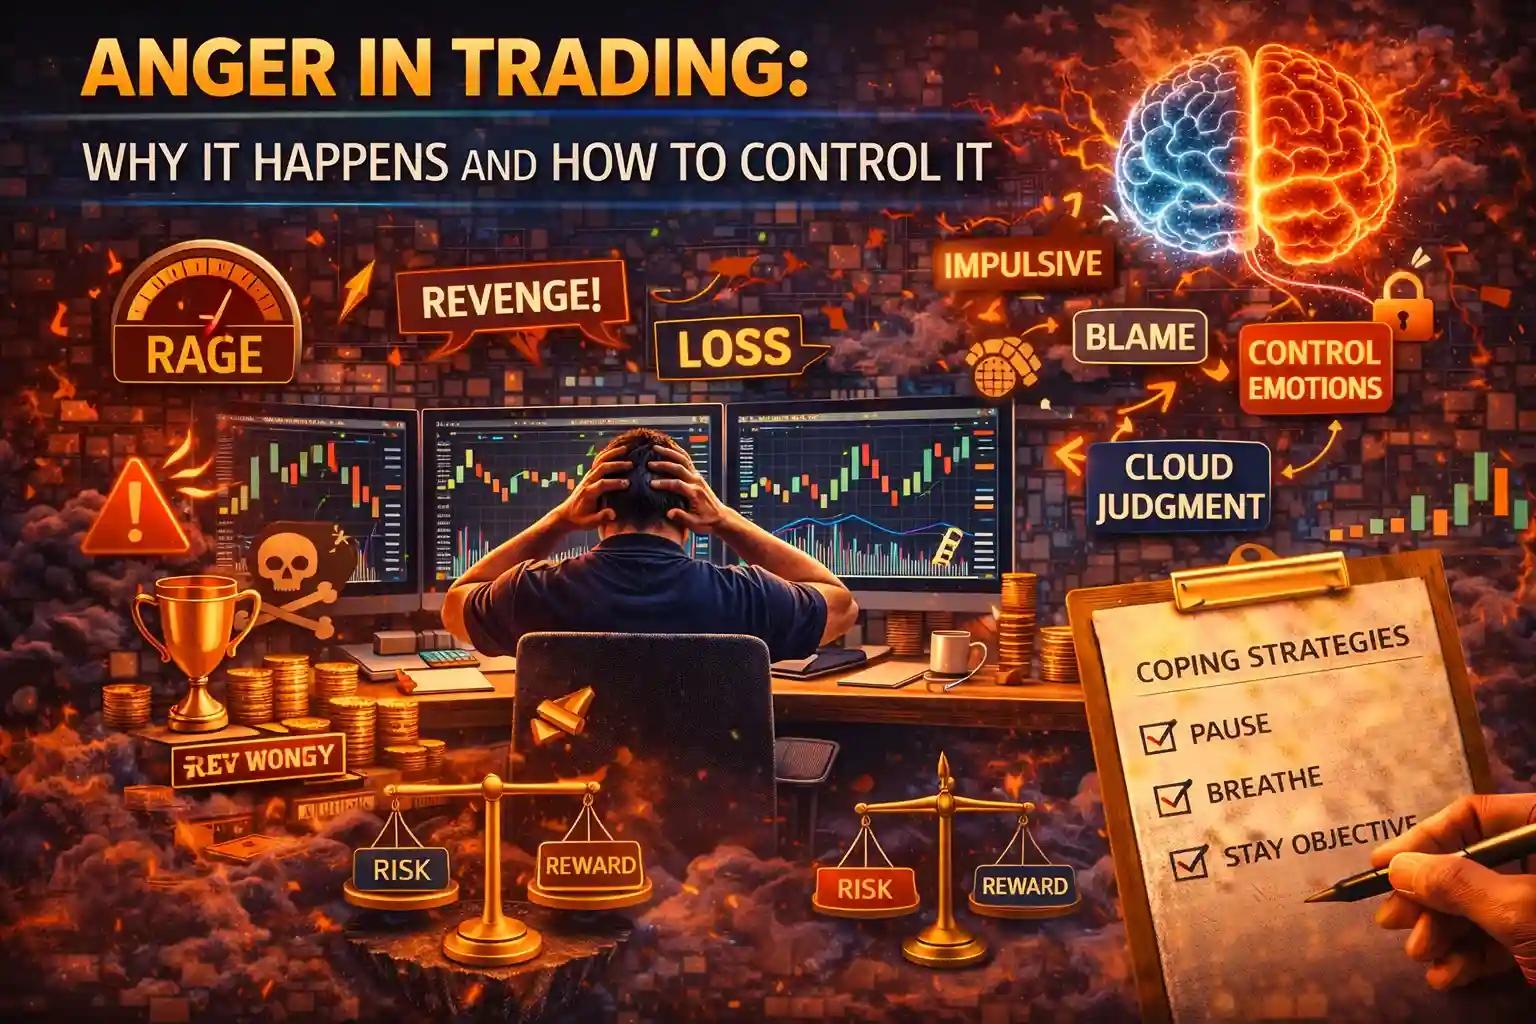
Anger in Trading: Why It Happens and How to Control It
Learn why anger strikes during trading, how it destroys performance through revenge trades and broken rules, and proven techniques to control it.
Anxiety in Trading: Understanding and Managing Doubt
Trading anxiety isn't a flaw — it's biology. Learn why doubt strikes, how it warps your decisions, and practical techniques to manage it before, during, and after every trade.
0 comments