Market Volatility Explained: What It Is and Why It Matters
Market volatility refers to how much and how quickly prices change in financial markets. It shapes how markets behave and how participants respond to price movements. Getting a handle on volatility helps you read market conditions more clearly, weigh potential outcomes, and approach trading or investing decisions with better context.
This guide covers what volatility actually means, what drives it, how it gets measured, and why it matters differently depending on your time horizon.

What Is Market Volatility?
Volatility Definition in Financial Markets
Volatility describes how much the price of a financial instrument varies over a specific period. When prices swing dramatically in either direction within a short timeframe, the market is highly volatile. When prices hold relatively steady, volatility is low.
Consider a stock that moves between $50 and $60 within a single week versus one that stays between $50 and $52 over the same stretch. The first exhibits considerably higher volatility.
Importantly, volatility doesn’t indicate direction: it captures the magnitude and frequency of price changes, regardless of whether prices are climbing or falling.
Volatility vs. Risk: Key Differences
Volatility and risk are related but not the same thing. Volatility refers specifically to price fluctuations, while risk encompasses a broader set of factors that could lead to financial loss.
Key distinctions include:
- Volatility measures observable price movement and can be quantified mathematically
- Risk includes volatility but also accounts for credit risk, liquidity risk, and the possibility of permanent capital loss
- High volatility increases uncertainty about short-term price levels but doesn’t necessarily mean an investment will lose value over time
- Low volatility doesn’t guarantee safety. Prices can remain stable before experiencing sudden declines
In other words, a volatile asset isn’t automatically a poor investment, and a stable asset isn’t automatically a safe one.
What Causes Market Volatility?
Economic Data and Events
Economic releases frequently trigger volatility. When data diverges significantly from market expectations, prices adjust rapidly to reflect the new information.
Common economic catalysts include:
- Interest rate decisions by central banks
- Employment reports and unemployment figures
- Inflation data such as Consumer Price Index releases
- Gross domestic product growth announcements
- Corporate earnings reports
Markets tend to be most volatile immediately before and after major announcements, as participants position themselves based on anticipated outcomes.
Geopolitical Factors
Political events and international developments introduce uncertainty that markets struggle to price accurately. Elections, trade disputes, military conflicts, and regulatory changes can all trigger sharp price movements.
Geopolitical volatility often affects specific regions or sectors more than others. Energy prices, for instance, may respond strongly to developments in oil-producing regions, while technology stocks might react to shifts in international trade policy.
Market Sentiment and Liquidity
Collective investor psychology plays a substantial role in volatility. Fear and uncertainty tend to amplify it as participants rush to adjust positions; confidence and optimism often correlate with calmer conditions.
Liquidity, defined as the ease with which assets can be bought or sold without affecting prices, has a critical impact on volatility. When liquidity is thin, even modest trading activity can produce outsized price movements. This explains why markets often experience higher volatility during off-hours trading or in less actively traded securities.
How Is Volatility Measured?
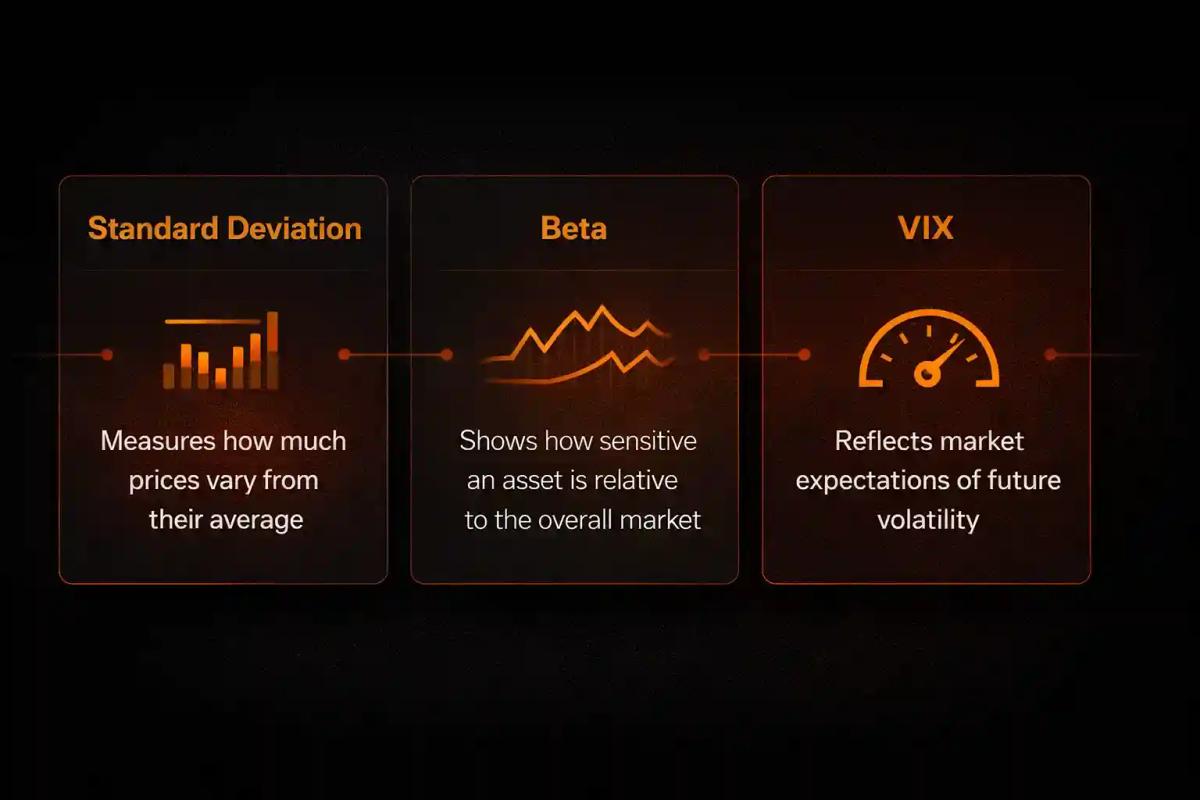
Standard Deviation
Standard deviation is the most common statistical measure of volatility. It calculates how much individual price returns deviate from the average return over a given period.
A higher standard deviation indicates that prices have fluctuated more widely around their average, suggesting greater volatility. A lower figure means prices have stayed closer to the mean, indicating relative stability.
Traders and analysts typically calculate standard deviation using daily, weekly, or monthly returns depending on their time horizon. The result is often annualized to allow comparison across different assets and timeframes.
Beta
Beta measures how much an individual security’s price moves relative to a broader market index. A beta of 1.0 means the security tends to move in line with the market. Above 1.0 suggests more volatility than the market; below 1.0 indicates less.
For example:
- A stock with a beta of 1.5 would be expected to move 15% when the market moves 10%
- A stock with a beta of 0.7 would be expected to move 7% when the market moves 10%
Beta is particularly useful for understanding how adding a specific asset might affect a portfolio’s overall volatility.
The VIX Index
The VIX, often called the “fear index,” measures expected volatility in the S&P 500 over the next 30 days. Unlike standard deviation, which looks backward at historical data, the VIX is forward-looking: it derives its value from options prices.
When the VIX is elevated, market participants expect significant price swings in the near future. When it’s low, expectations lean toward relative calm. The VIX tends to spike during periods of market stress and decline during stable, rising markets.
Types of Volatility
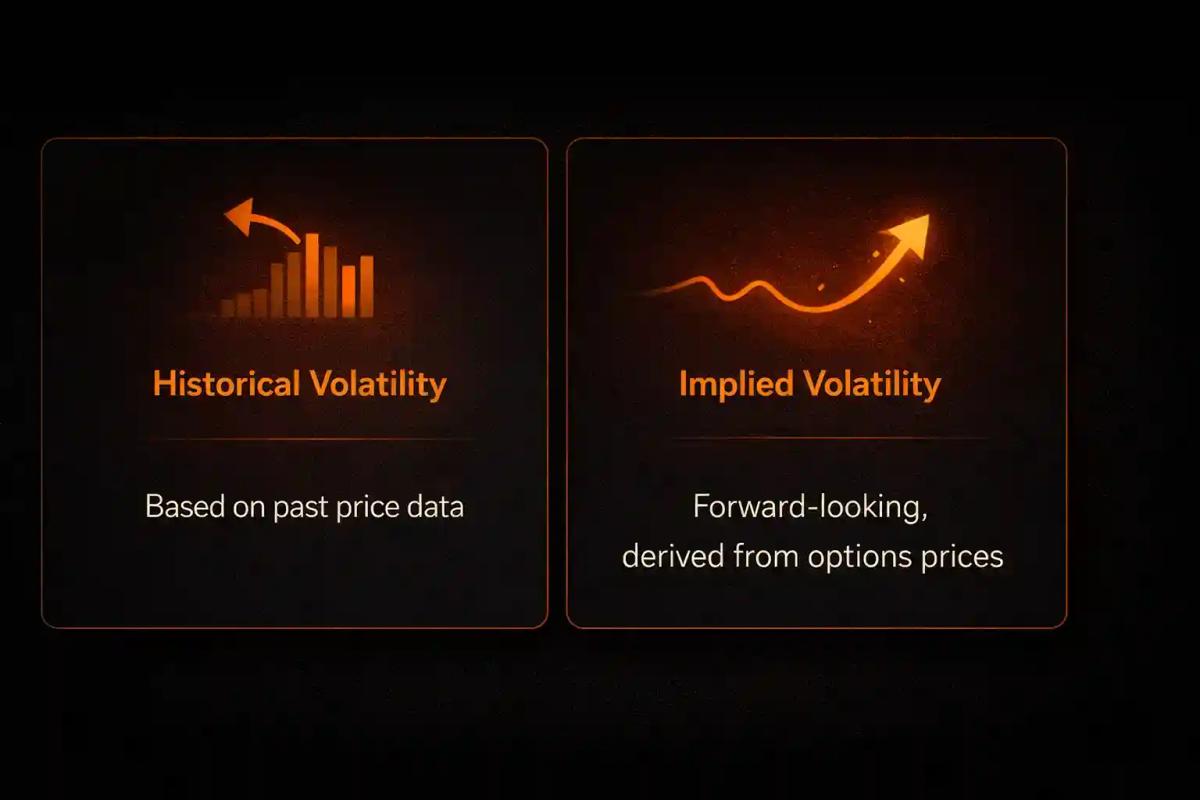
Historical Volatility
Historical volatility, also called realized volatility, measures how much prices have actually fluctuated over a past period. It’s calculated using historical price data and expressed as an annualized percentage.
Historical volatility tells you what has happened but doesn’t predict what will happen. An asset that exhibited low historical volatility can experience sudden spikes, and the reverse holds true as well. Analysts use it to establish baselines and identify when current conditions deviate from typical patterns.
Implied Volatility
Implied volatility represents the market’s expectation of future price movement. It’s derived from the prices of options contracts rather than from historical price data.
When options traders pay higher premiums, it suggests they expect larger price swings ahead, resulting in higher implied volatility. When premiums are lower, implied volatility decreases.
Implied volatility matters most for options pricing but also serves as a gauge of market sentiment. Comparing it to historical volatility can reveal whether the market expects future conditions to be more or less turbulent than recent history.
How Volatility Affects Traders and Investors
Impact on Short-Term Trading
For short-term traders, volatility creates both opportunity and risk. Higher volatility means larger potential price movements within a given timeframe, which can translate to larger gains or losses.
Short-term traders often consider:
- Position sizing adjustments based on current volatility levels
- Wider stop-loss orders during volatile periods to avoid premature exits
- The potential for slippage when executing orders in fast-moving markets
- Increased margin requirements that brokers may impose during volatile conditions
Volatility also affects which trading approaches remain viable. Strategies that depend on small, frequent price movements may struggle when volatility spikes unexpectedly.
Impact on Long-Term Investing
Long-term investors experience volatility differently. While short-term price swings can be unsettling, they matter less when outcomes are measured in years or decades.
For long-term investors, volatility considerations include:
- Recognizing that temporary drawdowns are normal and don’t necessarily indicate fundamental problems
- Understanding that volatility can create opportunities to acquire assets at lower prices
- Maintaining portfolio allocation aligned with personal risk tolerance to avoid panic selling during turbulent periods
Historical data suggests that volatility tends to diminish in significance over longer holding periods, though past patterns don’t guarantee future results.

Is High Volatility Good or Bad?
Volatility itself is neither inherently good nor bad: its impact depends on context, time horizon, and individual circumstances.
High volatility can benefit traders seeking short-term opportunities and investors looking to acquire assets at discounted prices during market downturns. It can also enable faster portfolio growth when price movements align with held positions.
On the other hand, high volatility increases uncertainty and the potential for significant losses. It can cause anxiety, trigger emotional decision-making, and make it difficult to maintain a consistent approach. For those with shorter time horizons or lower risk tolerance, elevated volatility may prove uncomfortable or inappropriate.
Low volatility offers stability and predictability but may limit profit potential for active traders. Extended periods of calm sometimes precede sudden spikes, catching participants off guard.
The appropriate level of volatility depends on your goals, timeline, and capacity to withstand fluctuations without abandoning your approach.
Key Takeaways
- Volatility measures the magnitude and frequency of price changes, not direction
- Volatility and risk are related but distinct; high volatility doesn’t automatically mean high risk of permanent loss
- Economic data, geopolitical events, and market sentiment are primary volatility drivers
- Standard deviation, beta, and the VIX are common tools for measuring volatility
- Historical volatility looks backward while implied volatility reflects forward expectations
- Volatility affects short-term traders and long-term investors differently
- Whether volatility is advantageous or problematic depends on individual circumstances and objectives
This content is for educational purposes only and does not constitute financial advice.

About the authors


Related articles
Cognitive Bias in Trading: How Mental Blind Spots Hurt Your Results
Learn how cognitive biases like confirmation bias and loss aversion affect your trading decisions. Discover practical techniques to recognize and overcome them.
Common Trading Mistakes and How to Avoid Them
Learn the most common trading mistakes that cost beginners money. Discover how to identify and avoid these errors to protect your capital and improve results.
Hedging Strategies in Trading: How to Protect Positions
Learn how hedging strategies help traders manage risk. Explore options, pairs trading, and diversification techniques with practical guidance.
0 comments