


Technical Analysis · Intermediate · 8 min read
Stochastic Oscillator Explained: Overbought, Oversold and Crossovers
The smallest momentum meter: how the stochastic oscillator works
The stochastic oscillator is a momentum indicator that compares the current closing price to the high-low range over a set lookback, usually 14 bars, producing a value between 0 and 100. It plots two lines, %K and %D, to flag potential reversals when momentum reaches an extreme. You read it to identify zones where buying or selling pressure is thinning out.
George Lane popularised the tool in the late 1950s by measuring where price closes relative to recent extremes. In an uptrend, closes tend to cluster near the top of the range; in a downtrend, closes cluster near the bottom. When closes drift away from that pattern, momentum is already shifting even if price has not yet turned.
Unlike a trend indicator, the stochastic is bounded: it cannot go above 100 or below 0, which makes extreme readings meaningful on any instrument, from an FX pair to a single-stock CFD. Because of that bounded nature, many retail traders pair it with a trend filter and use it as one component of a wider system.
The oscillator works when price is rotating inside a range or pulling back inside a larger trend. In those conditions, extreme readings mark the edges of normal oscillation. In a strong directional move, the same readings mislead: price can sit above 80 for days without reversing. The trader who confuses the two ends up fighting the trend.
Choosing where to trade matters as much as the strategy; see the best forex brokers and their conditions.
How does the Stochastic Oscillator calculate overbought and oversold levels?
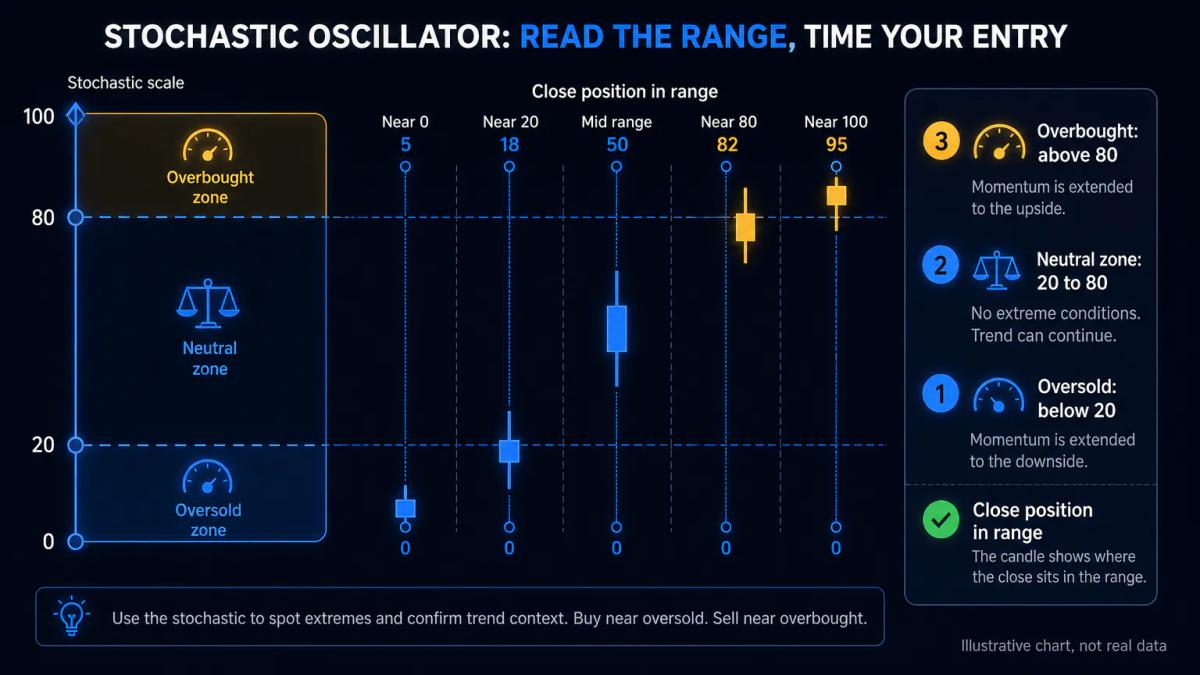
The stochastic oscillator positions the current close inside the highest high and lowest low of the lookback period. The raw formula is %K = 100 × (Close - Lowest Low) / (Highest High - Lowest Low). A reading of 100 means price closed at the top of the range; a reading of 0 means it closed at the bottom.
A value above 80 is labelled overbought: buyers have driven closes to the upper edge of the recent range, so continuation requires either fresh demand or an expansion of the range itself. A value below 20 is labelled oversold: sellers have pushed closes to the lower edge, and further downside needs new supply. These are probability zones, not automatic sell or buy signals.
In a sideways market the thresholds work as designed, because price keeps rotating between extremes. In a trending market they fail as triggers: during a strong rally the stochastic can print readings over 80 for extended runs while price keeps climbing. The 80 and 20 lines then describe trend strength, not exhaustion. Read the regime first, the signal second.
Understanding %K and %D: the two lines explained
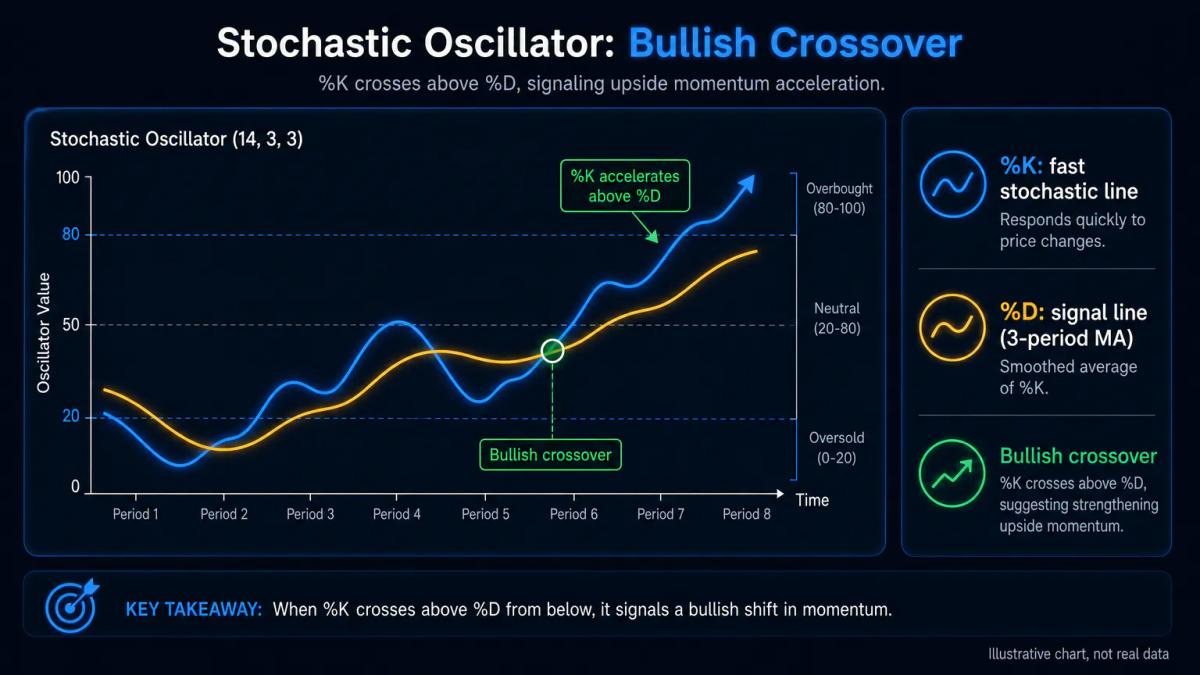
The stochastic plots two lines that move together but at different speeds. %K is the fast line, taken directly from the raw formula and often smoothed by 3 periods in what charting platforms call the slow stochastic. %D is a 3-period moving average of %K and acts as the signal line. %K reacts quickly to price; %D lags by design.
The interaction between the two is what you read. When %K rises above %D, upside momentum is accelerating; when %K falls below %D, downside momentum is accelerating. The further apart the lines move, the stronger the thrust; when they hug each other, momentum is flat and the oscillator is not giving a usable signal.
Suppose you are watching EUR/USD on a 4-hour chart. %K drops to 18 and curls up through %D while %D is still falling at 23. The cross happens inside the oversold zone, which is the configuration most traders look for. Waiting for %D itself to turn up on the next bar gives you confirmed momentum before you commit, filtering out a single-bar flicker.
Trading stochastic crossovers: entry and exit mechanics
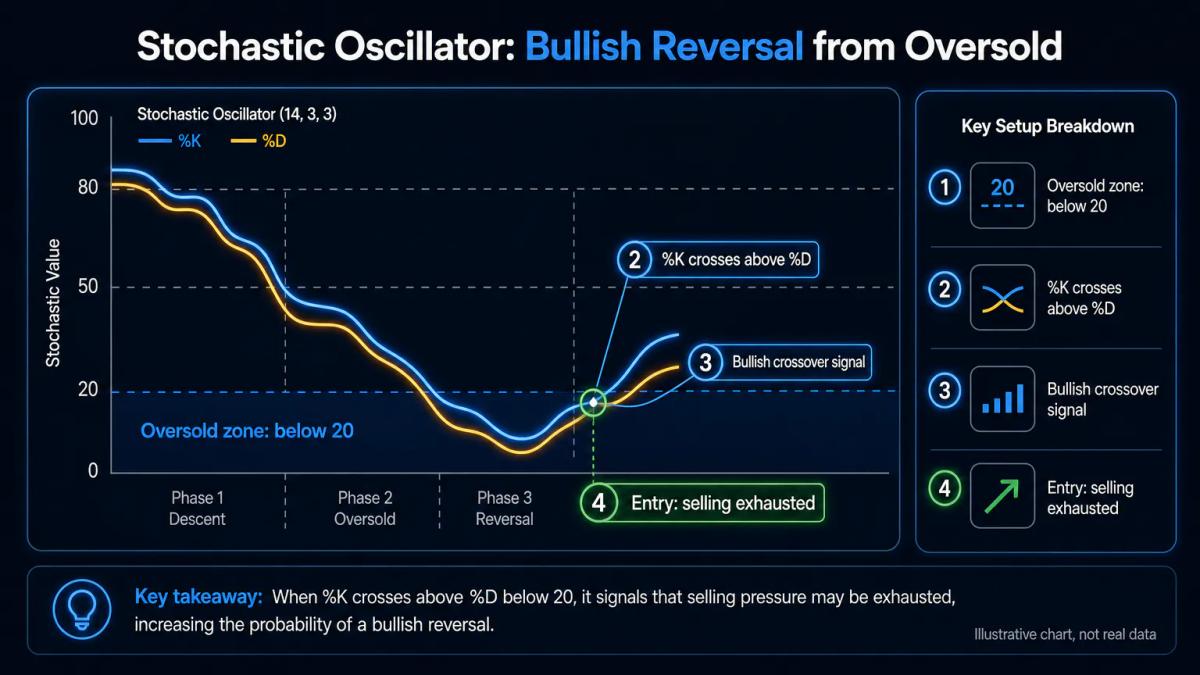
A stochastic crossover occurs when %K crosses %D, and both the direction and the location of the cross decide the quality of the signal. A bullish crossover below 20 suggests selling pressure is exhausted and price is accelerating off a low. A bearish crossover above 80 suggests buyers are losing control and price is rolling over. Crossovers in the middle band, between 20 and 80, carry little information on their own.
Execution shapes your result as much as the signal does. A clean process looks like this:
- Define the trend on a higher timeframe (for example, the daily) before taking a signal on the 4-hour or 1-hour chart.
- Wait for the crossover to complete on a closed bar; intrabar crosses often reverse.
- Place the stop loss beyond the swing high or low that produced the signal, not at an arbitrary number of pips.
- Size the position so the distance from entry to stop equals a fixed fraction of account equity, commonly 0.5% to 1% for retail accounts.
Exits deserve the same rigour, because an entry rule without an exit rule is how winning setups become losing trades. Two common approaches:
- Close when %K crosses back through the opposite threshold (80 for longs, 20 for shorts).
- Scale out at a predefined multiple of the initial risk, for example 1R and 2R, and trail the balance behind structure.
Tuning settings for different timeframes and market conditions
The default settings on most platforms are 14 for the lookback, 3 for %K smoothing and 3 for %D. Those values suit daily and 4-hour charts on liquid instruments where price swings are reasonably clean. On faster timeframes the defaults produce signal noise; on slower ones they can lag past the move you wanted to catch.
The table below shows the parameter ranges many intraday and swing traders test when they move away from the defaults.
| Timeframe | Market condition | %K period | %K smoothing | %D period | What it buys you |
|---|---|---|---|---|---|
| 5 to 15 minutes | Intraday, moderate volatility | 9 to 10 | 3 | 3 | Faster response to short swings |
| 1 hour to 4 hours | Trending or pullback trading | 14 | 3 | 3 | Balanced default, baseline for comparison |
| Daily | Range-bound or choppy | 21 | 5 | 5 | Fewer false crossovers inside the range |
| Daily to weekly | Strong trends with deep pullbacks | 34 | 5 | 5 | Signals only on meaningful exhaustion |
Each setting is a trade-off between responsiveness and reliability. Before you trade it live, run the configuration through a backtest on at least a few years of historical data for the specific instrument. Record win rate, average win-to-loss ratio and maximum drawdown (the fall from a capital peak to the trough before a new peak). A setting that posts a 55% win rate but a 30% drawdown is not usable at the position sizes most retail accounts carry.
Divergence: when price and stochastic tell different stories
Divergence appears when price and the oscillator disagree on momentum. Bullish divergence occurs when price prints a lower low but the stochastic prints a higher low, which hints that selling pressure is fading even as price slips. Bearish divergence is the mirror: price prints a higher high while the stochastic prints a lower high, which hints that buying thrust is weakening even as price climbs.
Divergence is a warning, not an entry trigger. In strong trends it can persist for many bars while price continues in the original direction. The sensible use is to pair it with a trigger: a stochastic crossover in the direction suggested by the divergence, a break of a short-term trendline, or a close back inside a prior range. Taken alone, divergence often marks a slowdown that never becomes a reversal.
Common pitfalls and how to avoid them
The most common mistake is treating every overbought or oversold reading as a signal. In a strong trend the oscillator can sit at an extreme for extended periods, and reversal trades against that flow accumulate losses quickly. Install a trend filter: a moving average on a higher timeframe, a market structure read of higher highs or lower lows, or a simple rule that bans counter-trend stochastic trades altogether.
A second pitfall is using the same inputs on every chart. A 14, 3, 3 configuration behaves differently on a 5-minute GBP/USD chart than on a daily FTSE 100 chart. Without backtesting on the specific instrument and timeframe, you are guessing.
The final pitfall is ignoring position sizing. A high-probability signal with poor risk control still produces account damage over a losing streak. Fix the risk per trade before you fix the entry rules:
- Risk a fixed percentage of equity per trade, commonly 0.5% to 1%.
- Derive position size from the stop distance, not from a round lot number.
- Cap total open risk across correlated trades (for example, several USD pairs at once).
- Review a running tally of expectancy every 20 to 30 trades and adjust before small problems compound.
For a concrete example of costs and platform, the Axi review goes through them line by line.
Frequently Asked Questions
What is the difference between the stochastic oscillator and the RSI?
Both are bounded momentum indicators that scale from 0 to 100, but they measure different things. The RSI compares average gains to average losses over a lookback, so it reflects the strength of directional moves. The stochastic compares the close to the high-low range, so it reflects where price sits inside recent volatility. In practice, RSI often works better in trending markets and the stochastic often works better in ranges and pullbacks, which is why some traders use them together as cross-checks rather than substitutes.
Can you use the stochastic oscillator on crypto and forex as well as stocks?
Yes, the formula depends only on high, low and close data, so it applies to any instrument with a price series: forex pairs, indices, commodities, equities and crypto. The caveat is that each market has its own volatility profile and session structure, so settings that work on EUR/USD will not automatically work on BTC/USD or a small-cap stock. Note that in the UK, the FCA prohibits CFDs on crypto for retail clients; the indicator still applies to spot crypto on authorised venues, but access routes differ.
What is the best stochastic oscillator strategy for day trading?
A common intraday approach uses a faster setting such as 9, 3, 3 on a 5 or 15-minute chart, combined with a higher-timeframe trend filter on the 1-hour or 4-hour chart. Entries come from %K and %D crossovers inside the extreme zones, in the direction of the higher-timeframe trend only. Stops sit beyond the swing that produced the signal, and risk per trade is capped at a fixed percentage of equity. Backtesting the exact rules on the exact instrument before trading live is non-negotiable.
How do you combine the stochastic oscillator with moving averages or support and resistance?
A simple combination is to use a 50 or 200-period moving average as a trend filter and take stochastic signals only in the direction of that average. Support and resistance zones add a second layer: a bullish crossover inside the oversold zone that coincides with a tested support level is a far higher-quality signal than one in open space. The oscillator provides the timing, while the moving average and structural levels provide the context that keeps you out of counter-trend trades in strong directional moves.
About the authors


Put this into practice
Brokers we have reviewed
Scored on the same five dimensions. Here are three of them — the full list is on the brokers page.



Related articles

Support and Resistance Trading: How to Identify and Trade Price Levels
A practical guide to support and resistance trading: how to mark levels, filter false breakouts, size positions, and apply the strategy across asset classes.

Technical Analysis Explained: Charts, Patterns, and Trading Tools
A working guide to technical analysis for retail traders: chart types, indicators, limitations, backtesting and risk management framed around real broker execution.

Technical Analysis for Swing Trading: Indicators, Setups and Timeframe Strategy
A practical framework for using charts, indicators and multi-timeframe analysis to structure swing trades that last days to weeks.
0 comments