Technical Analysis · Beginner · 7 min read
Support and Resistance Trading: How to Identify and Trade Price Levels
Support and resistance trading is a price action method where you buy near support (a zone where price has repeatedly bounced up) and sell near resistance (a zone where price has repeatedly reversed down). These horizontal areas mark supply and demand imbalances on the chart, giving you a defined entry, a logical stop loss, and a measurable target before you risk any capital.
What is support and resistance trading?
Support and resistance trading treats the chart as a map of memory: prices where buyers and sellers previously fought hard tend to matter again. Support is the price floor where demand has absorbed selling; resistance is the ceiling where supply has capped rallies.
A pip (the smallest standard price increment in forex, typically 0.0001 on major pairs) or a tick on an index becomes meaningful only when it sits near one of these zones. You trade the reaction at the level, or the confirmed break through it, rather than guessing direction in open space. The edge comes from defined risk: your stop sits just beyond the level, so a losing trade is small and a winning trade can be several times larger. Understanding technical analysis fundamentals will deepen your grasp of how price action patterns form and persist across timeframes.
How to identify support and resistance on a price chart
Identify support by marking horizontal zones where price has bounced up at least two or three times without breaking lower; identify resistance where price has reversed down repeatedly without breaking higher. Draw zones, not single lines, because real markets rarely turn at a precise price. The more touches a level has, and the more recent they are, the more relevant it is for current trading.
Multiple timeframe analysis is critical. Levels on the daily or weekly chart reflect decisions made by a much larger pool of participants than levels on the 5-minute chart, so they tend to hold longer. A common workflow is to mark the levels on the daily chart, then drop to the 1-hour or 4-hour chart to time entries. Volume spikes at a level, especially at swing highs and lows, reinforce that the zone matters, because they show real capital changed hands there rather than a thin, low-conviction wick.
Market psychology and supply-demand dynamics
Support and resistance exist because traders remember where they made or lost money. At resistance, buyers who bought too late look to exit near breakeven, adding to natural profit-taking; at support, sidelined buyers who missed the last rally place resting orders hoping for a second chance. This crowded behaviour concentrates orders at visible levels and creates the bounces you trade.
The zone holds until new information overwhelms the old memory: an earnings surprise, a central bank decision, or a shift in positioning. When that happens, the level does often flips. Broken resistance frequently becomes new support, and vice versa, because the same traders who defended it before now defend it from the other side.
Common mistakes and false breakouts
The biggest mistake is trading every touch of a level without waiting for confirmation. Price often spikes through support or resistance on thin volume, triggers stops, then snaps back, trapping traders who entered on the first tag. A second error is ignoring context: a level that dominates the daily chart may be pure noise on a 15-minute chart, and vice versa. Learning how to identify real breaks from false ones is essential to avoiding these costly traps.
False breakouts happen when price closes beyond a level but lacks the volume or follow-through to sustain the move. To filter them, require a full candle close beyond the zone on your trading timeframe, ideally accompanied by expanding volume, and prefer breakouts that occur during active session hours rather than during illiquid periods. If the break stalls within one or two candles, treat it as a failure and consider fading it back into the range.
Risk management and position sizing for support and resistance trades
Place your stop loss just beyond the level you are trading: if you buy at support, put the stop roughly 2 to 3% below the zone, or a fixed multiple of average true range; if you sell at resistance, put it the same distance above. This gives the level room to be tested without knocking you out on random noise.
Size the position so that a stop loss hit costs no more than 1 to 2% of account equity. Divide your dollar risk by the distance from entry to stop to get the position size in units or lots. A lot in forex is a standardised contract, typically 100,000 units of the base currency for a standard lot. Tighter stops allow larger positions; wider stops require smaller ones. Risk stays constant across trades, which is what protects capital through the inevitable losing streaks.
Advanced techniques: Fibonacci, pivot points, and moving averages
Fibonacci retracements project support and resistance from the ratios of a prior swing; after a strong rally, the 38.2%, 50% and 61.8% retracement levels frequently act as support on pullbacks. Pivot points calculate levels mathematically from the previous session's high, low and close, which makes them objective and widely followed in forex and index futures.
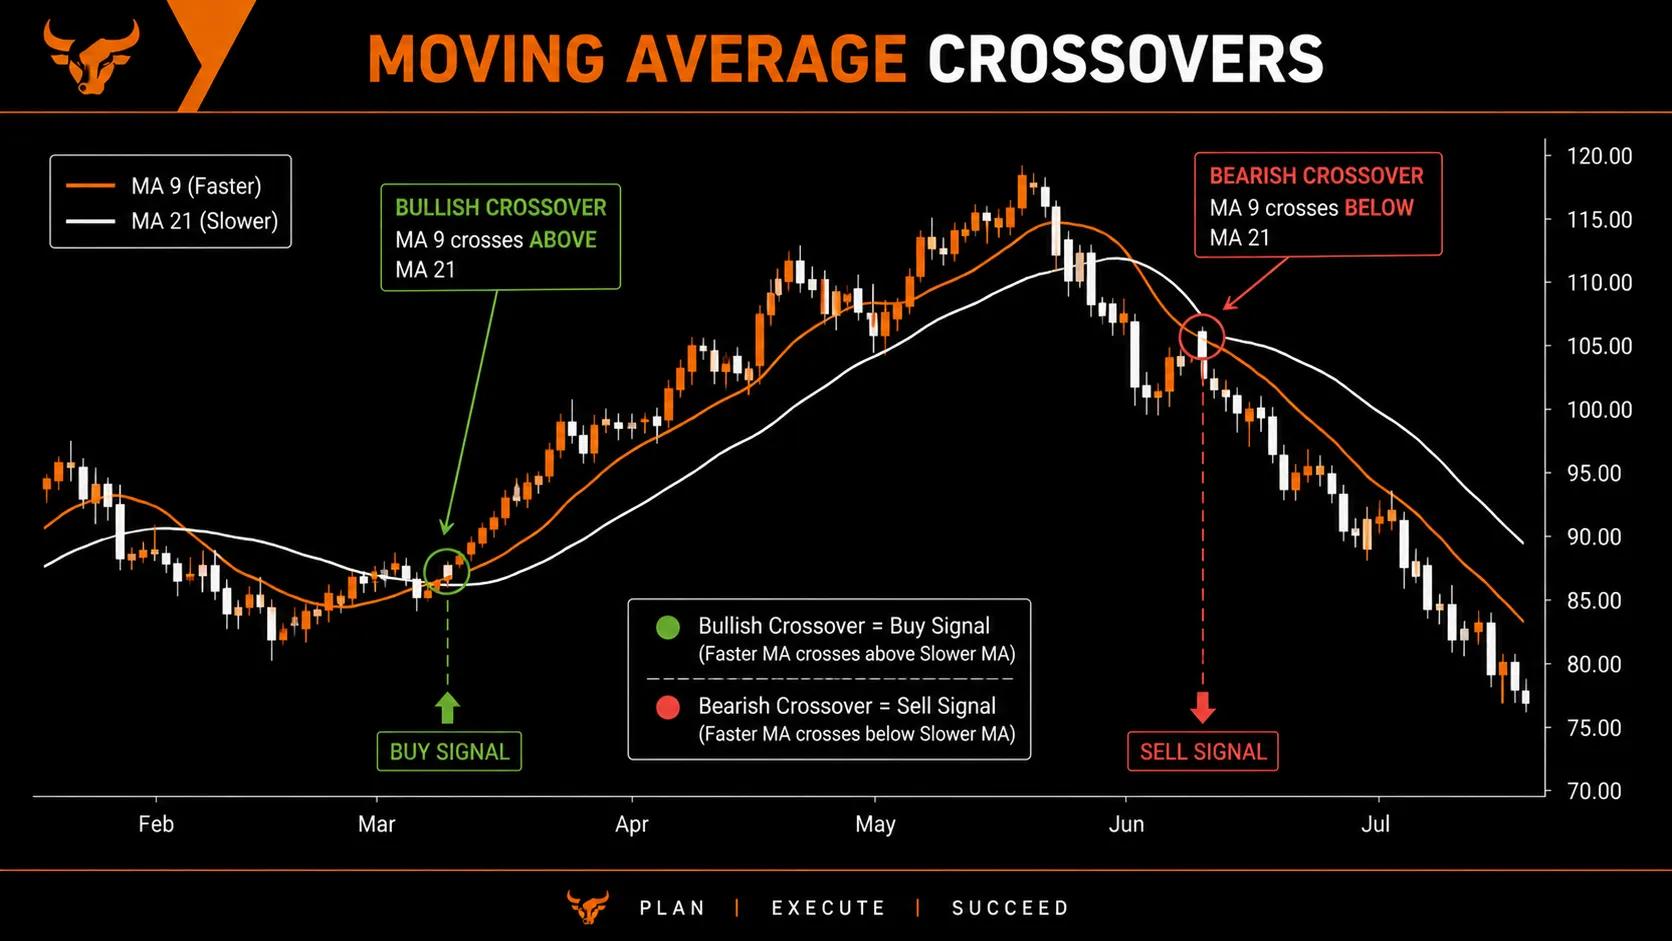
Moving averages, the 20, 50 and 200-period are the most watched, act as dynamic support and resistance that adjusts with the trend. Price often bounces off the 50-period on healthy pullbacks and breaks the 200-period only on genuine trend changes. Stack these tools with horizontal zones: a Fibonacci 61.8% level that coincides with a prior swing low and the 200-period moving average, for example, raises the probability of a setup meaningfully compared with any single method used alone.
Support and resistance across different asset classes
Support and resistance work on forex pairs, stock indices, individual equities, commodities and cryptocurrencies, because every market reflects supply and demand. Forex majors on the 4-hour chart often produce tight, well-respected levels driven by session opens and central bank speak. Equities respect round numbers (£100, $500, $1,000) as psychological anchors, and gap opens can invalidate a level overnight.
Commodities like crude oil and gold move on geopolitical and macro news, which can slice through technical levels in minutes. Cryptocurrencies trade 24/7 with wider swings, so zones need to be drawn generously and stops widened accordingly. Adjust position size to each asset's typical volatility rather than using the same risk distance everywhere.
Confirmation tools and volume validation
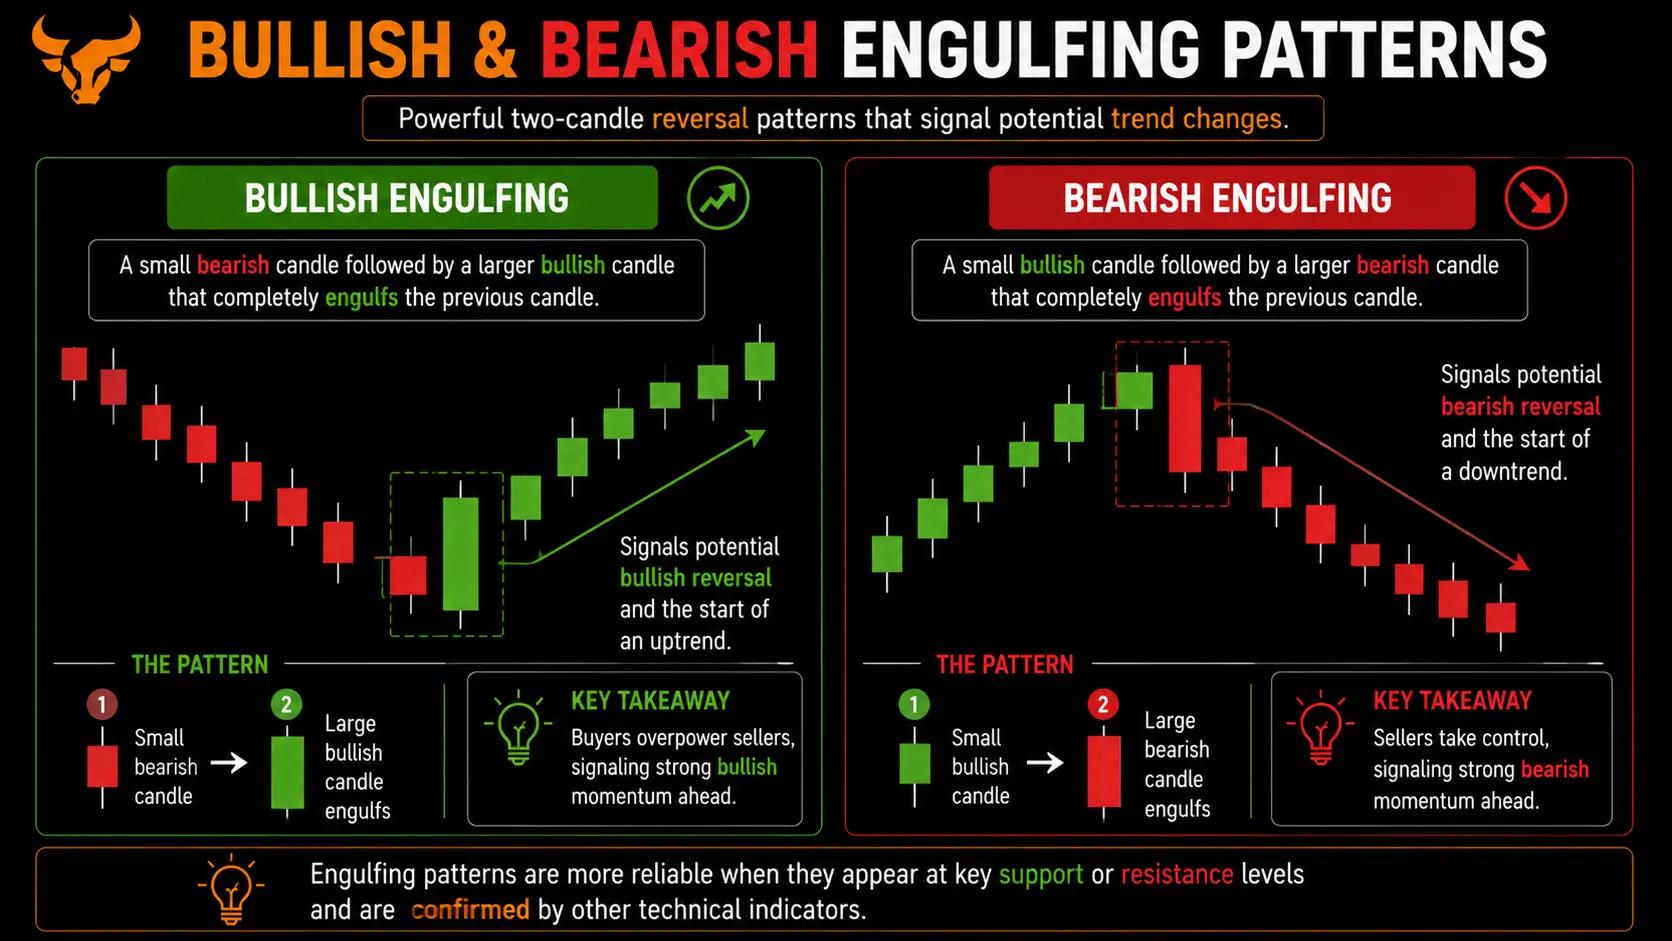
Volume is the single most reliable confirmation. A bounce off support on expanding volume signals real buyers stepping in; a break of resistance on shrinking volume signals a move that may not hold. Candlestick patterns at the level add conviction: a pin bar, a candle with a long wick rejecting the level and a small body, or a bullish engulfing candle at support are classic entry triggers.
Secondary tools sharpen the read. RSI, Relative Strength Index, a momentum oscillator scaled 0 to 100, divergence at a level often precedes a reversal, and a short-term moving average crossover can confirm that momentum has turned. The rule of thumb: never trade a level in isolation, wait for at least one independent confirmation before committing risk.
Frequently Asked Questions
How many times must price touch a level before it becomes valid support or resistance?
Two touches make a level tentative; three or more touches confirm it as significant. Each additional touch adds weight, but very old levels lose relevance if price has traded far away for a long time. Focus on recent, well-tested zones on your trading timeframe.
Can support and resistance levels be used on all timeframes, or are they more reliable on longer charts?
They work on any timeframe, but longer charts (4-hour, daily, weekly) produce more reliable levels because they reflect decisions from a much larger pool of traders. Short-term charts generate more levels but more false signals; use higher timeframes to define the map and lower ones to time entries.
What is the difference between a support level breaking and a false breakout?
A genuine break shows a full candle close beyond the level on expanding volume, with follow-through in the next candles. A false breakout pokes through the zone on thin volume or a single wick, then reverses within one or two candles, often trapping traders who entered on the first touch.
How do you adjust your support and resistance strategy when trading volatile assets like cryptocurrencies?
Draw zones wider to accommodate larger wicks, widen stops to a multiple of average true range rather than a fixed percentage, and reduce position size so total dollar risk per trade stays at 1 to 2% of equity. Prefer higher timeframes (4-hour or daily) to filter out the constant intraday noise.
Should you trade every bounce off support and resistance, or wait for additional confirmation?
Wait for confirmation. The highest-quality setups combine the level with at least one extra signal: a rejection candle (pin bar or engulfing), a volume spike, an RSI divergence, or confluence with a moving average or Fibonacci ratio. Trading every touch blindly guarantees exposure to false breakouts.
About the authors


Related articles
Moving Averages Explained: SMA, EMA, and How Traders Use Them
Moving average trading explained simply. Learn how SMA and EMA work, how to read crossovers, and how traders use them to spot trends and time entries.
Candlestick Patterns Explained: A Practical Visual Guide
Candlestick patterns explained for new traders: read doji, hammer, and engulfing signals with clear visual chart examples.

Demo to Live Trading Guide: How to Make the Switch Without Blowing Up
Learn how to move from demo to live trading without blowing up. Covers mindset, position sizing, and your first week live.
0 comments