Technical Analysis · intermedio
Candlestick Patterns Explained: A Practical Visual Guide
Candlestick patterns are visual signals on a price chart that show you how buyers and sellers fought for control over a set period. Reading them well gives you a faster, clearer sense of market sentiment than a plain line chart can, and that clarity matters most when you are deciding whether to enter, exit, or stay out of a trade.
This guide walks you through the anatomy of a single candle, the core patterns worth knowing, and how to read them in context so you can name them correctly on a live chart. By the time you reach the end, the shapes that once looked like random red and green blocks will start to read like a running commentary on the battle behind the price.
How to Read a Candlestick
Before any pattern can mean a thing to you, you have to read a single candle the way you read a face. One candle holds four separate pieces of information inside one small shape, and once you can pull them apart, a chart full of bars turns into a story you can actually follow.
Anatomy of a Single Candle
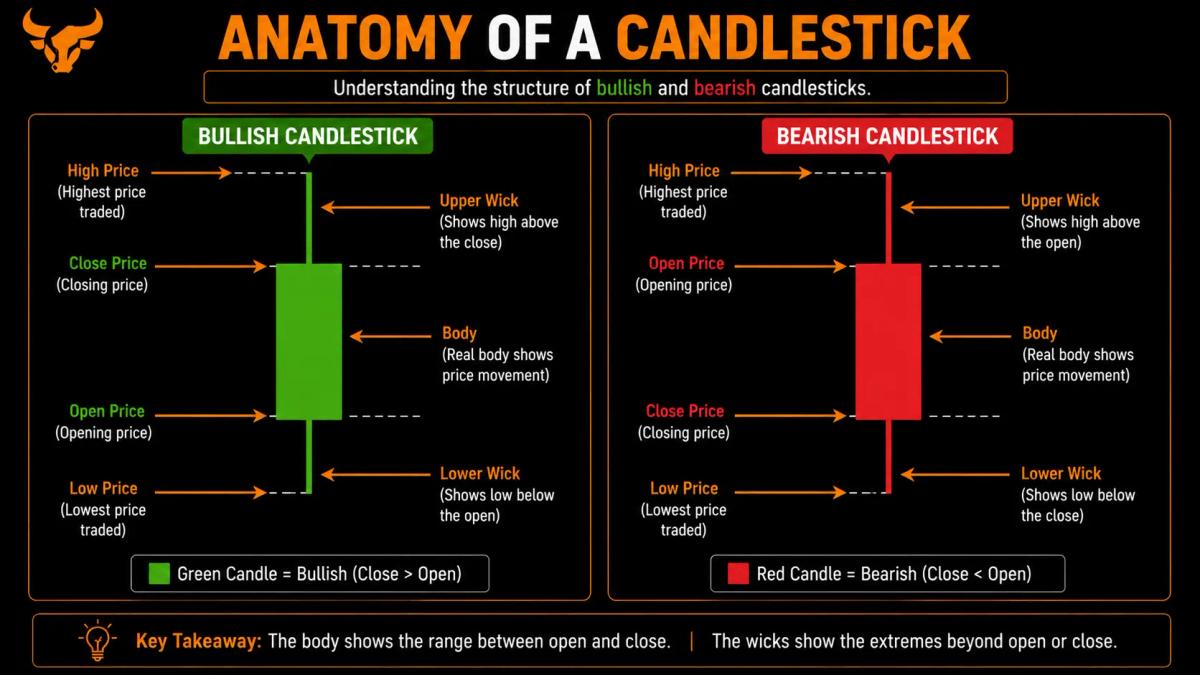
The body is the thick rectangle that stretches from the open to the close. The thin lines above and below, called wicks, mark the high and low of the period. A long upper wick shows how far buyers pushed price before getting knocked back, while a long lower wick shows how deep sellers dug before buyers clawed it back. A long body tells you one side clearly dominated. A small body squeezed between long wicks tells you neither side could settle the argument.
Think of the body as the final score and the wicks as the highlight reel of everything that happened in between. Price can travel a long way during a single period and still finish close to where it started, and the wicks are what preserve that journey for you. Two candles can close at the exact same price yet tell completely different stories: one with stubby wicks describes a quiet, one-sided session, while one with long wicks on both ends describes a session where control changed hands more than once before settling. Learning to weigh the body against the wicks is the single most useful reading skill you can build, because it is the foundation every pattern rests on.
Bullish vs Bearish Candles
A bullish candle closes higher than it opened and usually shows up green or white. A bearish candle closes lower than it opened, shown red or black. The size of the body tells you how decisive the move was.
Colour tells you who won the period, but size tells you by how much. A tall green body means buyers ran the show from open to close with little resistance, while a short green body means buyers edged ahead by a hair and could just as easily have lost their footing.
The same logic runs in reverse for red candles. When you scan a chart, you are really reading a sequence of these small verdicts, each one a snapshot of conviction. That is why a single candle is worth understanding on its own before you ever try to combine several of them into a pattern. Once the individual candle makes sense, the groupings start to click into place.
Why Candlestick Patterns Matter
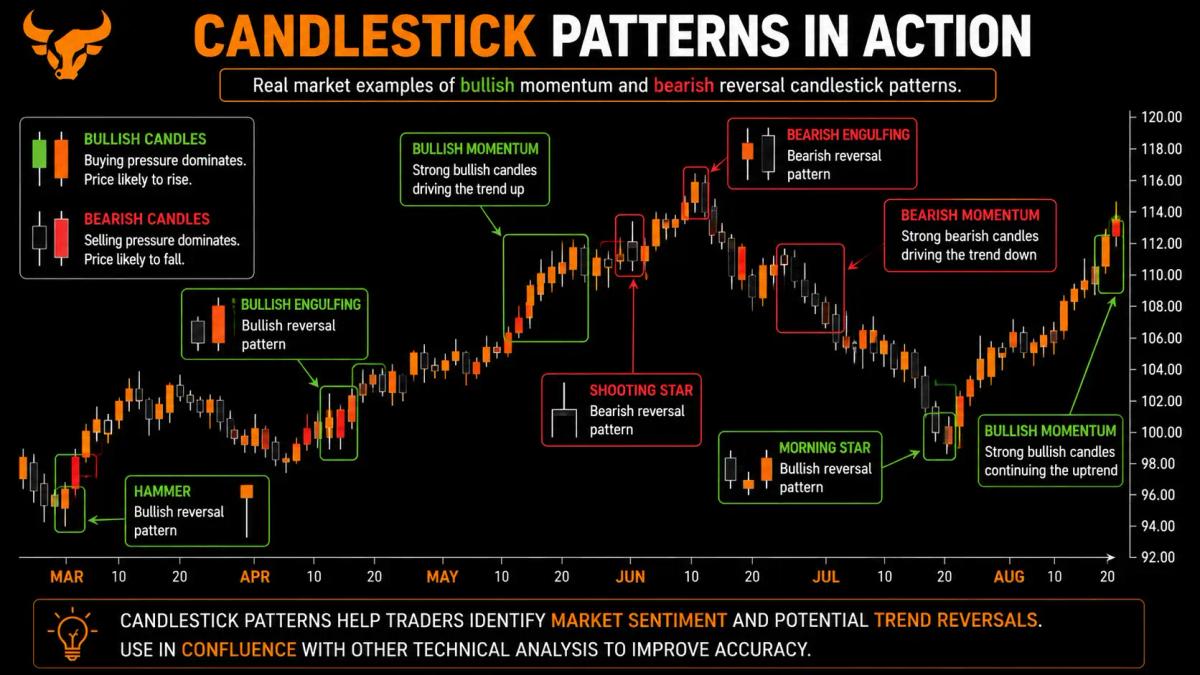
Patterns compress crowd psychology into shapes you can recognise at a glance. Each one offers a clue about what buyers and sellers might do next, and none of them promises an outcome. They are most useful as one signal among several that you weigh together before acting.
The appeal is speed. A trained eye can glance at a formation and absorb in a second what would take several sentences to describe: who pushed, who pushed back, and who finished in control. That efficiency is why these patterns have stuck around for so long and why traders across every market still reach for them. Behind each shape sits the same raw material, human behaviour under pressure, and that behaviour tends to repeat because the emotions driving it stay remarkably consistent over time.
It helps to treat a pattern as a question rather than an answer. A formation flags a moment worth a closer look. It does not hand you a decision. The traders who get the most out of candlesticks are the ones who use them to narrow their attention, then bring in other tools to confirm what they are seeing. Hold that mindset and everything that follows will be far more useful to you.
Single-Candle Patterns
Some of the most powerful messages on a chart come from a single candle standing alone. These are the formations you will spot first and lean on most, because they need no surrounding context to start whispering something about the crowd.
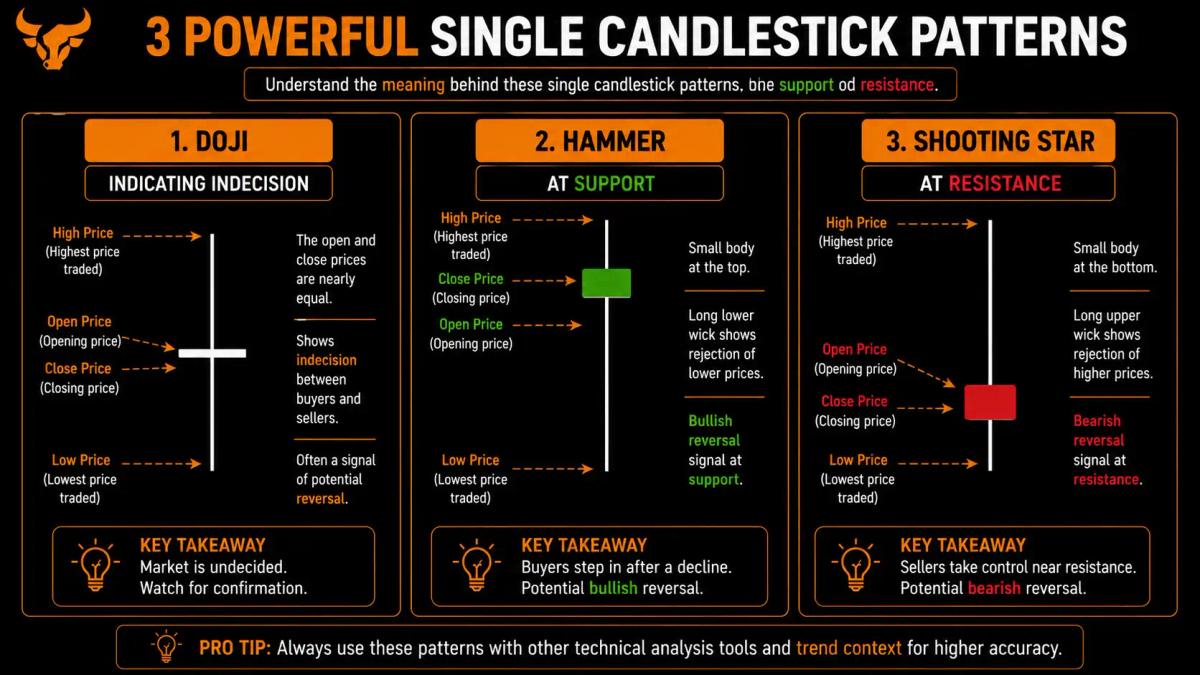
Doji: A doji forms when the open and close sit almost on top of each other, leaving a tiny body. Neither side managed to close the period in its favour, which signals indecision, the chart equivalent of a shrug. It carries the most weight after a strong run in either direction, when the crowd's conviction suddenly wavers. The point to absorb is location: a doji floating in the middle of a flat, directionless stretch tells you little, because indecision is the baseline there anyway. The same doji landing at the top of a sharp rally is far more interesting, because it shows momentum stalling right when buyers were supposed to be in command.
Hammer and Hanging Man: Both show a small body near the top of the range above a long lower wick. When a hammer appears after a downtrend, it tells you sellers drove price down hard before buyers shoved it back up, hinting at a possible bounce. The hanging man wears the same shape after an uptrend, where it warns that the rally may be losing its grip. The shape is identical, so the context does all the talking. That long lower wick is the story in both cases: price fell sharply, then got rejected and recovered before the close. After a decline, that rejection looks like buyers stepping in. After a climb, the same dip suggests cracks forming beneath an advance that looked safe.
Shooting Star: After an uptrend, a shooting star shows a small body near the bottom of the range with a long upper wick. Buyers pushed price well up, then sellers dragged it back down, which points to a possible reversal lower. Picture it as the mirror image of the hammer. The long upper wick is the tell, marking the spot where buyers ran out of room and sellers took the period back. Arriving at the end of an uptrend, it reads as a warning that the climb is meeting resistance it cannot break.
Two-Candle Patterns
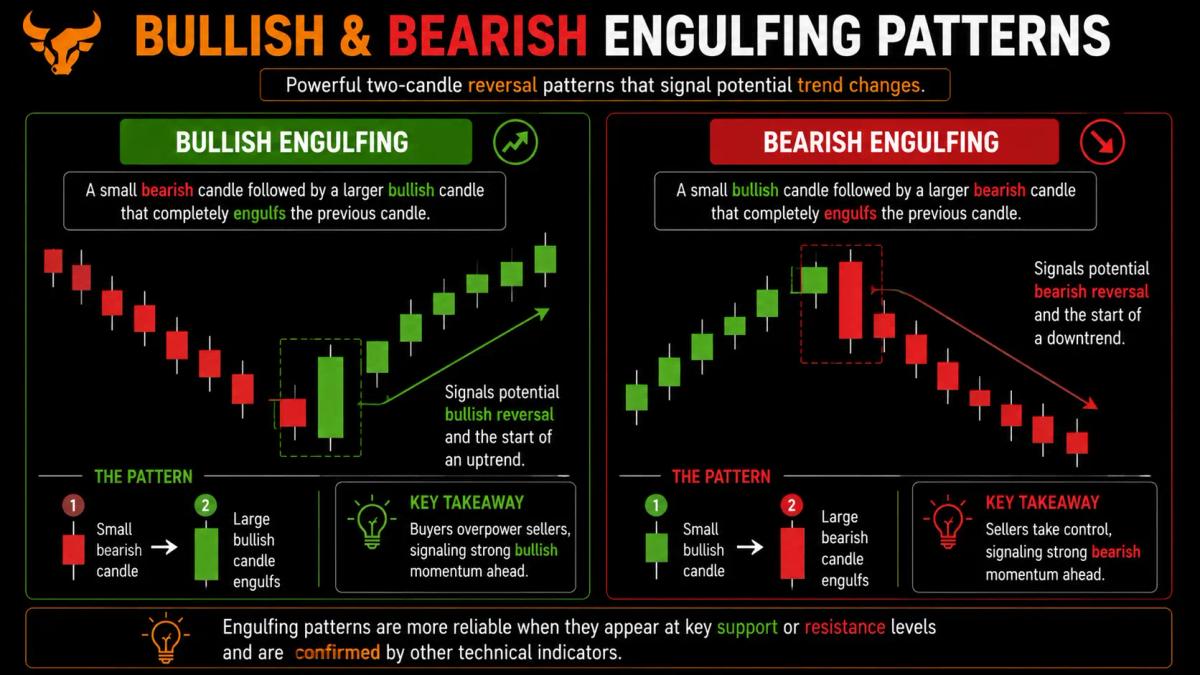
When two candles work together, the message sharpens. The second candle reacts to the first, and that interaction often reveals a shift in control more clearly than either bar could alone.
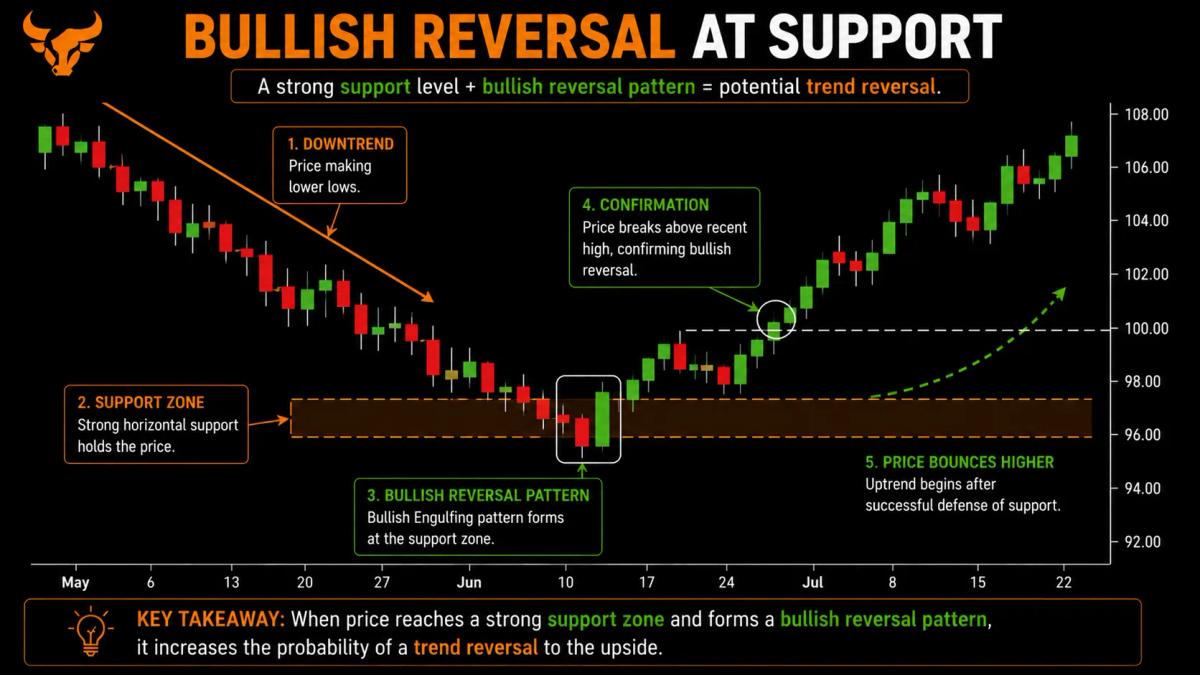
Bullish Engulfing: After a downtrend, a small red candle is followed by a larger green candle whose body fully engulfs it, a sign that buyers overwhelmed the prior selling. The visual is hard to miss once you know it, because the green body wraps right around the red one as if erasing the previous period. That complete takeover is the point. A day of selling gets answered and then some, which is why it carries more weight than a lone bullish candle floating without context.
Bearish Engulfing: After an uptrend, a small green candle is followed by a larger red candle that swallows it whole, showing sellers seized control decisively. Flip the colours and the meaning flips with them. The larger red body consuming the prior green one says that whatever optimism drove the earlier gain has been wiped out in a single period, and sellers now hold the upper hand.
Piercing Line: This appears after a downtrend, when a red candle is followed by a green one that opens lower and then closes above the midpoint of the red body. The midpoint is the threshold that matters. By pushing back above the halfway mark of the previous decline, buyers signal that they have recovered meaningful ground rather than just nibbling at the edges.
Dark Cloud Cover: This appears after an uptrend, when a green candle is followed by a red one that opens higher and then closes below the midpoint of the green body. It is the bearish counterpart to the piercing line, and the same midpoint logic applies. Sellers reclaim more than half of the prior gain, which suggests the advance is meeting real pressure rather than a brief wobble.
Three-Candle Patterns
Three-candle patterns tell a fuller story, with a beginning, a turning point, and a confirmation. Because they take longer to form, they tend to carry more conviction when they finally complete.
Morning Star: After a downtrend, a long red candle is followed by a small-bodied star that shows indecision, then a long green candle that confirms buyers have taken over. Read it as a three-act sequence: heavy selling, a pause where the momentum stalls, then a decisive push higher. The middle candle is the hinge, the moment the crowd loses conviction in the downtrend, and the third candle is the answer.
Evening Star: After an uptrend, a long green candle is followed by a small-bodied star, then a long red candle that confirms sellers have stepped in. It is the morning star turned upside down. Strong buying, a stall, then a firm move lower that suggests the rally has handed control to the other side.
Three White Soldiers: Three long green candles in a row show buyers in sustained control. This one describes steady, repeated buying across three periods, each candle building on the last. The consistency, rather than a single dramatic turn, is what makes it notable.
Three Black Crows: Three long red candles in a row show sellers driving the move steadily lower. It mirrors the three white soldiers: three periods of persistent selling that point to sustained pressure rather than a one-off shock.
Reversal Patterns vs Continuation Patterns
This is the distinction that separates traders who memorise shapes from traders who actually understand them. Knowing what a pattern is matters far less than knowing what kind of message it carries, and that message falls into two broad groups.
A reversal pattern suggests the current trend may be running out of road. Hammers, shooting stars, engulfing candles, and star formations all fall into this group, and they tend to appear after extended moves. A continuation pattern suggests the trend is likely to resume after a brief pause. The practical takeaway is that the same shape can mean very different things depending on where it lands. A pattern at the tail end of a long climb is asking you to consider that the move is tired, while a similar formation in the middle of a healthy trend may simply mark a breather before the next leg. Position within the trend is the lens that brings every pattern into focus.
How to Use Candlestick Patterns in Practice
Spotting a pattern is the easy part. Using it well is where most of the work lives, and it comes down to context and discipline rather than the shape itself.
Reading Patterns in Context
Three pieces of context decide how much a pattern is worth.
- Trend: A reversal pattern carries more weight at the end of an extended move. The further a market has stretched in one direction, the more meaningful a sign of exhaustion becomes.
- Support and resistance: A pattern that forms at a key level is far more telling than one with no clear level nearby. When a formation lines up with a price area the market has respected before, you have two signals agreeing rather than one floating in isolation.
- Volume: Strong participation tells you real money stands behind the move. A pattern backed by heavy volume reflects broad agreement, while the same shape on thin volume may just be a handful of trades nudging the price around.
Stack these three together and your read rests on reasons rather than a hunch. So how do most people get it wrong?
Common Mistakes to Avoid
The common errors are easy to name:
- Trading patterns in isolation, with no regard for trend, level, or volume.
- Ignoring the timeframe, and treating a one-minute formation as if it carried the same weight as a daily one.
- Forcing a pattern onto a chart that does not really show one, because you want a setup to exist.
- Skipping risk management, and letting a single read decide more than it should.
Each of these mistakes traces back to the same root, which is asking a pattern to do more than it can. A candlestick formation narrows your attention and improves your odds of reading the crowd correctly. It does not remove the need for judgement, planning, or a firm grip on how much you are willing to risk on any single idea.
Frequently Asked Questions
How reliable are patterns without confirmation?
On their own, not very. Treat a pattern as a clue that prompts a closer look rather than a reason to act. Confirmation from trend, levels, or volume is what turns a shape into a usable signal.
What is the difference between a doji and a spinning top?
A doji has a near-zero body and shows a genuine standoff between buyers and sellers. A spinning top has a small but visible body, so it still leans slightly one way while reflecting a similar lack of strong conviction.
What is the best timeframe?
Daily and weekly charts give patterns more weight, while shorter timeframes tend to produce more noise. The longer the period a candle represents, the more activity it summarises, which makes the signal steadier.
How do I tell a reversal from a continuation?
Location within the trend is the key. Reversal patterns show up at the end of extended moves, while continuation patterns tend to appear as pauses inside an ongoing trend.
Do patterns work across markets?
Yes. They appear across stocks, forex, crypto, and commodities, because they reflect human behaviour rather than the specifics of any one market.
What is the simplest confirmation for beginners?
Check three things: the trend the pattern appeared in, whether it sits at a key support or resistance level, and the volume backing it. When those line up with the pattern, you have a far stronger read than the shape alone.
About the authors


0 comments