



Technical Analysis · Beginner · 7 min read
Ascending Triangle Chart Pattern: Definition, Setup, and Trading Rules
The ascending triangle is a bullish continuation pattern. You use it to time entries in an uptrend, with a measured target equal to the triangle's height projected upward.
What is an ascending triangle chart pattern?
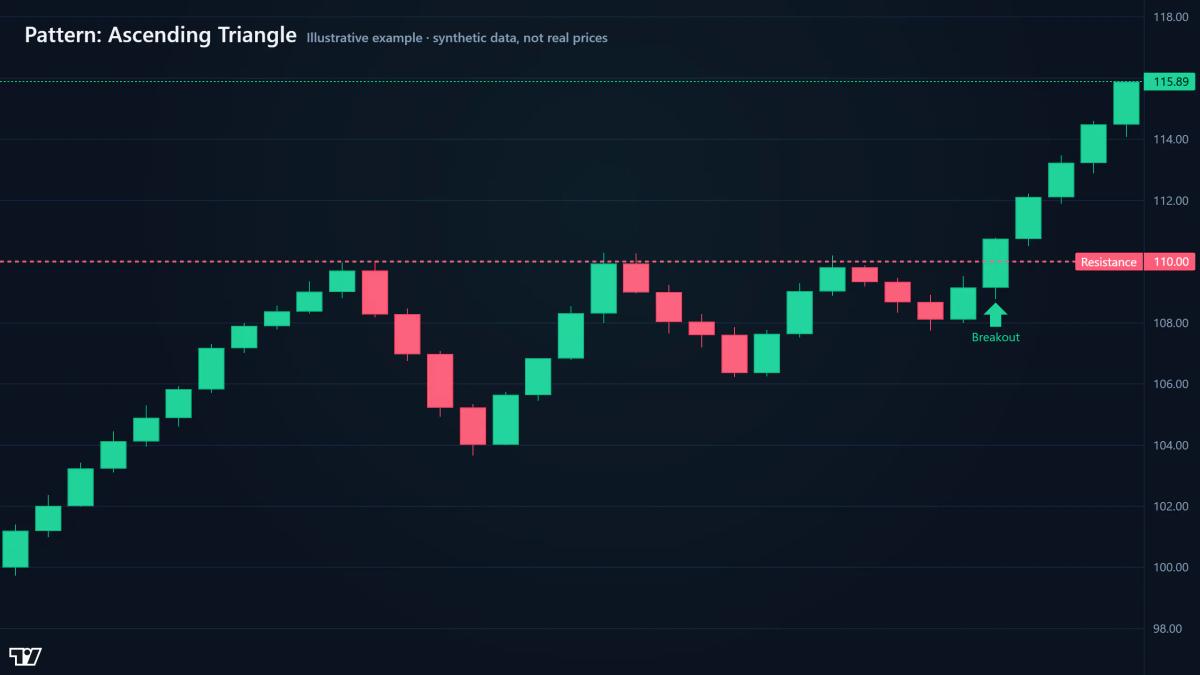
An ascending triangle is a consolidation shape that forms when buyers keep pushing higher lows into a fixed ceiling. That ceiling is a horizontal resistance line, the price level where sellers repeatedly cap the move. The floor is a rising support line connecting progressively higher lows. As the two lines converge, the range tightens and pressure builds toward a breakout.
The pattern is bullish because demand is absorbing supply at the same level, and each dip gets bought at a higher price than the last. It usually forms inside an existing uptrend, which is why it's called a continuation pattern. It can appear at the end of a downtrend and act as a reversal, but that's less common and requires stronger volume confirmation.
How to identify an ascending triangle on your chart
Look for at least two swing highs that stall at roughly the same price and at least two swing lows that step higher. A swing high is a peak with lower highs on either side; a swing low is the mirror image at a trough. Draw a horizontal line through the highs and a rising trendline through the lows. The two lines should converge to the right.
Most ascending triangles form over 5 to 20 bars. Fewer than five touches and the shape is arbitrary; more than 20 and momentum tends to fade. The pattern is cleaner on daily and 4-hour charts, though it also appears on 15-minute and 5-minute charts during active sessions such as the London and New York overlap. Intraday examples fire faster and fail more often, so treat them as shorter-horizon trades.
Market structure matters. An ascending triangle inside an established uptrend, above a rising 200-period moving average, breaks out with a higher hit rate than one forming in a sideways or downward market. Check the broader trend before you take the signal.
Volume confirmation and breakout mechanics
Volume confirmation separates a real breakout from a trap. During the consolidation phase, volume typically declines as the range narrows: fewer traders act while price coils. The breakout above the horizontal resistance line should arrive with a visible surge in volume, ideally at least 1.5 to 2 times the average of the prior 10 to 20 bars. Trading signals rely on this kind of volume confirmation to distinguish genuine moves from noise.
The measured target is the height of the triangle added to the resistance level. If resistance sits at $52 and the widest part of the triangle is $4, the projected target is $56. This is a first target, not a guarantee. Many traders scale out half the position at the measured objective and trail the rest behind a moving average.
Entry choice affects results. An aggressive entry takes the first close above resistance; a conservative entry waits for a pullback that retests the broken line as new support. The retest entry misses some moves but avoids most false starts.
Stop loss placement and risk management
A stop loss is a resting order that closes your trade if price moves against you by a set amount. For an ascending triangle, place the stop below the most recent swing low inside the pattern, or just below the ascending support line. This keeps you in the trade while the structure is intact and takes you out when it breaks.
Position size follows from the stop distance. If your account is $10,000 and you risk 1% per trade, you have $100 to lose. If the distance from entry at $52 to stop at $50.50 is $1.50, your size is $100 divided by $1.50, or roughly 66 shares. Leverage trading mistakes like undersizing stops and oversizing positions are why the FCA publishes retail trader loss rates on CFDs: fix both and you remove the largest single cause of blown accounts.
Failed breakouts and false signals
An ascending triangle fails when price pushes above resistance and then closes back inside the pattern within one to three bars, or when it breaks the ascending support line before ever testing the ceiling. Both outcomes invalidate the setup. The most common failure mode is a low-volume push through resistance during a quiet session, followed by a sharp reversal when the New York or London session opens and real flow arrives.
Exit rules for a failed pattern should be defined in advance. If price closes back below the broken resistance line, treat that as a fake breakout and close the trade at market. If price breaks the ascending support line before any breakout, the pattern is dead: do not wait for the horizontal line to be tested. Waiting for a daily close above resistance, rather than an intraday spike, filters out most false signals on higher timeframes.
Ascending triangle vs descending and symmetrical triangles
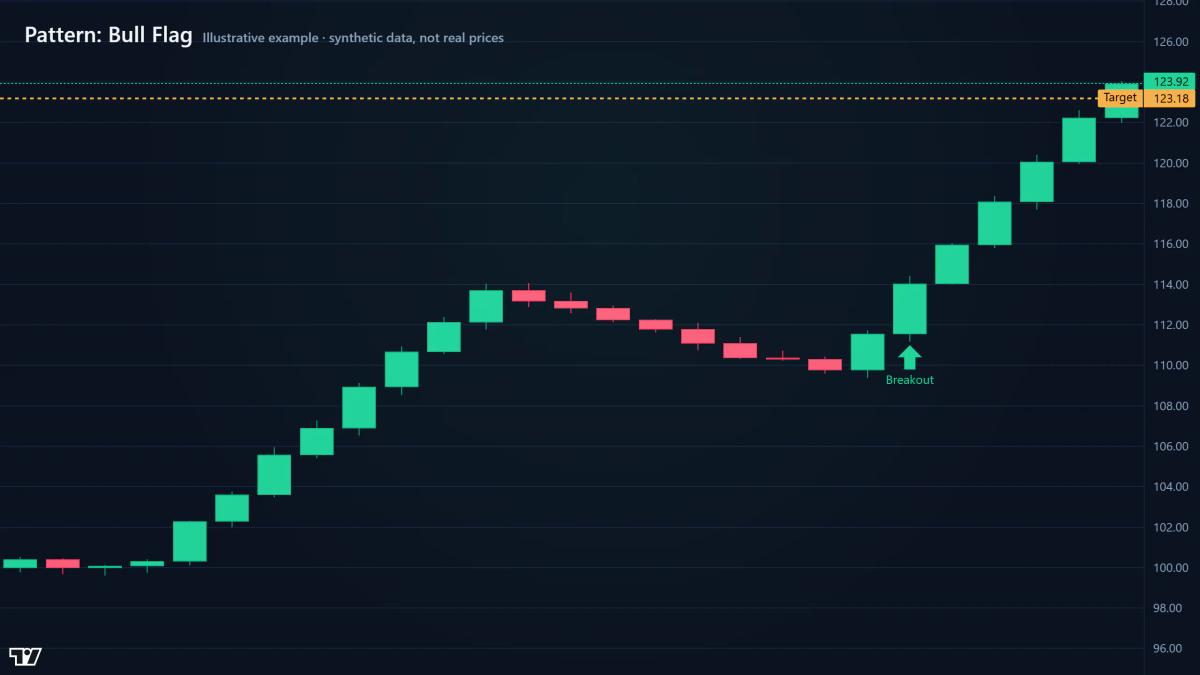
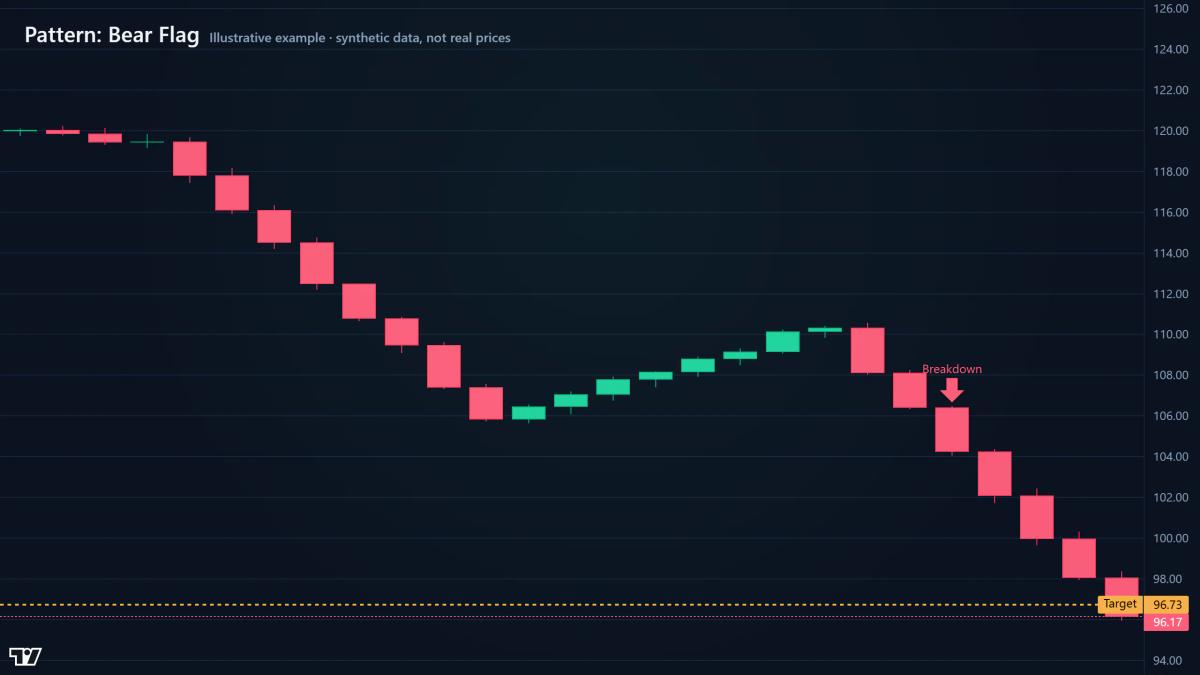
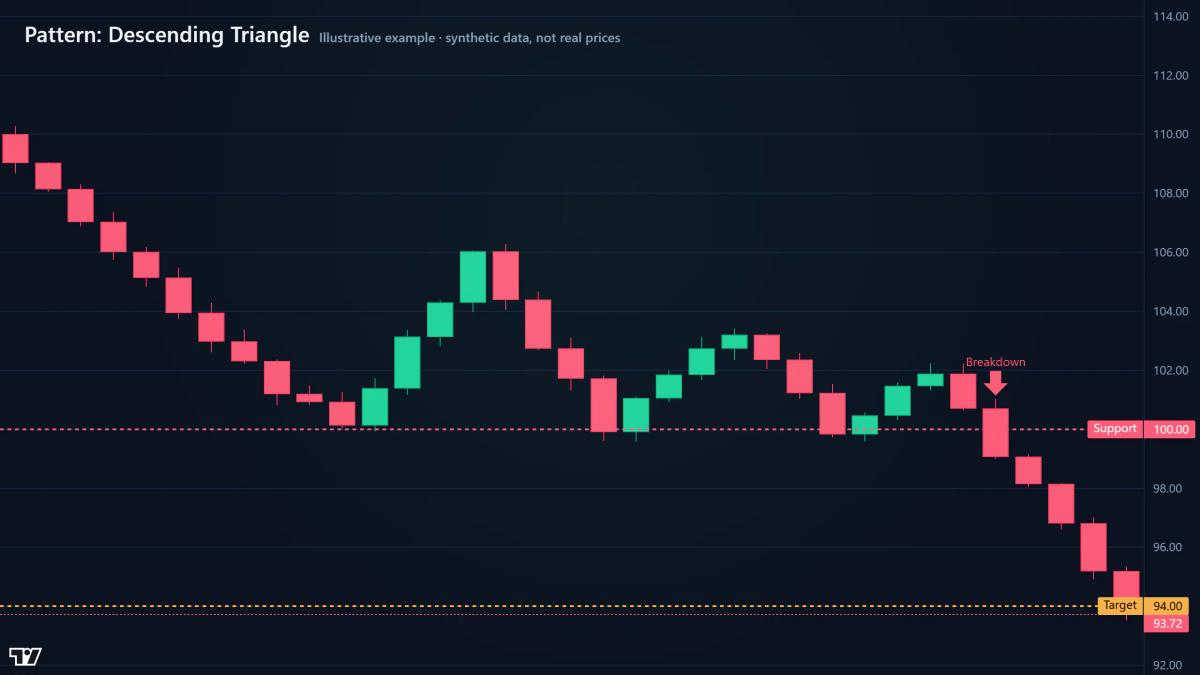
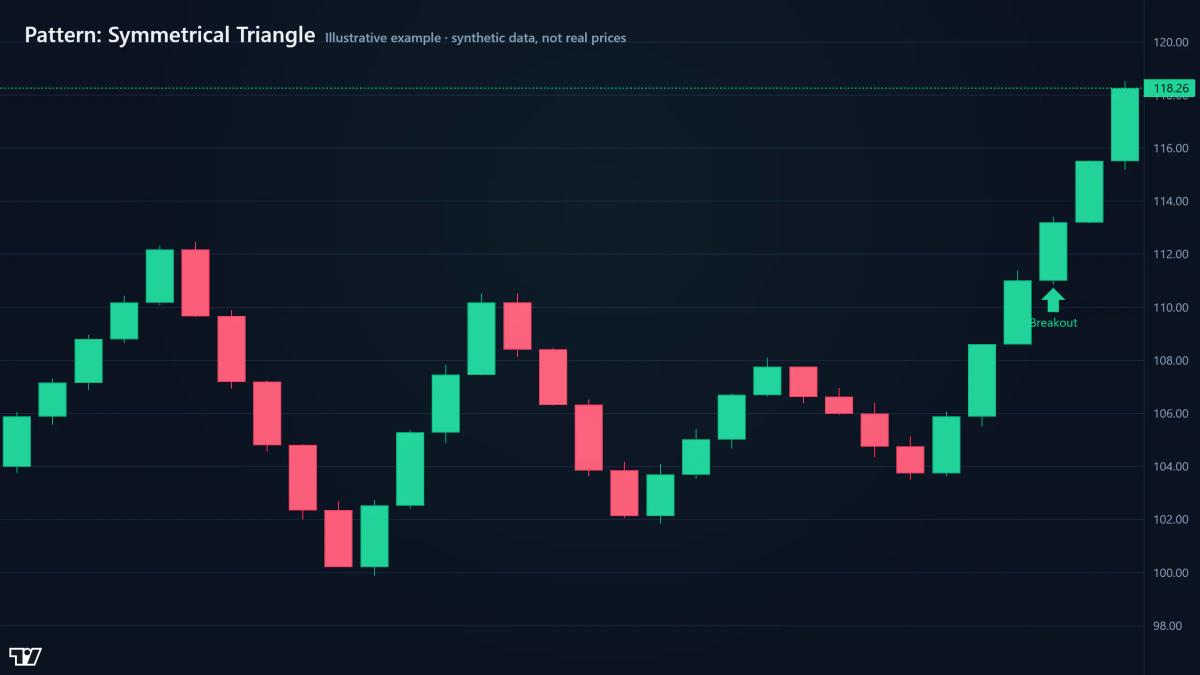
The three triangle patterns share a converging structure but signal different things. Like the bull flag and bear flag continuation patterns, triangles are defined by their boundaries and the direction they break. The table below summarises the differences.
| Feature | Ascending triangle | Descending triangle | Symmetrical triangle |
|---|---|---|---|
| Upper boundary | Flat resistance | Descending trendline | Descending trendline |
| Lower boundary | Rising trendline | Flat support | Rising trendline |
| Directional bias | Bullish | Bearish | Neutral until breakout |
| Typical context | Uptrend continuation | Downtrend continuation | Either trend, or range |
| Volume behaviour | Declines, then expands on upside break | Declines, then expands on downside break | Declines, then expands on breakout in either direction |
| Measured target | Height added above resistance | Height subtracted from support | Height projected in breakout direction |
Bias comes from which line breaks. A symmetrical triangle has no built-in bias: you wait for price to pick a side and confirm with volume. An ascending triangle already leans bullish because buyers are lifting the floor into a fixed ceiling. A descending triangle leans bearish because sellers are pressing the ceiling down into a fixed floor. Read the shape before you read the direction.
Using oscillators and moving averages with ascending triangles
Oscillators and moving averages filter weak setups. The Relative Strength Index (RSI), a momentum gauge that runs from 0 to 100, often shows bullish divergence during the triangle: price makes higher lows while RSI does too, confirming demand. A breakout above resistance with RSI crossing above 50 carries more weight than one where RSI is fading. Watch for the opposite as a warning: rising price highs with falling RSI highs point to weakening momentum and a higher chance of failure.
The Moving Average Convergence Divergence (MACD) indicator, which tracks the gap between two moving averages, adds a second layer. A MACD line crossing above its signal line as the breakout prints reinforces the trade. A rising 50-period moving average sloping under the pattern gives structural support to the bullish case.
Frequently Asked Questions
What is the minimum number of touches needed to confirm an ascending triangle pattern?
You need at least two touches on the horizontal resistance line and two touches on the rising support line, giving four points in total. Three touches on each line is stronger, because it confirms that buyers and sellers are consistently defending the same levels. Fewer than four total touches and the shape is closer to random price action than a defined pattern.
How long does an ascending triangle typically take to form before a breakout occurs?
Most ascending triangles form over 5 to 20 bars on the chart timeframe you are watching. Patterns that resolve before five bars often lack enough participation to signal reliably. Patterns that drag on past 20 bars tend to lose momentum, and the eventual breakout is weaker. As a rough guide, the pattern should break out before price reaches the apex where the two lines meet.
Can an ascending triangle appear on intraday charts like the 5-minute or 15-minute timeframe?
Yes, ascending triangles appear on every timeframe, including 5-minute and 15-minute charts. Intraday patterns work best during high-liquidity sessions such as the London and New York overlap, when volume is genuine. Outside those sessions, thin volume produces more false breakouts. Treat intraday triangles as shorter trades with tighter stops and smaller targets, not as multi-day swing setups.
What happens if price breaks below the ascending support line before reaching the resistance level?
If price closes below the ascending support line before testing resistance again, the pattern is invalidated. This is a bearish signal, because it shows that buyers have stopped defending the rising floor. Do not wait for the horizontal line to be retested; exit any anticipatory long position and consider whether the broader trend is turning. The failure often precedes a sharper downside move.
How do you calculate the profit target after an ascending triangle breakout?
Measure the vertical height of the triangle at its widest point, from the horizontal resistance line down to the lowest swing low that starts the pattern. Add that distance to the resistance level to get the measured target. For example, if resistance is at $100 and the widest point of the pattern is $8, the projected target is $108. Use this as a first objective, not a guaranteed destination.
About the authors


Related articles
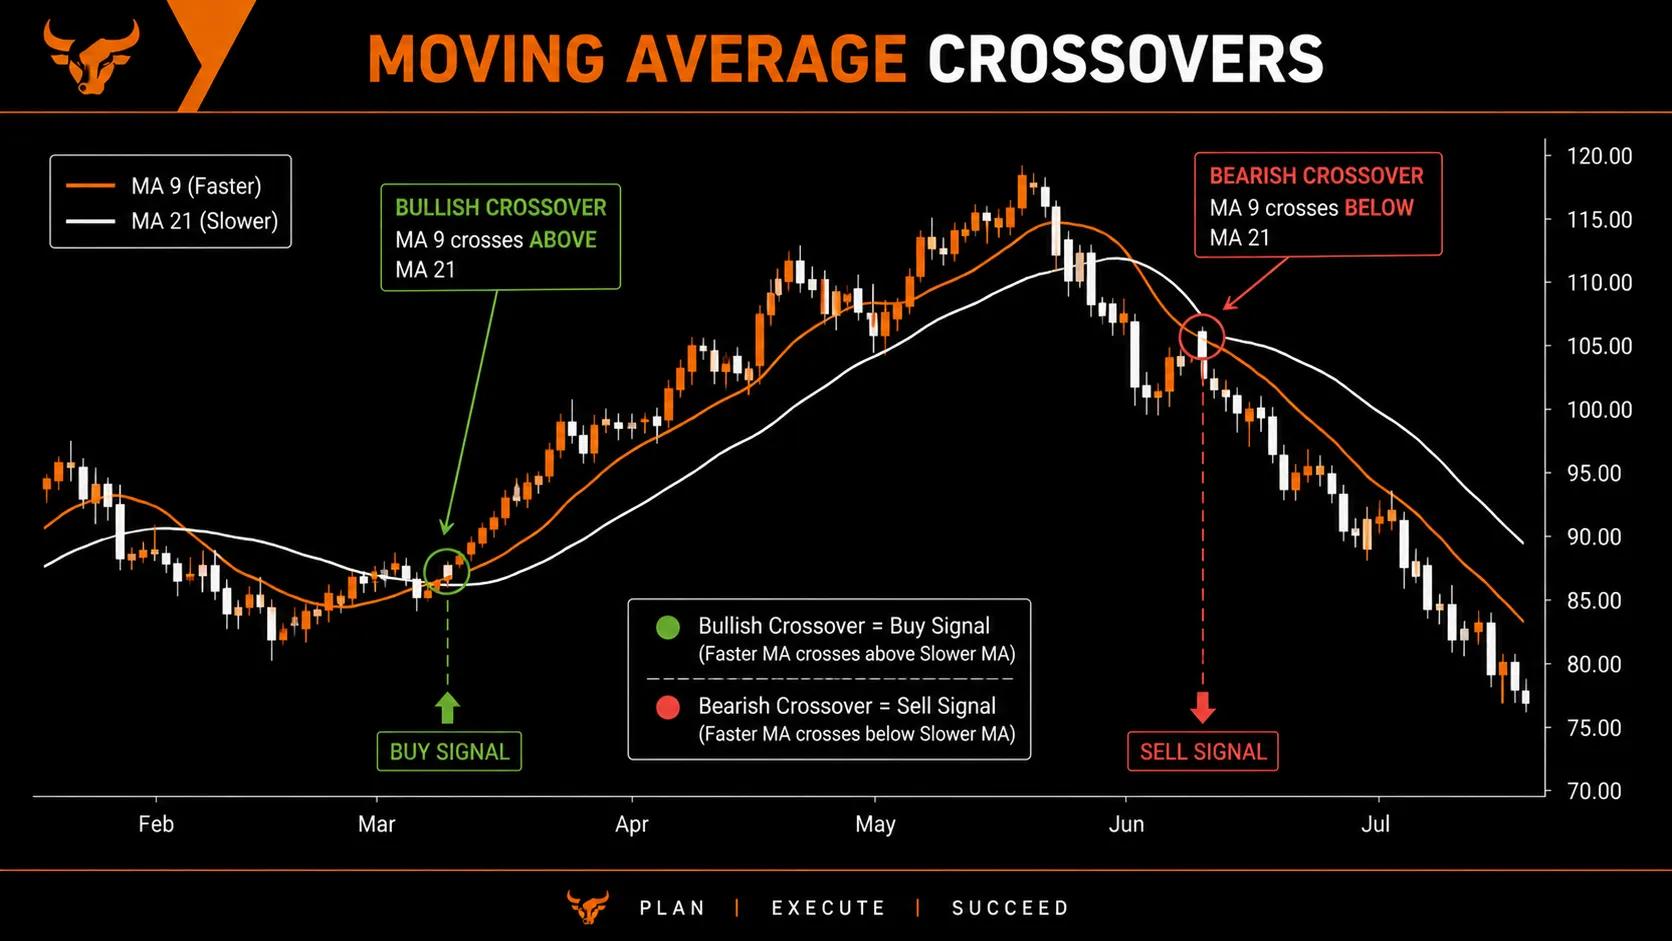
Moving Averages Explained: SMA, EMA, and How Traders Use Them
Moving average trading explained simply. Learn how SMA and EMA work, how to read crossovers, and how traders use them to spot trends and time entries.
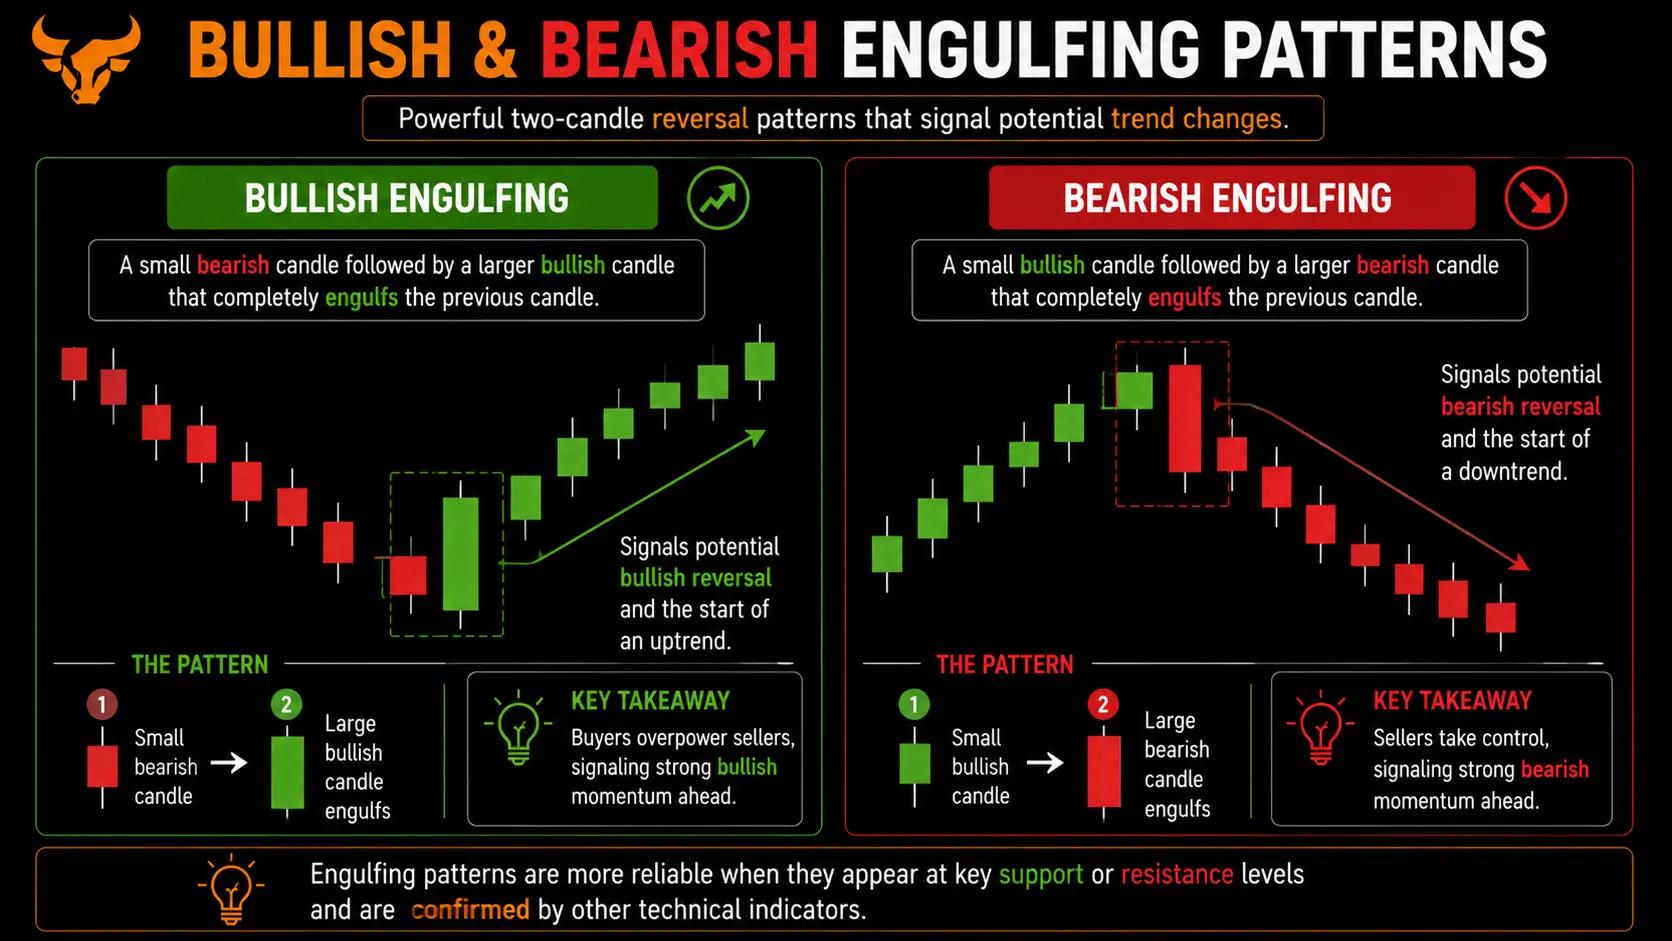
Candlestick Patterns Explained: A Practical Visual Guide
Candlestick patterns explained for new traders: read doji, hammer, and engulfing signals with clear visual chart examples.

ATR indicator explained: measuring volatility and setting stops
A practical guide to the ATR indicator: calculation, stop loss placement, position sizing, limitations in ranging markets, and behaviour across asset classes.
0 comments