



Technical Analysis · Beginner · 7 min read
Bull Flag vs Bear Flag: How to Spot and Trade Continuation Patterns
The distinction between bull flags vs. bear flags comes down to one thing: which way did price move before the consolidation started. A bull flag forms after a sharp rally and signals more upside once price breaks above the pause. A bear flag forms after a sharp sell-off and signals more downside on a break below. Both are continuation patterns.
Bull Flag vs Bear Flag: What's the Difference
The simplest way to tell them apart is to look at what came before the pattern.
- A bull flag needs a strong rally as its flagpole (the vertical run that precedes the consolidation), followed by a tight sideways or slightly downward drift that acts as the flag.
- A bear flag needs a strong sell-off as its flagpole, followed by a shallow upward drift as the flag.
Both patterns represent a pause: buyers or sellers rest, weak hands exit, and the dominant side gathers strength for another push. Continuation means the breakout goes in the same direction as the flagpole, not against it. The primary difference between a bull flag and a bear flag is not the shape of the consolidation, which looks nearly identical in both cases, but the direction of the move that created it and the direction of the eventual breakout.
Understanding how to identify market trends will help you spot the flagpole before the consolidation forms.
These tools work best on good charting software: the best forex brokers.
Anatomy of a Bull Flag: Flagpole and Consolidation
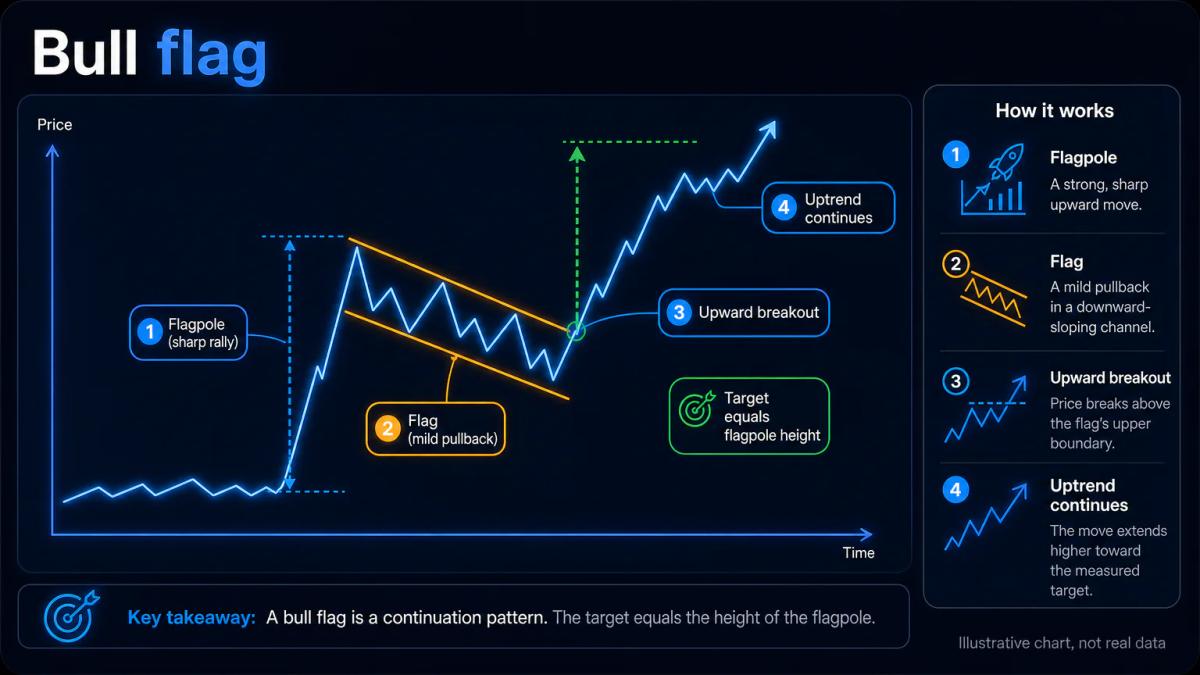
A bull flag has two visible components you can measure on the chart.
- The flagpole is a near-vertical rally, typically covering several bars with limited pullback and rising volume.
- The flag itself is a consolidation zone where price drifts sideways or slopes gently downward, bounded by two roughly parallel or slightly converging trendlines.
During the flag phase, the range narrows, candles get smaller, and volume drops away from the peak seen in the flagpole. That volume contraction matters: it tells you supply is thinning rather than that sellers are taking control. The pattern typically resolves within 5 to 20 bars on the timeframe you are watching; longer consolidations start to look more like rectangles or wedges and lose the flag character.
A clean bull flag keeps the pullback shallow, ideally holding above the 38.2% Fibonacci retracement of the flagpole (a common measurement that marks a modest counter-move within a strong trend). Deeper pullbacks weaken the setup and increase the risk that the pause becomes a reversal.
Anatomy of a Bear Flag: Structure and Formation
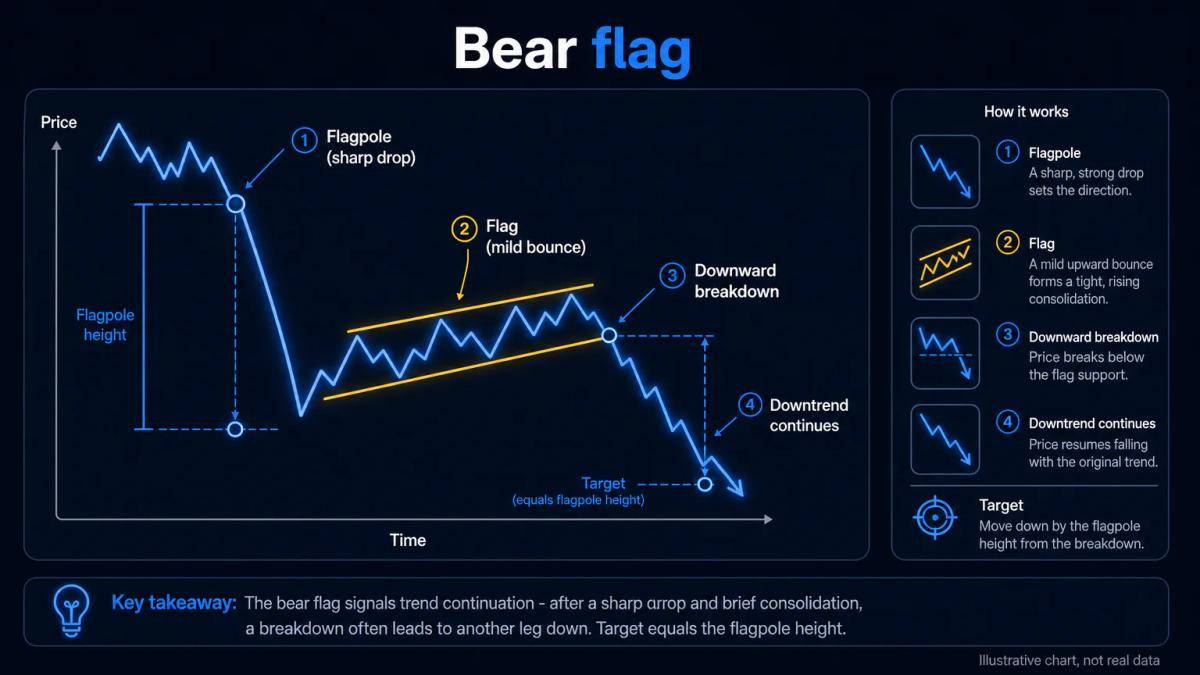
A bear flag inverts everything.
- The flagpole is a sharp drop with wide-range red candles and expanding volume.
- The flag is a mild upward drift, where price grinds higher between two converging trendlines as short sellers cover positions and dip buyers step in.
This upward bounce is usually weak: candles are smaller, wicks appear on the upside, and volume fades compared with the flagpole. The consolidation typically lasts fewer bars than the flagpole took to form. A textbook bear flag retraces no more than about a third of the flagpole; if price recovers half of the drop or more, the pattern loses reliability and starts to resemble a reversal attempt.
The breakout that confirms the pattern is a decisive close below the lower trendline of the flag, ideally accompanied by volume that returns to flagpole levels. Until that break happens, a bear flag is only a candidate: the shape alone means nothing without the trigger.
How to Identify Bull Flags and Bear Flags in Real Charts
Start by finding the flagpole, not the flag. Scan for a strong directional move: at least three consecutive bars in one direction with expanding range and rising volume. Only then look for the consolidation. For a bull flag, mark the swing high of the flagpole, then draw two trendlines across the highs and lows of the drift that follows; the flag should be tight, orderly, and biased flat or slightly down. For a bear flag, mark the swing low of the flagpole and draw trendlines across the highs and lows of the upward drift.
Multi-timeframe confirmation improves the odds. If you trade a flag on the 15-minute chart, check the 1-hour and 4-hour charts to confirm the higher timeframe trend agrees with the flagpole direction. A bull flag on the 15-minute chart is more reliable when the 4-hour chart is also making higher highs.
Momentum indicators help: RSI (relative strength index, a 0 to 100 oscillator measuring momentum) holding above 50 during a bull flag consolidation, or below 50 during a bear flag, supports continuation. MACD histograms flattening but not crossing against the trend point to the same conclusion. Ignore flag shapes that appear in choppy, sideways charts where no clear flagpole exists.
Volume Confirmation: Why It Matters for Flag Breakouts
Volume is the single most useful filter for separating real flags from lookalikes. During the consolidation, volume should contract steadily: fewer participants, smaller bars, less conviction on both sides. On the breakout bar, volume should expand sharply, ideally at least 1.5 to 2 times the average volume of the flag phase. That expansion tells you the pause is over and directional traders have returned. Breakouts on flat or declining volume are the ones that fail most often; price pokes above the upper trendline of a bull flag, fails to attract follow-through buyers, and rolls back into the range.
The same trap works in reverse for bear flags. If your chart platform does not display volume (a common gap in spot forex feeds, which lack a centralised exchange), use tick volume as a proxy or wait for a decisive candle close beyond the trendline rather than an intrabar spike. Volume does not predict the breakout; it validates it after the fact.
Entry, Stop Loss, and Profit Target Rules
A disciplined flag trade uses three fixed reference points. For a bull flag, the entry is a close above the upper trendline of the flag on expanding volume. The stop loss sits just below the lower trendline of the flag or the most recent swing low inside the consolidation, whichever is closer.
The profit target uses the measured move: take the vertical height of the flagpole in points or pips (the smallest standard price increment for the instrument), and add that distance to the breakout price. For a bear flag, mirror the rules: entry on a close below the lower trendline, stop above the upper trendline or recent swing high, target equal to the flagpole height projected downward from the breakout.
| Rule | Bull Flag | Bear Flag |
|---|---|---|
| Entry | Close above upper trendline on volume expansion | Close below lower trendline on volume expansion |
| Stop loss | Below flag's lower trendline or swing low | Above flag's upper trendline or swing high |
| Profit target | Breakout price plus flagpole height | Breakout price minus flagpole height |
| Minimum reward-to-risk | 2:1 preferred | 2:1 preferred |
Position size so that the distance between entry and stop equals no more than 1% of account equity. Skip the trade if the resulting reward-to-risk falls below 2:1.
Common Mistakes and Flag Pattern Failures
The most frequent error is entering before the breakout confirms. A tight consolidation inside a flag tempts traders to anticipate the break, but anticipatory entries have no edge: half the time the breakout goes the other way. Wait for a candle close beyond the trendline.
The second common mistake is ignoring failed flags. When price breaks out, fails to attract volume, and re-enters the flag within a few bars, that failed breakout often triggers a sharp move in the opposite direction as trapped traders exit. Set an alert to exit if price closes back inside the flag after a triggered entry.
The third mistake is trading flags in the wrong market regime. Flags work best in trending conditions with clear flagpoles. In ranging, low-volatility environments, every small pullback looks like a potential flag but lacks the momentum to resume. Check ADX (average directional index, a trend-strength gauge) readings above 25 before trusting a flag setup. Finally, avoid stacking flags on news events: an unrelated economic release can wipe out a valid technical pattern within a single bar.
Frequently Asked Questions
What is the difference between a bull flag and a bear flag pattern?
A bull flag appears after a strong upward move and predicts more upside once price breaks above the consolidation. A bear flag appears after a strong downward move and predicts more downside on a break below. The shapes are near mirror images; the difference is the direction of the preceding flagpole and the expected breakout.
How do you confirm a flag pattern breakout with volume?
Look for volume to contract during the flag consolidation, then expand sharply on the breakout candle. A common benchmark is volume at least 1.5 to 2 times the average of the flag phase. Breakouts on flat or declining volume tend to fail. Where spot forex lacks true volume, use tick volume or require a clear candle close beyond the trendline.
What is the profit target formula for trading flag patterns?
Measure the vertical height of the flagpole in points or pips. For a bull flag, add that distance to the breakout price. For a bear flag, subtract it from the breakout price. This measured-move method assumes the resumed trend covers a similar distance to the initial flagpole. Combine it with a stop beyond the opposite trendline to keep reward-to-risk at 2:1 or better.
Can flag patterns fail, and how do you spot a failed flag early?
Yes. A failed flag typically shows a breakout candle without volume expansion, followed by price re-entering the flag range within a few bars. Exit the trade if price closes back inside the flag after your entry. Failed bull flags often trigger sharp downside moves as trapped buyers exit; failed bear flags do the opposite.
Should you trade flag patterns on all timeframes, or are some better than others?
Flags appear on every timeframe but work best when the flagpole is clean and the higher timeframe trend agrees. Intraday traders often use 5-minute to 1-hour charts and confirm on the 4-hour. Swing traders work daily flags confirmed on the weekly. Avoid very low timeframes such as 1-minute charts, where noise makes flagpoles unreliable.
About the authors


Put this into practice
Brokers we have reviewed
Scored on the same five dimensions. Here are three of them — the full list is on the brokers page.



Related articles

Bullish Candlestick Patterns: A Trader's Reference to Reversal Signals
The hammer, bullish engulfing, morning star and piercing line explained: how they form, how to trade them, and how to filter out false signals.

Buy Side and Sell Side Liquidity: How to Read and Trade It
A beginner-friendly guide to buy side and sell side liquidity: where the pools sit, how to spot sweeps, and how to size trades around them.

Chaikin Volatility Indicator: How to Read Expansion and Contraction Signals
A plain-English guide to the Chaikin Volatility Indicator: how it is built, what expansion and contraction mean, and how to combine it with ATR, RSI and volume.
0 comments