



Technical Analysis · Beginner · 14 min read
Bullish Candlestick Patterns: A Trader's Reference to Reversal Signals
What bullish candlestick patterns signal and why they matter
Bullish candlestick patterns are candle formations that signal buying pressure is overtaking selling pressure, often at the end of a downtrend or at a support level. Each candle records real order flow: a long lower wick shows that sellers pushed price down but buyers reclaimed it; an engulfing body shows the prior session's sellers were overwhelmed on close. For you as a retail trader, that behaviour is a low-latency entry cue.
A candle is a compressed record of every trade in a fixed window: the open, the high, the low and the close. When the close sits near the high after a deep intraday drop, market makers and larger participants have absorbed the sell orders and lifted the offer. You spot this on a chart and you are, in effect, reading a summary of the auction that just happened.
Context decides whether the pattern is worth trading. The same hammer prints thousands of times a day across every market, and most instances are noise. What separates a tradable pattern from a false signal is location: near a prior swing low, at a round number, on a moving average, or at the end of a measured downmove. Without that context, the shape is just a shape.
Choosing where to trade matters as much as the strategy; see the best forex brokers and their conditions.
The hammer: anatomy and how to trade it
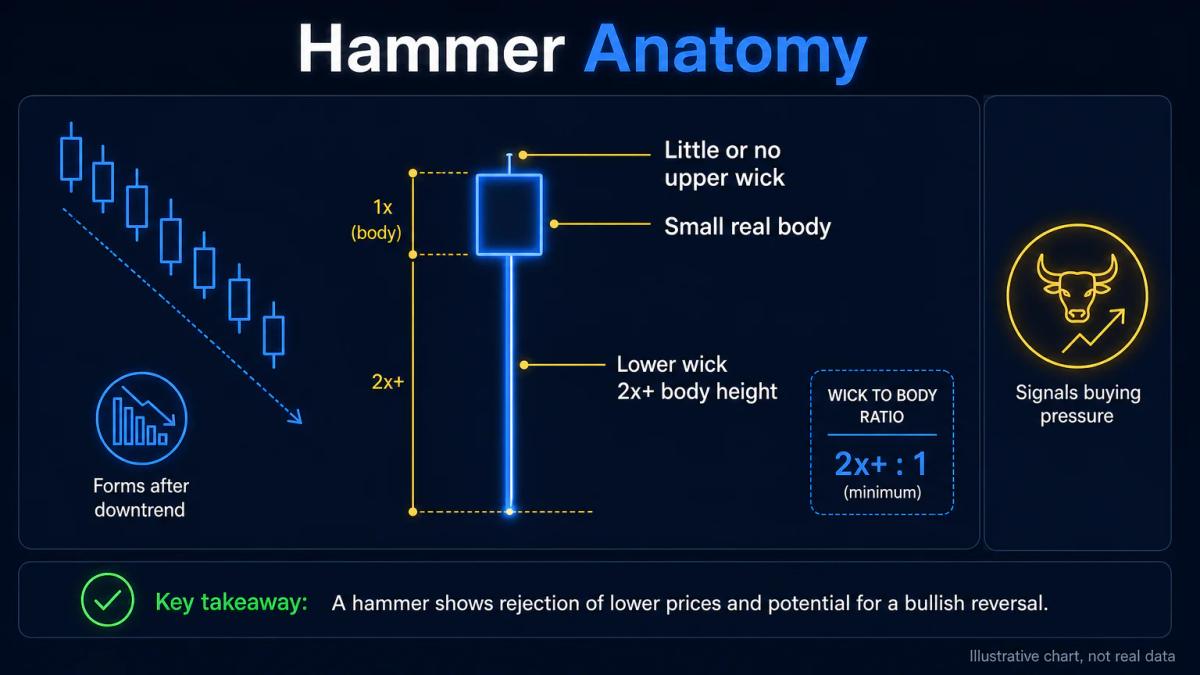
A hammer is a single candle with a small real body, a lower wick at least twice the body's height, and little or no upper wick, forming after a downtrend or at support. The real body is the distance between the open and the close; the wicks are the extremes reached during the session. The colour of the body matters less than the wick: a green hammer is marginally stronger, but a red hammer at a clean support level is still a valid signal.
The order flow behind a hammer is straightforward. Sellers dominate the first part of the session and drive price to a new low. Buyers step in, absorb the supply, and lift price back toward the open before the candle closes. The long lower wick is the visible footprint of that absorption. The tighter the body and the longer the wick, the more decisive the rejection.
To trade a hammer, wait for the next candle to confirm the reversal.
- If it closes above the hammer's high on volume above the recent average, enter long.
- Place your stop loss, the price at which you exit the trade to cap the loss, a few pips below the hammer's low.
A pip is the smallest standard price increment for a forex pair, typically 0.0001 for majors like EUR/USD. Target a reward-to-risk ratio of at least 2:1: if your stop is 20 pips away, aim for a 40-pip move before considering an exit.
Hammers on daily and 4-hour charts filter most of the noise. On a 1-minute chart, the same shape appears constantly and rarely leads to a sustained move, because intraday participants have not yet decided the trend. Pair the hammer with a support level, a 50-period or 200-period exponential moving average, or a Fibonacci retracement to raise the odds.
Bullish engulfing: the two-candle reversal
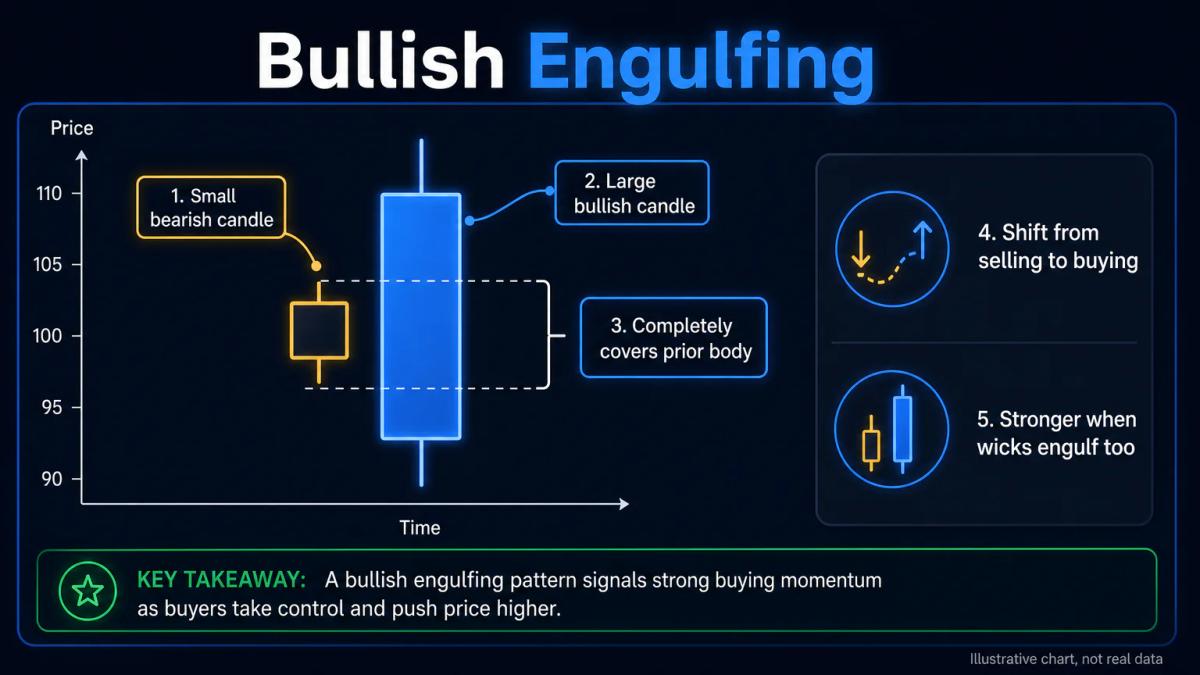
A bullish engulfing forms when a small bearish candle is followed by a larger bullish candle whose real body completely covers the prior body, signalling a shift from selling to buying control. The second candle's open must be at or below the first candle's close, and its close must be at or above the first candle's open. The engulfing is stronger when the second candle also engulfs the wicks, though only the bodies are strictly required by the classical definition.
The pattern is a compressed narrative of failed continuation. Session one, sellers hold the close near the low, confirming their control. Session two, price gaps down or opens weak, sellers press once more, and buyers overpower them so completely that the close lands above the prior session's open. That reversal in a single candle typically reflects a change of participant: shorts covering, or a larger buyer stepping into a level.
Entry rules are mechanical.
- Buy on the close of the engulfing candle if it prints on volume higher than the prior candle, or wait for a break above its high on the next session.
- Place the stop loss below the first candle's low, or below the engulfing candle's low if that is nearer.
- Target the next resistance level or a 2:1 reward-to-risk multiple, whichever comes first.
On the daily and 4-hour timeframes for major forex pairs and large-cap equities, the pattern behaves consistently; on 5-minute charts it fails more often than it works, because a single news headline can print the same shape without any lasting shift in flow.
Morning star and three-candle reversal patterns
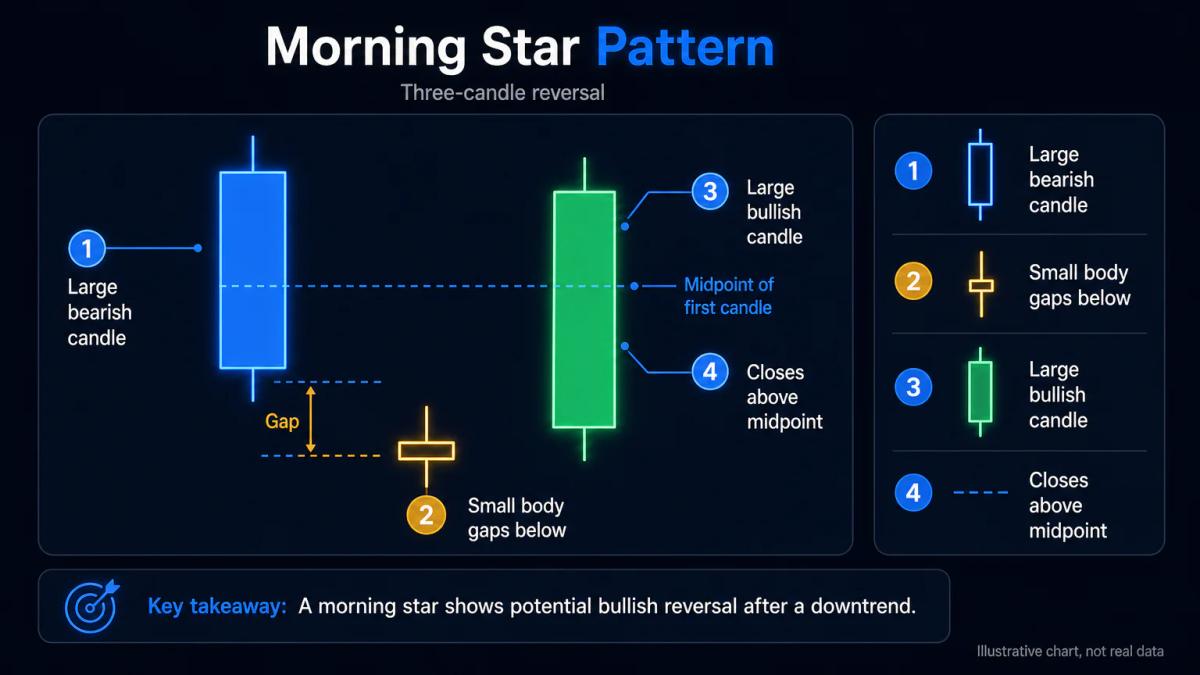
A morning star is a three-candle reversal pattern: a large bearish candle, a small-bodied candle (often a doji or spinning top) that gaps below it, and a large bullish candle that closes above the midpoint of the first candle. A doji is a candle with an open and close so close together that the body is a thin line; a spinning top has a slightly larger body with wicks on both sides. Together, the three candles tell a story of trend, indecision and reversal.
The middle candle is the mechanical heart of the pattern. It signals that the prior selling has exhausted itself: the range narrows, participants pause, and neither side commits new capital. When the third candle opens and closes decisively above the midpoint of the first, it confirms that buyers have taken the initiative from a position of equilibrium, not from a still-active downtrend.
- Enter on the close of the third candle if it prints on volume above the recent average, or on a break above its high on the next session.
- Place the stop loss below the low of the entire three-candle formation. That wider stop reflects the pattern's structure: a valid morning star should not see price revisit the middle candle's low.
- Target a 2:1 or 3:1 reward-to-risk ratio, and consider scaling out at the first resistance level.
The pattern is most reliable on daily and weekly charts, where the gaps between candles are meaningful; on intraday timeframes, gaps rarely form in 24-hour markets like forex and crypto, weakening the pattern's diagnostic value.
Piercing line and other two-candle bullish patterns
A piercing line is a two-candle pattern where a bearish candle is followed by a bullish candle that opens below the prior close but closes above the midpoint of the bearish candle. It is a milder cousin of the bullish engulfing: buyers do not reclaim the entire prior range, only more than half of it. That partial recovery is still a meaningful shift, especially at a support level.
The piercing line, the bullish harami, and the on-neck line share the same two-candle structure but signal different degrees of conviction. The comparison below summarises the classical rules.
| Pattern | Second candle open | Second candle close | Signal strength |
|---|---|---|---|
| Piercing line | Below prior low | Above prior midpoint | Moderate reversal |
| Bullish engulfing | Below prior close | Above prior open | Strong reversal |
| Bullish harami | Above prior close | Below prior open (inside prior body) | Weak, indecision |
| On-neck line | Below prior low | Near prior low | Continuation, not reversal |
Entry for a piercing line: buy on the close of the second candle or on a break above its high, with a stop loss below the bearish candle's low. Because the pattern is less decisive than a bullish engulfing, require volume confirmation and a nearby support level before committing capital.
Confirmation signals: volume, support levels, and indicators
A bullish pattern alone is not enough; confirmation is what separates a tradable setup from noise. Volume is the first filter: the bullish candle should close on volume higher than the average of the prior 5 to 10 candles. Volume is the number of contracts, shares or units traded during the candle's window, and in forex it is proxied by tick volume, the count of price changes. A pattern that prints on thin volume tells you the move lacked participation, and thin moves reverse easily.
Support levels raise the odds sharply. A hammer that forms at a prior swing low, at a round number like 1.1000 on EUR/USD, or at a 50-period or 200-period exponential moving average is trading at a level where other participants also expect to buy. That shared expectation is self-reinforcing: orders cluster there, and the pattern becomes a visible marker of an already-active zone of demand.
Indicator confirmation is optional but useful for beginners. The Relative Strength Index (RSI) is an oscillator that measures the speed of recent price changes on a 0 to 100 scale, and an RSI reading rising back above 30 or 50 from oversold territory supports a bullish reversal. The Moving Average Convergence Divergence (MACD) tracks the difference between two exponential moving averages, and a histogram turning from negative to positive on the pattern candle is another supporting cue. Do not wait for every indicator to align: two out of three signals is enough. Waiting for perfect confluence usually means missing the trade or entering too late.
Set position size, the number of units you buy, so that the distance from entry to stop loss represents no more than 1 to 2 percent of your account. According to the FCA, 74 to 89 percent of retail CFD accounts lose money, and oversized positions on unconfirmed patterns are one of the mechanisms behind that figure. A modest position on a well-confirmed pattern survives false signals; a large position on a weak pattern does not.
Common false signals and how to filter them
Bullish patterns fail most often when they print inside a strong downtrend without a support level nearby, when volume is thin, or when the market is choppy and any single candle is meaningless. A hammer that appears in the middle of a clean downtrend, with open space beneath it, usually leads to a lower low within one to two candles. The wick shows a brief intraday bounce, not a shift in control.
Three filters catch most bad setups.
- First, location: is the pattern at a support level, a moving average, or the end of a measured 3 to 5 day downmove, or is it in the middle of an uninterrupted 10-day sell-off?
- Second, volume: is the pattern candle's volume above the recent average, or is it a low-volume drift that any small order could have created?
- Third, context: is the broader market in a risk-on mood, or is there a headline risk, a central bank meeting or a payrolls release, that could invalidate any pattern within minutes?
A short case study makes the failure mode concrete. Suppose EUR/USD is falling on a hawkish Fed narrative. A hammer prints on the 4-hour chart, but the pair is 200 pips below the last support level, volume is average, and the next FOMC minutes are 12 hours away. You buy the hammer without waiting for the next candle to close above its high and you are entering into a downtrend, in open space, before a known event. The stop below the hammer's low is often hit within the same session. The exit rule is simple: if the candle following a bullish pattern closes below the pattern's midpoint, close the trade at market, regardless of whether the stop has been touched.
On shorter timeframes, false signals are more frequent, so tighten the position size rather than the stop. A 15-minute hammer is worth trading only with a small position and a clearly defined support level in view. A daily hammer at a well-tested level is a different order of signal, and developing that judgment is part of becoming a skilled trader.
Timeframe and market differences: forex, crypto, equities, and commodities
Bullish patterns behave differently across asset classes because liquidity, volatility and participant mix differ. The general rule holds everywhere: longer timeframes filter noise and shorter timeframes amplify it. Beyond that, each market has its own quirks that shape which patterns to trust and which to discount.
| Market | Most reliable timeframe | Best-performing patterns | Volatility profile | Watch-outs |
|---|---|---|---|---|
| Forex majors (EUR/USD, GBP/USD) | 4-hour, daily | Bullish engulfing, hammer | Moderate, session-driven | 1-minute patterns are noise; news releases override structure |
| Equities (large-cap) | Daily, weekly | Morning star, hammer | Moderate, with earnings jumps | Low-volume stocks generate false signals; gaps between sessions matter |
| Crypto (BTC, ETH) | 4-hour, daily | Bullish engulfing, hammer | High, 24/7 with no closes | Volume spikes often from retail panic, not institutional flow; 15-minute patterns fail often |
| Commodities (gold, oil) | Daily, weekly | Hammer, piercing line | Moderate, tied to macro cycles | Round-number levels dominate; contango and roll dates distort patterns on futures |
As of 2024, crypto CFDs are prohibited for UK retail clients under FCA rules, so a UK-based reader trading crypto candlestick patterns will typically do so on a spot exchange rather than through a broker.
Leverage caps also constrain how these patterns translate into position size: for UK retail clients, the FCA limits leverage to 30:1 on major forex, 20:1 on major indices, 5:1 on individual equities. Those caps matter because a pattern's stop distance drives position size, and available leverage sets the ceiling on capital efficiency.
A practical rule: use a longer timeframe to confirm the pattern you found on a shorter one. A hammer on a 1-hour chart is a signal to watch; if the daily chart also shows price at support, it is a signal to trade. This multi-timeframe check catches most of the false intraday shapes without adding indicators.
Automating pattern recognition without false positives
Manual scanning does not scale beyond three or four instruments, so most active traders automate detection. MT4 and MT5 have community-built pattern indicators; cTrader supports custom cBots in C#; TradingView offers Pine Script screeners that scan hundreds of tickers in seconds. The trap is that a naive scanner flags every shape that matches the geometric definition, including thousands of patterns with no context.
A useful scanner adds three filters in code: volume above a moving average of the last 10 candles, distance from a moving average, the pattern must form within a defined range of a 50 or 200 EMA, and trend context, the pattern must appear after a measured downmove, not mid-trend. With those filters, the alert count drops from hundreds per day to five or ten, and the hit rate rises. Backtesting the filters on 12 to 24 months of historical data on your chosen instrument shows whether the ruleset has an edge on that specific market before any capital is at risk.
Alerts should trigger on the close of the pattern candle, not on the wick touch, to avoid entering on shapes that then fill in as something else entirely. A hammer is only a hammer when the candle closes; before that, it can still turn into a doji or a bearish pin bar. For those ready to move beyond manual scanning, learning how to build a trading bot covers the setup, security and cost reality of automated systems.
Frequently Asked Questions
What is the most reliable bullish candlestick pattern for beginners?
The bullish engulfing is the most beginner-friendly because its rules are unambiguous: the second candle's body must fully cover the first candle's body, closing above the prior open. There is little room for interpretation, unlike the hammer, where wick-to-body ratios can be judged loosely. Trade it on 4-hour or daily charts at a support level, with a stop loss below the first candle's low.
How do I know if a bullish candlestick pattern will actually reverse the trend?
You do not know in advance, and no pattern is a guarantee. What raises the odds is context: the pattern forms at a support level, on volume above the recent average, at the end of a measured 3 to 5 day downmove, and the next candle closes above the pattern's high. If any of those conditions is missing, treat the pattern as a watch signal, not a trade signal.
Can bullish candlestick patterns work on 1-minute or 5-minute charts?
They can, but the false-signal rate is much higher because intraday noise creates candle shapes without any underlying shift in order flow. If you trade very short timeframes, tighten position sizing to 0.5 to 1 percent risk per trade, require volume confirmation, and cross-check the pattern against a higher timeframe (15-minute or 1-hour) before entering.
Should I use stop losses below the entire pattern or just the last candle?
Below the entire pattern's low for multi-candle formations like the morning star and piercing line, and below the pattern candle's low for single-candle formations like the hammer. Placing the stop below the whole pattern respects the structure: if price revisits that low, the reversal thesis is broken and the trade is invalid.
How do I combine bullish candlestick patterns with moving averages or RSI?
Use the 50-period or 200-period exponential moving average as a location filter: only trade patterns that form within a defined distance of one of these averages. Use RSI as a confirmation filter: an RSI reading rising back above 30 or 50 from oversold territory supports the reversal. Two confirmations (pattern plus moving average, or pattern plus RSI) are usually enough; waiting for all three often means entering too late.
About the authors


Put this into practice
Related articles

Buy Side and Sell Side Liquidity: How to Read and Trade It
A beginner-friendly guide to buy side and sell side liquidity: where the pools sit, how to spot sweeps, and how to size trades around them.

Chaikin Volatility Indicator: How to Read Expansion and Contraction Signals
A plain-English guide to the Chaikin Volatility Indicator: how it is built, what expansion and contraction mean, and how to combine it with ATR, RSI and volume.

Consolidation in Trading: What It Is and How to Trade It
A plain-English guide to consolidation in trading: why price goes sideways, which patterns are worth knowing, and how to trade the eventual breakout without getting whipsawed.
0 comments