



Technical Analysis · Beginner · 11 min read
RSI Buy and Sell Signals: How to Read Them Correctly
How RSI signals work in real trading
An RSI signal is not the number itself, but what the Relative Strength Index does relative to price and its own momentum.
The Relative Strength Index (RSI, a momentum oscillator that measures the speed of recent price changes on a 0 to 100 scale) generates actionable signals through three mechanisms: crossovers of key levels, divergence from price, and failure swings inside overbought or oversold zones.
If you need a refresher on how the oscillator is calculated and what its default settings mean, see the Monkeytrade RSI indicator explainer. This piece assumes you already know that ground and focuses on how to convert those readings into entries and exits.
Treat RSI as a second opinion on price. Price tells you what happened; RSI tells you how forcefully it happened. When the two agree, you have confirmation. When they disagree, you have divergence, which is often the earliest warning of a turn.
A signal you can trade is one where RSI behaviour, price structure and the market regime (trending or ranging) all point the same way. Everything that follows is about spotting that alignment and filtering out the readings that look tempting but rarely pay. This principle of seeking alignment across multiple indicators mirrors the logic behind moving average crossover strategies, where confirmation across tools strengthens your conviction.
Putting this into practice means opening an account: start with the best forex brokers our team reviewed.
Crossover signals: the 50 level and trend confirmation
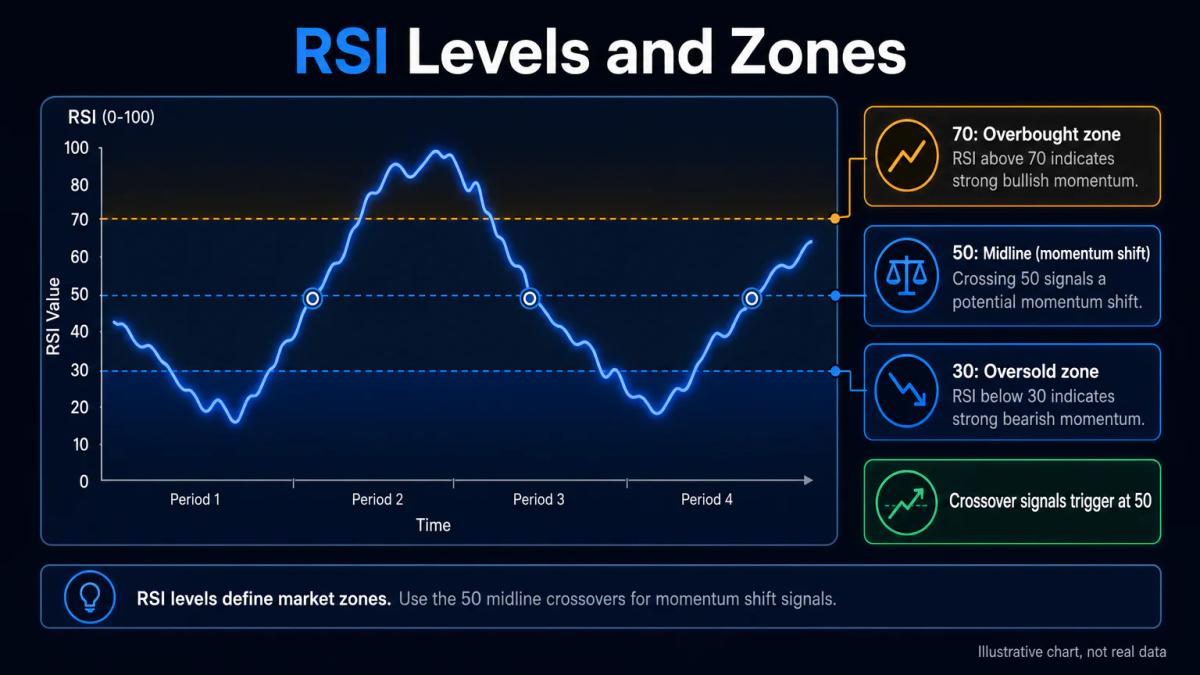
The 50 line is the most underused level on the RSI panel.
When the indicator crosses above 50, average gains over the lookback period are outpacing average losses: momentum has shifted to the buy side. A cross below 50 means the opposite.
This midpoint crossover is a gentler, earlier signal than waiting for the 70 or 30 extremes, and it works particularly well on the 1-hour and 4-hour charts for confirming a trend that price action has already hinted at.
Use the 50 cross as a filter, not a standalone entry. If you are looking to buy a pullback in an uptrend, wait for RSI to dip toward 40 to 45 and then reclaim 50 as price breaks the pullback high. That combination filters out the false crosses you get when RSI oscillates around 50 in a choppy range.
| RSI level cross | What it signals | Best used for |
|---|---|---|
| Above 50 | Momentum turning bullish | Confirming long entries in uptrends |
| Below 50 | Momentum turning bearish | Confirming short entries in downtrends |
| Above 70 | Strong bullish momentum | Trend continuation, not reversal, in trending markets |
| Below 30 | Strong bearish momentum | Trend continuation, not reversal, in trending markets |
Divergence: when RSI and price disagree
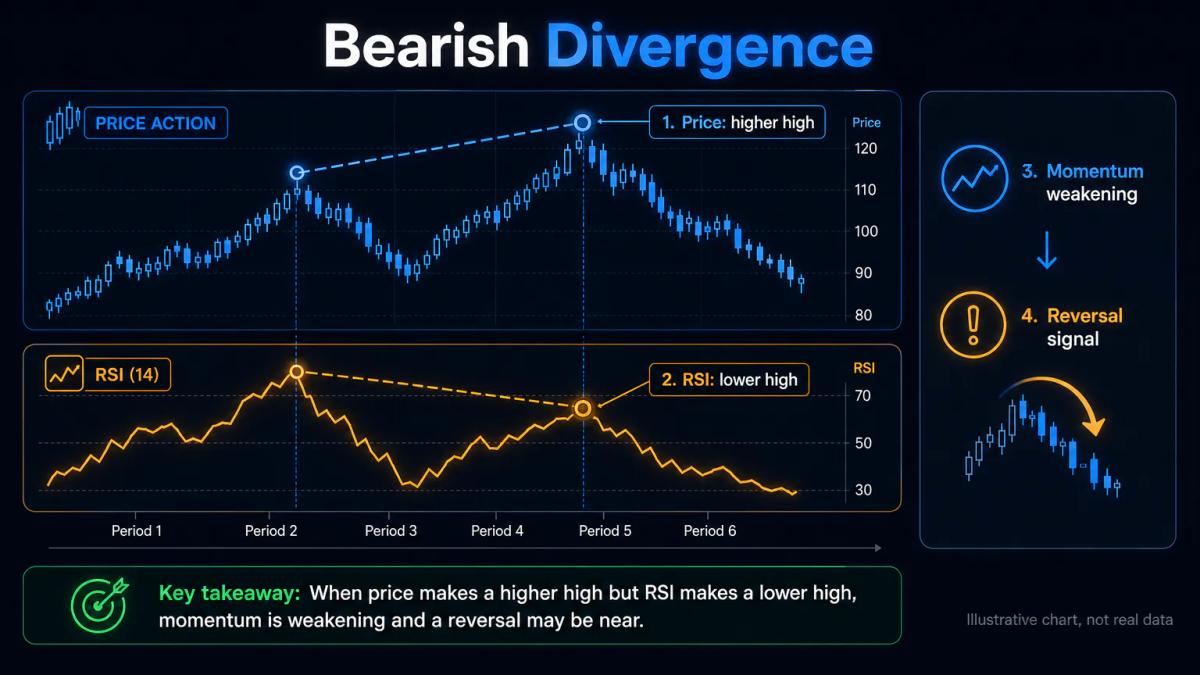
Divergence occurs when price makes a new high or low but RSI fails to confirm it, signalling that the move is running on fumes.
- Bullish divergence appears when price prints a lower low while RSI prints a higher low: sellers pushed price down further, but with less force.
- Bearish divergence is the mirror image, with price making a higher high while RSI makes a lower high. This mismatch is one of the most respected RSI signals because it reveals fading momentum before price reverses.
Not every divergence is tradeable. To filter the useful ones from the noise, look for three conditions.
- First, the divergence should form at a level that already matters on the chart: a prior swing high, a round number, a moving average, or a support/resistance zone.
- Second, the RSI peaks or troughs involved should be clearly separated, not two bars apart.
- Third, wait for a confirmation candle: a bearish engulfing at bearish divergence, or a bullish reversal bar at bullish divergence.
Divergence tells you the current move is weakening. Many divergences resolve as a pause or a shallow pullback rather than a top or a bottom. Size the trade for that reality: take partial profit at the first structural level and let a small runner test the deeper reversal thesis.
Treating divergence as a warning rather than a prophecy is what separates traders who use it well from those who overtrade it.
RSI in ranging versus trending markets
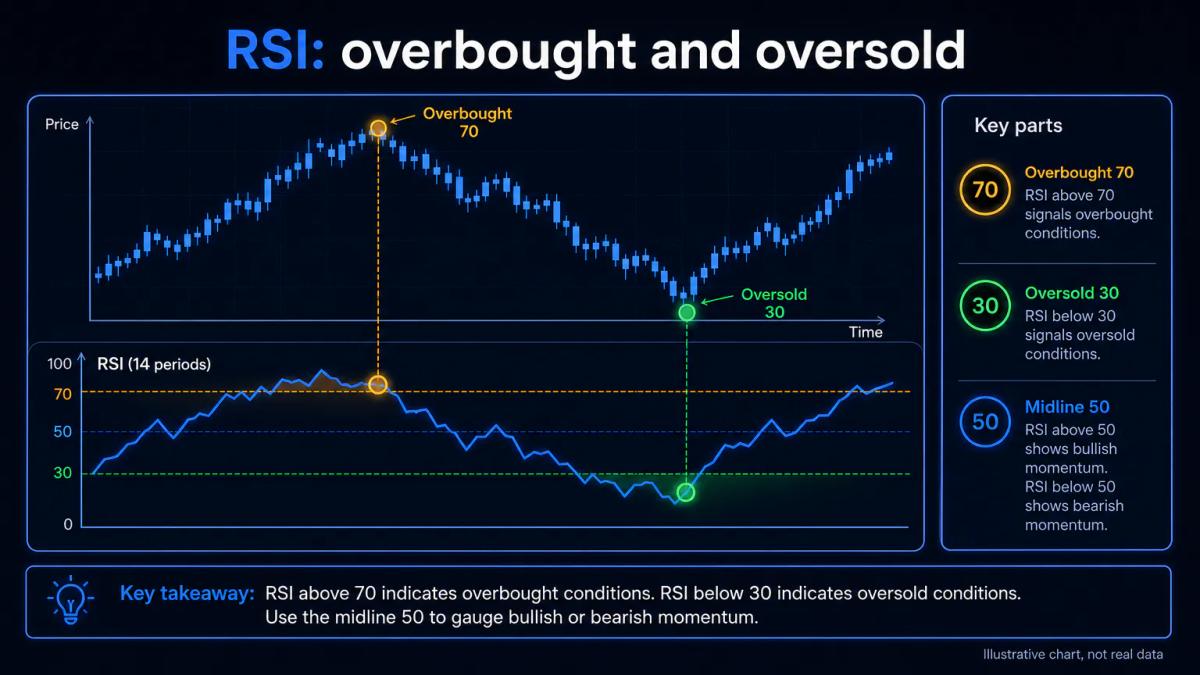
RSI signals behave differently depending on market structure, and misreading the regime is the single biggest source of losing RSI trades.
In a range, the 70 and 30 extremes are reliable reversal zones: price bounces off support, RSI dips under 30 and turns up, and the mean-reversion trade works. In a strong trend, the same reading is a trap. RSI can sit above 70 for days during an uptrend, and shorting every overbought print is a fast way to give money to the trend.
Before acting on any RSI signal, classify the regime. Look at a 50 or 200-period simple moving average (SMA, the arithmetic average of closing prices over the chosen window).
- If price is above a rising 200 SMA on your entry timeframe, treat it as an uptrend and use RSI dips toward 40 to 50 as buy setups, not RSI at 70 as sell setups.
- If price is oscillating around a flat 50 SMA with clear horizontal support and resistance, treat it as a range and use the 30 and 70 extremes.
Understanding how to read market structure is fundamental to applying RSI correctly; the same principle applies when you learn how stock indices behave in different market regimes.
| Regime | RSI zone to trade | Signal type | Zones to ignore |
|---|---|---|---|
| Uptrend | 40 to 50 pullback | Buy on reclaim of 50 | Sell signals at 70+ |
| Downtrend | 50 to 60 pullback | Sell on rejection of 50 | Buy signals at 30- |
| Range | Below 30, above 70 | Mean reversion | 50 crossovers |
Combining RSI signals with price action and support/resistance
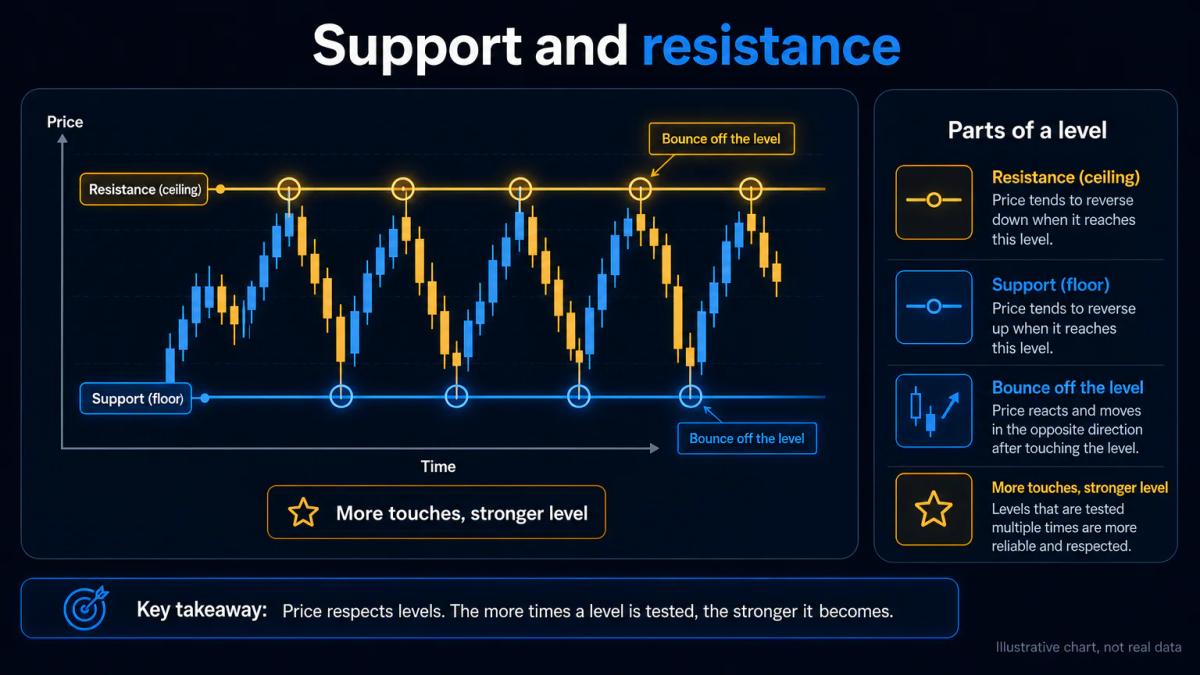
RSI signals are strongest when they align with price structure.
- A buy signal at 30 carries far more weight if it prints at a prior support level or a rising trendline than if it prints in empty space in the middle of a candle wick.
- A sell signal at 70 at a well-defined resistance zone is a trade; the same signal in the middle of a breakout move is often a losing short against a running trend.
Build your setup in layers.
- Start with the higher timeframe context: is the daily or 4-hour chart in a trend, a range, or a transition.
- Then mark the levels that matter: horizontal support and resistance from recent swings, round numbers, session highs and lows, and any trendline that has been touched at least three times.
- Only then do you look at RSI. The oscillator is the trigger; the level is the reason.
Learning to identify these structural levels is a core skill covered in stock trading basics, which teaches the same price action principles that apply across all markets.
Concrete worked example on EUR/USD in an uptrend on the 1-hour chart: price pulls back to a prior swing high that now acts as support, RSI dips to 42, then crosses back above 50 as a bullish engulfing candle closes. Stop goes below the swing low that formed the pullback; first target is the previous swing high; second target is measured by the height of the prior leg projected from the entry. Without the support level, the RSI move alone is not enough. With the level, the RSI cross is the timing tool that gets you in with a defined risk.
This layered approach also protects you against overbought and oversold traps in strong moves. If RSI is at 78 but price is breaking out of a multi-week range on above-average volume, the level tells you to stand aside. The oscillator is a filter for price.
Common RSI trading mistakes and how to avoid them
The most costly RSI mistakes cluster around three habits: shorting overbought readings in strong uptrends, ignoring divergence when it does not fit the current bias, and using the same RSI settings across timeframes and asset classes without testing. A trader who shorts every 70 print on Nasdaq during a bull leg will lose money consistently, even though the signal looks textbook.
A second frequent mistake is signal stacking without logic. Adding RSI to a chart that already has Stochastic (a similar momentum oscillator that compares closing price to a recent range) and MACD (a trend-following momentum indicator built from two moving averages) does not improve accuracy: it produces correlated readings that all fire together and all fail together.
If you use RSI, use it as the momentum layer and pick a non-correlated tool for the other layers: price structure for context, and volume or average true range for conviction.
A third mistake is skipping the journal step. Traders who log every RSI signal they take, with a screenshot, the regime classification, the level involved and the outcome, discover within a few dozen trades which specific setups pay them and which do not. Without that record, every losing trade feels like bad luck and every winner feels like skill, and the setup mix never improves. Keep it simple: date, pair, timeframe, RSI reading, level, outcome in R (multiples of your initial risk). Review the log monthly and cut the setups that show negative expectancy.
Risk management when trading RSI signals
An RSI signal is a trigger. Position sizing and stop placement decide whether a strategy survives its inevitable losing streaks.
Place your stop beyond the structural level that generated the signal: for a buy at support, that means below the swing low, not below a fixed number of pips. This anchors your risk to the market, not to a chart preference.
Size each trade so that a stop hit costs no more than 1 to 2 percent of account equity. The formula is straightforward:
Position size = (account equity x risk percent) / (entry price minus stop price)
On a £10,000 account risking 1 percent, with an entry at 1.0850 on EUR/USD and a stop at 1.0820 (30 pips of risk), a mini lot values each pip at roughly £1, so risking £100 allows about 3.3 mini lots. If the stop needs to sit 60 pips away instead, the position halves. The stop dictates the size; the signal never does.
According to the FCA, a majority of retail CFD accounts lose money, which is why every RSI setup should be evaluated on expectancy across many trades, not the outcome of the next one. Under FCA rules for UK retail clients, leverage is capped at 30:1 on major forex pairs, 20:1 on major indices and 5:1 on individual equities, and CFDs on cryptoassets are prohibited for retail. Those caps are the ceiling; your own position sizing should sit well below them.
Adjusting RSI settings for different timeframes and assets
The default 14-period RSI is a compromise setting that works across many markets but is optimal for none.
- Shorter periods (7 to 9) generate faster signals suited to scalping (very short-term trading, typically minutes-long holds) on 5-minute and 15-minute charts.
- Longer periods (21 to 25) smooth the line and are better for swing trading on the 4-hour and daily.
Asset class matters as much as timeframe. Major forex pairs move less violently than crypto, so a 14-period RSI on EUR/USD prints far fewer 70 and 30 extremes than the same setting on BTC/USD.
Understanding how crypto trading differs from forex helps you calibrate your RSI settings appropriately. Test any setting on at least 200 signals of historical data before risking real capital, and log the win rate, average R multiple and worst drawdown before you commit.
FCA: A majority of retail investor accounts lose money when trading CFDs, and UK retail leverage on major forex pairs is capped at 30:1 with CFDs on crypto restricted for retail.
Frequently Asked Questions
What is the difference between an RSI signal and an overbought/oversold reading?
An overbought or oversold reading is a state (RSI above 70 or below 30). A signal is a specific event: a crossover of 50, a divergence between RSI and price, or a failure swing where RSI leaves an extreme zone and turns back. The reading tells you where momentum is; the signal tells you it is changing.
Can you trade RSI signals profitably without combining them with other indicators?
Yes, but only when you combine RSI with price action and structural levels rather than other oscillators. Stacking RSI with Stochastic or MACD produces correlated signals that fire together. Pairing RSI with support, resistance and trend context gives you independent confirmations and a defined stop location, which is what a profitable system needs.
How do you know if an RSI divergence is a real reversal signal or a false alarm?
Filter divergences with three checks: the divergence forms at a level that already matters on the chart, the two RSI peaks or troughs involved are clearly separated by several bars, and a confirmation candle prints in the reversal direction. Divergences that meet all three criteria are worth trading; the rest usually resolve as pauses, not reversals.
What RSI period setting should you use for day trading versus swing trading?
Day traders on 5-minute to 1-hour charts often use a 7 to 9 period RSI for faster signals. Swing traders on 4-hour and daily charts get cleaner readings from a 21 to 25 period RSI. The default 14-period setting is a middle ground. Test any setting on at least 200 historical signals before committing capital.
Why do RSI signals fail in trending markets and how do you adapt?
In a strong trend, RSI can sit above 70 or below 30 for days without price reversing, so trading the extremes fights the trend. Adapt by shifting the signal: in an uptrend, buy pullbacks where RSI dips to 40 to 50 and reclaims 50, and ignore overbought readings. In a downtrend, sell rallies where RSI rises to 50 to 60 and rejects.
About the authors


Put this into practice
Related articles

RSI Indicator Explained: How to Read and Trade the Relative Strength Index
A practical, citable guide to the RSI indicator: formula, thresholds, divergences, failure swings, false signals, and how to tune the period for your trading style.

Rising Three Methods Candlestick Pattern: Structure and Trading Setup
A plain-English guide to the rising three methods candlestick pattern: structure, entry rules, stop placement, position sizing and how to filter false signals.

Single Candlestick Patterns: How to Read and Trade Them
A practical guide to the six core single candlestick patterns, how they signal reversals or continuation, and the rules that separate real setups from noise.
0 comments