



Technical Analysis · Beginner · 7 min read
Rising Three Methods Candlestick Pattern: Structure and Trading Setup
The five-candle bullish continuation setup
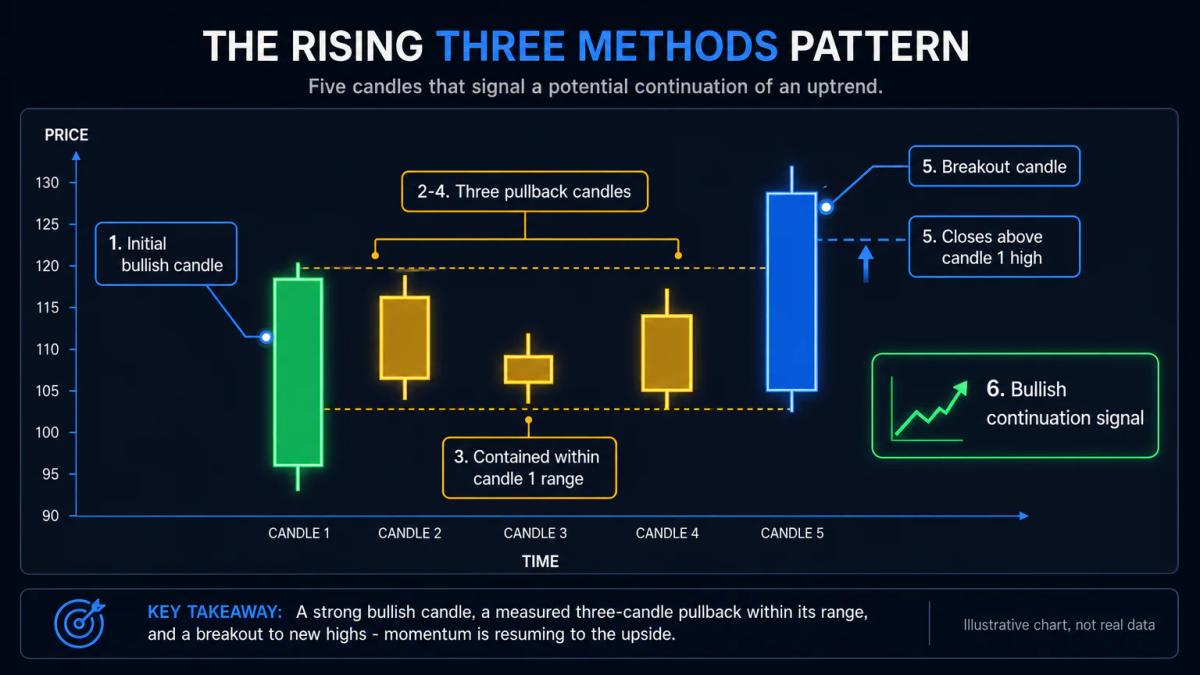
Trend traders often look for a pause that confirms strength rather than warns of reversal, and this five-candle formation captures exactly that moment. It opens with a long bullish candle (a candle that closes well above its open), followed by three smaller bearish candles that remain inside the first candle's range, before closing with a second long bullish candle whose close prints above the high of the first. When it appears inside an existing uptrend, it signals that the move is likely to resume after a shallow pullback.
The pattern belongs to a family of continuation candlestick patterns catalogued in Steve Nison's work on Japanese candlestick charting. Behind the shape sits a simple story of intent: after a strong up-move, buyers pause and sellers try to push price down, yet they cannot force a close below the origin of the rally. When a fresh bullish candle breaks the pause, the uptrend resumes and the sellers who leaned short find themselves trapped. That footprint of one strong candle, three weak counters, and one strong candle is what you are training your eye to see.
Since execution costs and platform quality shape how any strategy performs in practice, it is worth reviewing the best forex brokers and their conditions before committing capital.
How to identify the pattern on your chart
Identifying a rising three methods on your chart begins with context: price should be inside a visible uptrend on the timeframe you trade, because without that trend the same five candles are simply noise. Once the context is established, work through the five candles in order, checking each against the criteria below.
- Candle one: a long bullish body, ideally larger than the recent swing's average, closing well above its open.
- Candles two, three and four: three smaller candles that each close below their open (bearish), sitting inside the vertical range of the first candle so that their highs stay under its high and their lows stay above its low. In classic Nison-style variants, wicks may graze that range as long as the bodies remain contained.
- Candle five: another long bullish candle whose close prints above the high of candle one.
That close above the first candle's high is what validates the pattern. Should the fifth candle instead close inside the range, the setup registers as a squeeze rather than a genuine continuation signal, and the prior uptrend has yet to price in the pullback.
Why trend traders rely on this setup
For trend traders, the appeal of this pattern is that it offers a low-risk re-entry into a move that has already proved itself. Chasing a breakout at the top of a rally exposes you to a sharp mean reversion, whereas waiting for a rising three methods lets you buy after a controlled pullback, with a clearly defined level (the low of the pullback) that says the setup is wrong. Few continuation candlestick patterns offer that degree of structural clarity.
There is also a psychological reading worth considering. Three bearish candles in a row will usually shake weak longs out of the market, and when price still refuses to close below the origin of the previous rally, sellers have failed at their strongest push. The edge the pattern exposes is precisely that failure.
Entry, stop-loss, and profit targets
The cleanest entry is at the close of the fifth candle, once you can confirm it printed above the first candle's high. A more conservative alternative is a limit entry the next session, on any small retest of the breakout level. Both are legitimate; the trade-off is that the close-of-candle entry gets you filled, while the retest entry sometimes misses the move.
The stop loss sits just below the lowest low of the three pullback candles, which serves as the invalidation point: if price trades there, the pattern is broken and the reason for the trade no longer holds. Placing the stop higher would be arbitrary, and placing it much lower would waste risk you do not need to take.
For a first profit target, use the height of the first candle projected upward from the breakout point (a measured move). For a second target, trail the stop below each new higher low, or below a moving average that fits your timeframe.
Imagine, for instance, that the first candle runs from £100.00 to £103.00, the three pullback candles bottom at £101.20, and the fifth candle closes at £103.40. The resulting trade parameters would look like this:
- Entry: £103.40
- Stop: £101.10
- First target: £106.40 (a £3.00 measured move)
- Risk per unit: £2.30
- Reward per unit: £3.00
- Reward-to-risk ratio: roughly 1.3 to 1
Risk management and position sizing
Because the stop level is defined by the pattern itself, position sizing is straightforward. Decide first how much of the account you are willing to lose on the trade: a common band for retail is 0.5% to 2% per trade. Divide that cash risk by the distance from entry to stop to get the size.
Applying the same parameters to a sizing decision, suppose you hold a £10,000 account and risk 1% (£100) on the trade above, where the per-unit risk is £2.30. The position size would be £100 / £2.30, or roughly 43 units. The same arithmetic works for a forex pair, an indices CFD or an equity: cash risk divided by per-unit stop distance. Keeping the percentage constant across trades is what makes a losing streak survivable, and it also stops a wide-stop pattern from silently doubling your exposure.
Timeframe and false signals to watch for
The pattern is most reliable on the 4-hour, daily and weekly charts. On the 1-minute or 5-minute charts, price microstructure regularly prints a shape that resembles a rising three methods but has no continuation behind it, because the underlying trend on those timeframes is often just noise.
A false signal tends to reveal itself through a small set of tells worth learning to recognise:
- The three pullback candles close below the first candle's low, which invalidates the pattern and calls for an exit.
- The fifth candle fails to close above the first candle's high, leaving the setup unconfirmed and the trade off the table.
- The pattern forms after a weak, sideways rally rather than a genuine uptrend, meaning the base condition is missing.
- Volume disagrees with the story: for equities and indices, look for above-average volume on the first and fifth candles and below-average volume on the pullback. Because forex spot lacks centralised volume, tick volume from your platform serves as the practical stand-in.
Rising three methods versus falling three methods
The falling three methods is the mirror pattern for downtrends, in which a long bearish candle is followed by three smaller bullish candles contained inside its range, and a final long bearish candle closes below the first candle's low. The containment rule works the same way, only inverted: three counter-trend candles fail to break the first candle's extreme, and the prevailing move resumes.
| Feature | Rising three methods | Falling three methods |
|---|---|---|
| Trend context | Uptrend | Downtrend |
| First candle | Long bullish | Long bearish |
| Middle three candles | Small bearish, inside range | Small bullish, inside range |
| Fifth candle closes | Above first candle's high | Below first candle's low |
| Signal | Continuation up | Continuation down |
| Stop placement | Below three-candle low | Above three-candle high |
Pattern variations and market context
Real charts rarely produce the textbook shape. Sometimes the pullback is two candles or four candles rather than three; sometimes a pullback candle has a small wick that pierces the first candle's range while the body stays contained. Traders following Nison's original description generally accept wick-touches and body-containment as valid, and reject any pullback candle that closes outside the first candle's range.
Context ultimately decides how much to trust the signal. A rising three methods that appears in a mature, well-defined uptrend, near a rising moving average, on above-average volume, with the fifth candle closing strongly through the first candle's high, is a high-conviction setup. The same shape appearing inside a choppy range, or immediately after a vertical spike that already exhausted buyers, is a low-conviction setup and often the trap that produces the false signals above. Reading context should always come before reading the pattern itself.
For a concrete example of costs and platform, the Fusion Markets review goes through them line by line.
Frequently Asked Questions
What is the rising three methods candlestick pattern?
It is a five-candle bullish continuation pattern. A long bullish candle is followed by three smaller bearish candles whose ranges stay inside the first candle, and then by a second long bullish candle that closes above the first candle's high. It signals that an existing uptrend is likely to resume after a shallow pullback.
How do you trade the rising three methods pattern?
Wait for the fifth candle to close above the first candle's high, then enter at that close or on a retest of the breakout. Place the stop loss just below the lowest low of the three pullback candles, and use the height of the first candle projected upward from the breakout point as a first profit target.
What is the difference between rising three methods and falling three methods?
The rising version signals bullish continuation and appears in uptrends: long bullish candle, three contained bearish candles, long bullish close above the first candle's high. The falling version is the mirror image: long bearish candle, three contained bullish candles, long bearish close below the first candle's low. The logic and the containment rule are identical, only the direction changes.
What timeframe is best for trading the rising three methods?
The 4-hour, daily and weekly charts produce the most reliable rising three methods setups. On 1-minute and 5-minute charts the shape appears often but is dominated by microstructure noise, so continuation is unreliable. Match the pattern's timeframe to the timeframe on which you can identify a genuine trend.
How do you avoid false signals with the rising three methods pattern?
Require a clear pre-existing uptrend, strict containment of the three pullback candles inside the first candle's range, and a firm close of the fifth candle above the first candle's high. On equities and indices, check that volume expands on the first and fifth candles and contracts on the pullback; on forex, use tick volume as a substitute.
About the authors


Put this into practice
Related articles

Single Candlestick Patterns: How to Read and Trade Them
A practical guide to the six core single candlestick patterns, how they signal reversals or continuation, and the rules that separate real setups from noise.

Support and Resistance Trading: How to Identify and Trade Price Levels
A practical guide to support and resistance trading: how to mark levels, filter false breakouts, size positions, and apply the strategy across asset classes.

Technical Analysis Explained: Charts, Patterns, and Trading Tools
A working guide to technical analysis for retail traders: chart types, indicators, limitations, backtesting and risk management framed around real broker execution.
0 comments