



Technical Analysis · Beginner · 11 min read
Single Candlestick Patterns: How to Read and Trade Them
The smallest price story: what a single candlestick reveals
A single candlestick pattern is a one-bar formation that signals a potential trend reversal or continuation based on the relationship between the open, close, high and low prices of that bar. The shape of the body and the length of the wicks tell you whether buyers or sellers finished the period in control.
Every candle records four prices for a fixed period.
- The body is the block between the open and the close
- The wicks, also called shadows, are the thin lines showing the high and the low reached inside that period.
A long body means one side won decisively; a small body means the two sides finished near a draw. Long wicks mean price travelled far from the close before returning, which is a footprint of rejection.
On its own, a candle is a snapshot. Read in the context of the prior trend and the levels around it, that snapshot becomes a story: who tried to push, who defended, and where the balance shifted. That is the foundation for every candlestick single technique used in this article.
Choosing where to trade matters as much as the strategy; see the best forex brokers and their conditions.
The six patterns you need to recognize

The types of single candlestick pattern most traders learn first are the Marubozu, Hammer, Doji, Shooting Star, Spinning Top and Hanging Man. Each has a distinct shape that reflects a specific fight between buyers and sellers, and each carries different implications depending on where it appears.
Before the shapes, it's important to understand the role of support and resistance:
- Support is a price level where buying has previously stopped a fall
- Rresistance is a level where selling has previously stopped a rise.
A candle formed at one of these levels carries more weight than the same candle in the middle of nowhere.
| Pattern | Shape | Typical location | Signal |
|---|---|---|---|
| Marubozu | Long body, no wicks | Inside a trend | Continuation, strong momentum |
| Hammer | Small body at the top, long lower wick | After a downtrend, at support | Bullish reversal candidate |
| Doji | Body almost non-existent, open equals close | After an extended move | Indecision, possible reversal |
| Shooting Star | Small body at the bottom, long upper wick | After an uptrend, at resistance | Bearish reversal candidate |
| Spinning Top | Small body, wicks on both sides | Any location | Loss of momentum, indecision |
| Hanging Man | Same shape as Hammer | After an uptrend, at resistance | Bearish reversal candidate |
- The Marubozu is the loudest of the six because there is no rejection: price opened at one end of the range and closed at the other.
- The Doji is the quietest because open and close meet in the middle.
- The Hammer and the Hanging Man share the same body-and-wick arrangement; only the prior trend tells you which one you are looking at.
That is the single most common mistake beginners make, and the reason you cannot read a candle without reading what came before it.
Bullish versus bearish: reading the signal
A bullish single candlestick pattern shows buyers regaining control, either by closing the bar near its high or by rejecting a push lower. A bearish pattern shows sellers rejecting a push higher or closing the bar near its low. The signal type depends on both shape and location.
Take the Hammer. Its long lower wick means price fell during the period but was bought back before the close. That is a bullish footprint. But the same shape, appearing after an extended uptrend at a resistance level, is a Hanging Man: the long lower wick now shows that sellers were able to push price down inside the bar, even if buyers pulled it back. The prior trend flips the reading.
The Shooting Star mirrors this logic for tops. A small body at the bottom of the range and a long upper wick after an uptrend means buyers tried, sellers rejected, and the close finished near the low of the day. That is a bearish reversal candidate at resistance and a weaker signal in the middle of a range.
A useful habit: name the candle only after you have named the trend and the level. Trend first, level second, candle third. Understanding bullish and bearish candlestick patterns in depth will help you refine this discipline across multiple market conditions.
Why prior trend and confirmation are non-negotiable
A single candlestick pattern is most reliable when it forms at a defined level, support, resistance, a moving average or a trendline, after an established trend, and when the following bar confirms the signal. Without those two conditions, most patterns are just noise.
A moving average is a line that plots the average price over a set number of recent bars, smoothing the trend. The 50-period and 200-period moving averages are common reference levels because many market participants watch them.
When a Hammer forms exactly where the 200-period moving average sits below current price, the pattern is defended by a well-known level, which raises the odds that other traders act on it too. Learning how moving average crossovers work will deepen your understanding of these key support and resistance zones.
Confirmation is the next bar. If a Hammer prints at support, the confirmation is a bullish close above the Hammer's high on the following bar. If a Shooting Star prints at resistance, the confirmation is a bearish close below its low. Trading the pattern before confirmation means you are guessing at the reversal; trading it after confirmation means you are following a bar that agreed with you.
Volume matters here too. Volume is the number of units traded during the bar. A reversal candle backed by above-average volume tells you the level was defended by real participation. In centralised markets like futures and stocks, volume is exact; in spot forex it is tick volume, which counts price updates rather than contracts, but still gives a usable proxy for activity.
Timeframe selection and pattern effectiveness
Single candlestick patterns behave differently across timeframes. A Hammer on a 1-minute chart may reverse a two-minute pullback; the same Hammer on a daily chart may mark the low of a multi-week correction. Longer timeframes reduce false signals but produce fewer trading opportunities.
Each candle on a chart represents the same information, but the number of participants and the amount of capital that formed that candle scales with the timeframe. A daily bar aggregates every trade of the session, including decisions from institutional desks that only act on end-of-day closes. A 5-minute bar aggregates a few minutes of order flow, dominated by short-term participants.
| Timeframe | Typical use | Signal quality | Trade frequency |
|---|---|---|---|
| 1-minute, 5-minute | Scalping, entry timing | Low, high noise | Very high |
| 15-minute, 1-hour | Intraday swing | Moderate | High |
| 4-hour | Multi-day swing | Good | Moderate |
| Daily | Positional | Strong | Low |
| Weekly | Long-term positional | Strongest | Very low |
A practical rule for beginners: identify the pattern on the timeframe you plan to hold, then check one higher timeframe for context. If you trade the 1-hour, look at the 4-hour to confirm the level. If the 4-hour trend agrees with the 1-hour signal, you have alignment; if it disagrees, expect the signal to fail more often.
Risk management and position sizing for single candlestick trades
Position size for a single candlestick pattern trade is determined by the distance from your entry to your stop loss, and by how much of your account you are willing to lose on the trade. Fix the loss first, then let the market decide the size.
A stop loss is a resting order that closes your position at a preset worse price to cap the loss. For a Hammer at support, the stop typically sits a few pips below the Hammer's low, because a break of that low invalidates the pattern. A pip is the smallest standard price increment in a forex pair, usually 0.0001 for most majors. For a Shooting Star at resistance, the stop sits above the star's high.
The sizing formula is simple. Decide the risk per trade as a percentage of your account, commonly 0.5% to 1% for retail accounts. On a $10,000 account risking 1%, that is $100 per trade. If the entry-to-stop distance equals $0.50 per share, the position is $100 divided by $0.50, which is 200 shares. The same logic works for forex and CFDs using per-pip values.
According to the FCA, the majority of retail investor accounts lose money when trading CFDs, which is why sizing rules exist before pattern rules. UK retail leverage limits set by the FCA cap major forex CFDs at 1:30, indices at 1:20 and equities at 1:5, and CFDs on cryptoassets are prohibited for UK retail clients. Higher leverage magnifies both the winning and the losing side of a candlestick trade, so respecting the cap and choosing your own risk percentage within it protects you from a single bad signal wiping out weeks of progress. Understanding leverage trading mistakes will help you avoid account blowups.
Common false signals and how to filter them
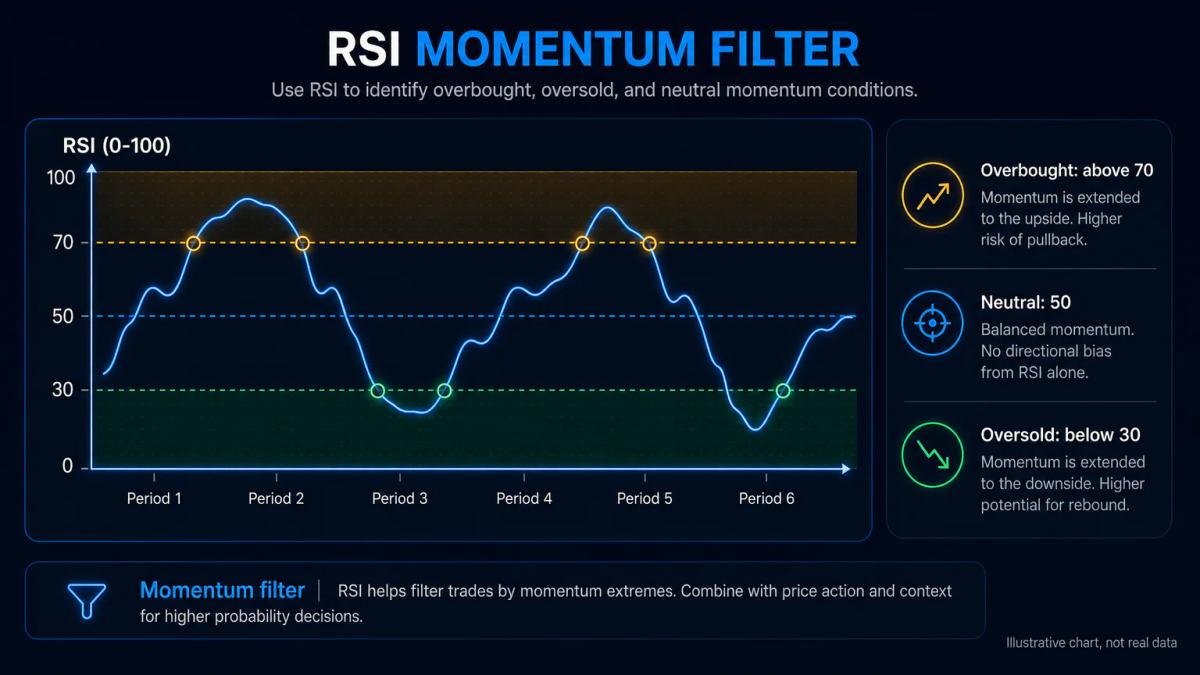
False signals occur when a single candlestick pattern forms in isolation, without a level nearby, or on thin volume. Filtering is a checklist you apply before every trade: level, volume, confirmation, and, when useful, oscillator alignment.
An oscillator is an indicator bounded between fixed values that measures momentum. The Relative Strength Index, or RSI, moves between 0 and 100 and is commonly read as overbought above 70 and oversold below 30. The Moving Average Convergence Divergence, or MACD, tracks the difference between two moving averages and its signal line, giving crossovers as momentum shifts. Bollinger Bands are a moving average with two bands plotted at a set number of standard deviations away, expanding and contracting with volatility.
| Filter | What to check | Passes when |
|---|---|---|
| Level proximity | Nearest support, resistance or moving average | Pattern touches or overlaps the level |
| Volume | Volume of the pattern bar versus the 20-bar average | Above average, ideally 1.5x or more |
| Confirmation | Direction of the following bar | Closes beyond the pattern's high or low |
| Oscillator alignment | RSI reading at the pattern | Oversold for bullish, overbought for bearish |
| Bollinger context | Position of the pattern relative to bands | Touching or piercing the outer band |
A Hammer at support with above-average volume, an RSI reading of 28 and confirmation on the next bar is a high-quality setup. A Hammer in the middle of a range with average volume and no oscillator agreement is one you skip. The point of the checklist is not to catch every reversal; it is to say no often enough that the trades you take are the ones worth taking.
Backtesting and real-world win rates
Single candlestick patterns do not carry a universal win rate. Effectiveness depends on the asset, the timeframe and the confirmation rules layered on top. Backtesting is how you learn what your patterns do on your markets, not what they do in general.
Backtesting means running your rules over historical price data and recording every signal, entry, stop and exit as if you had traded them live. Free tools inside TradingView, MetaTrader 4 (MT4), MetaTrader 5 (MT5) and cTrader let retail traders replay bars and export results. A useful backtest defines every rule before the test starts: the pattern shape, the required level, the volume threshold, the entry trigger, the stop location and the exit method.
A basic template to log for each trade: date, instrument, timeframe, pattern name, level type, volume ratio, RSI value, entry price, stop price, exit price, result in R multiples. R is the ratio of profit or loss to the initial risk of the trade; a trade that makes twice what it risked is a +2R trade.
After 50 to 100 signals, patterns emerge in the data. A Hammer on the daily EUR/USD chart with volume and RSI filters may show one win rate; the same pattern on 5-minute S&P 500 futures may show another. The number you care about is not the win rate on its own, but win rate combined with average R per trade. A 40% win rate at an average of +2R is more profitable than a 60% win rate at +0.5R. Backtesting turns candlestick reading from a belief into a measured process.
Frequently Asked Questions
What is the difference between a Hammer and a Hanging Man candlestick pattern?
The two candles have the same shape: a small body at the top of the range and a long lower wick. The difference is the trend before the candle. A Hammer forms after a downtrend at support and signals a bullish reversal candidate; a Hanging Man forms after an uptrend at resistance and signals a bearish reversal candidate. Confirmation on the next bar is required in both cases.
Can you trade a single candlestick pattern without waiting for confirmation?
You can, but the win rate typically drops. Confirmation, meaning a close on the next bar in the direction of the signal, filters out patterns that print but fail immediately. Trading without confirmation treats the pattern bar as the signal and the entry, which raises the probability of taking losing trades in choppy conditions. Beginners benefit from waiting for the next bar before entering.
How do I know if a single candlestick pattern is reliable on my timeframe?
Backtest it. Log at least 50 to 100 signals of the specific pattern on your chosen instrument and timeframe with your entry and stop rules fixed in advance. Record win rate and average R multiple. If the combination shows a positive expectancy across the sample, the pattern is reliable for your setup; if not, it is not, regardless of how the pattern performs in textbooks.
Should I combine single candlestick patterns with other technical indicators?
Yes, most retail traders get better results combining patterns with a level (support, resistance or a moving average), a volume filter and an oscillator such as RSI or MACD. The pattern gives you the shape of the signal; the indicators tell you whether the market context agrees. Alignment across two or three tools raises the quality of the trades you take and reduces the count of losing setups.
What is the best stop loss placement for a single candlestick pattern trade?
Place the stop just beyond the extreme of the pattern's wick: below the low of a Hammer for a long trade, above the high of a Shooting Star for a short trade. That level is where the pattern would be invalidated by price action, so a stop beyond it exits the trade when the signal has failed. Add a small buffer to avoid being taken out by normal spread widening.
About the authors


Put this into practice
Brokers we have reviewed
Scored on the same five dimensions. Here are three of them — the full list is on the brokers page.



Related articles

Support and Resistance Trading: How to Identify and Trade Price Levels
A practical guide to support and resistance trading: how to mark levels, filter false breakouts, size positions, and apply the strategy across asset classes.

Technical Analysis Explained: Charts, Patterns, and Trading Tools
A working guide to technical analysis for retail traders: chart types, indicators, limitations, backtesting and risk management framed around real broker execution.

Technical Analysis for Swing Trading: Indicators, Setups and Timeframe Strategy
A practical framework for using charts, indicators and multi-timeframe analysis to structure swing trades that last days to weeks.
0 comments