Technical Analysis · Beginner · 10 min read
RSI Indicator Explained: How to Read and Trade the Relative Strength Index
The RSI indicator is a momentum oscillator that measures the speed and magnitude of recent price changes on a scale of 0 to 100. J. Welles Wilder introduced it in his 1978 book New Concepts in Technical Trading Systems. You use RSI to flag overbought and oversold conditions, spot divergences against price, and gauge trend strength on any liquid market.
What is the RSI indicator and how does it work?
The RSI (Relative Strength Index) compares the average size of up closes to the average size of down closes over a fixed lookback window, typically 14 periods, then rescales the result between 0 and 100. Wilder designed it to smooth raw momentum readings and to make different assets directly comparable. A reading of 50 means average gains and average losses are balanced; a reading of 80 means recent up moves have dwarfed recent down moves.
Unlike a simple moving average, RSI does not lag the price by half its window: it reacts to the ratio of gains and losses rather than the absolute price level. This makes it more responsive to shifts in momentum, though the trade-off is a higher false signal rate in choppy markets. Moving averages offer a complementary view of trend direction and are often paired with RSI for confirmation.
You read RSI in three ways. First, as an overbought or oversold gauge using the 70 and 30 thresholds. Second, as a trend filter, where RSI holding above 50 signals bullish control and below 50 signals bearish. Third, as a divergence detector, where RSI fails to confirm a new price extreme. Each read is useful; none of them work alone, which is why the rest of this article covers the traps as well as the setups.
RSI formula and calculation: step by step
RSI is calculated by first isolating the average gain and average loss across the lookback window, then plugging their ratio into a rescaling formula. The core equation is:
RSI = 100 - (100 / (1 + RS))
where RS = Average Gain / Average Loss over N periods (Wilder's default N is 14).
The step-by-step calculation on a 14-period window works like this:
- For each of the last 14 closes, record the change from the prior close.
- Sum all positive changes and divide by 14: that is the initial average gain.
- Sum all negative changes (as absolute values) and divide by 14: that is the initial average loss.
- Compute RS as the ratio of the two averages.
- Apply the rescaling formula to squeeze the result into the 0 to 100 band.
For each subsequent bar, Wilder used a smoothed average rather than a fresh 14-bar window: the new average gain equals the prior average gain multiplied by 13, plus the current gain, divided by 14. The same recursion applies to losses. This is why RSI reacts smoothly to a single spike instead of jumping violently on every bar.
Overbought and oversold levels: the 70 and 30 thresholds

RSI readings above 70 are labelled overbought and readings below 30 oversold. Wilder chose these bands to isolate roughly the top and bottom deciles of momentum readings for a typical stock in the 1970s. In practice, they are conventions, not laws.
The correct interpretation of an overbought reading is not "sell now". It is "upward momentum is stretched, and the odds of a pause or pullback have risen". In a strong uptrend, RSI can sit above 70 for weeks without the price falling. In a weak, range-bound market, a touch of 70 often does mark the top of the swing. The context determines the meaning.
Many traders shift the thresholds to reflect asset volatility and timeframe:
The 50 level is also important: sustained readings above 50 imply buyers are winning the average bar, and below 50 imply sellers are.
RSI divergences and failure swings: spotting hidden reversals
A divergence occurs when price prints a new extreme but RSI does not confirm it, signalling that the momentum behind the move has weakened. This is one of the more citable uses of RSI, and it is the pattern most under-covered by generalist guides.
Bullish divergence: price prints a lower low, but RSI prints a higher low. Sellers are still pushing price down, but with less force each time. This often precedes a bounce or a full reversal, especially near a known support level.
Bearish divergence: price prints a higher high, but RSI prints a lower high. Buyers still lift price, but the drive is fading. This often precedes a pullback or a top.
Hidden divergences work in the opposite direction and act as trend-continuation signals: a higher low in price with a lower low in RSI during an uptrend, for example, points to a resumption of the trend after a shallow pullback.
A failure swing is a variant Wilder singled out because it does not require the price to make a matching extreme. A bearish failure swing prints when RSI crosses above 70, pulls back to a trough, rallies again but fails to break its prior peak, then breaks the intervening trough. A bullish failure swing mirrors this below 30.
J. Welles Wilder, 1978: "Failure swings above 70 or below 30 on the RSI are very strong indications of a market reversal."
Wait for price to break its recent swing structure, or for RSI to cross back through 50, before acting.
How to use RSI for entry and exit signals in trading
RSI generates timing signals when you combine it with price context. The clean templates below cover the three most common uses.
Trend-following entry. In a market where price is above the 200-period moving average and RSI has just recovered from below 40 back through 50, treat the cross of 50 as a re-entry into the trend. This filters out the classic false signal of buying a knife because RSI is "oversold".
Mean-reversion entry. In a range-bound market with clear horizontal support and resistance, buy when RSI drops below 30 while price tags support, and sell when RSI rises above 70 while price tags resistance. Skip the trade if the range is breaking.
Exit rules. Three exit templates work well in practice:
Always attach a hard stop loss (a preset order that closes the trade at a defined loss) based on price structure. Proper position sizing ensures your stop loss aligns with your account risk tolerance.
RSI limitations and when it produces false signals
RSI has three well-documented failure modes, and most losing RSI trades come from ignoring them.
Trending markets keep RSI pinned. In a strong uptrend, RSI can hold above 70 for dozens of bars. Selling every touch of 70 turns a winning market into a losing account. In a strong downtrend, RSI stays below 30 for equally long stretches. The fix: check the higher-timeframe trend before you take an overbought or oversold signal.
Sideways choppy price action creates whipsaws. In a low-volatility range where price wiggles inside a tight band, RSI oscillates through 30 and 70 many times per day without producing meaningful moves. Every touch triggers a signal; almost none pay. The fix: require a minimum range width (measured in the average true range) before trading RSI signals.
Very short timeframes are dominated by noise. On 1-minute and 5-minute charts, spread costs, tick noise, and order book jitter make RSI signals unreliable. According to the FCA's 2023 CFD business review, retail short-term traders show materially higher loss rates than longer-horizon accounts, which is consistent with the difficulty of extracting signal from short-timeframe indicators.
FCA, 2023: UK retail CFD accounts remain net loss-making on aggregate, with short-holding-period strategies over-represented among the worst outcomes.
The practical filter is simple: pair every RSI signal with either a support and resistance level, a candlestick pattern, or a higher-timeframe trend confirmation. Standalone RSI trades are the ones that fill the losing tally.
RSI across different timeframes and asset classes
RSI is timeframe-agnostic in construction but not in behaviour. The same 14-period setting produces different signal quality depending on the chart interval and the underlying market.
Asset class matters too. On major forex pairs, RSI behaves close to textbook: pairs mean-revert often, and 70 or 30 tags cluster near swing extremes. On equity indices, RSI can stay overbought for weeks during trending years; adjust thresholds up to 80/40. On crypto, where 24/7 markets and extreme volatility are the norm, many traders use RSI(9) with 75/25 thresholds instead of the defaults. Note that CFDs on crypto are prohibited for UK retail clients by the FCA, so the crypto RSI use case applies to spot markets or to non-UK retail clients.
RSI optimization and parameter tuning for your trading style
The default RSI(14) is a compromise Wilder chose for daily equity charts. Your strategy may benefit from a different period. The trade-off is universal: shorter periods react faster and generate more signals, at the cost of more false positives; longer periods smooth noise and reduce false positives, at the cost of later signals.
Before committing capital, backtest each candidate setting on at least three years of data for your chosen asset, using the same entry, stop, and exit rules you intend to trade live. Compare not only the win rate but also the maximum drawdown (the peak-to-trough capital fall before a new peak) and the profit factor. The best setting is the one whose equity curve you can psychologically hold through its worst historical stretch. Understanding technical analysis fundamentals will deepen your ability to interpret RSI in context with other tools.
Frequently Asked Questions
What is the difference between RSI and MACD for identifying momentum?
RSI is a bounded oscillator on a 0 to 100 scale that measures the ratio of average gains to average losses; MACD is an unbounded indicator that plots the difference between two exponential moving averages. RSI is better for identifying overbought and oversold extremes and short-horizon momentum shifts. MACD is better for confirming trend direction and for smooth cross signals on longer timeframes. Many traders run them together: RSI for timing, MACD for trend context.
Can RSI be used alone to trade, or does it need confirmation from other indicators?
RSI alone produces too many false signals to trade profitably in most retail conditions. Standalone 70/30 signals fail in trending markets, and standalone divergence signals fail in choppy ranges. Pair RSI with at least one of: a higher-timeframe trend filter, horizontal support and resistance levels, or a price-action confirmation (a candlestick reversal pattern or a break of the recent swing). This combination filters out most low-quality signals without adding heavy complexity.
Why does RSI stay above 70 or below 30 for so long in trending markets?
RSI measures the ratio of average gains to average losses. In a strong uptrend, gains dominate almost every bar, so the ratio stays high and RSI stays above 70 until sellers regain material control. The same logic keeps RSI pinned below 30 in strong downtrends. This is not a fault of the indicator, it is a correct reading of persistent momentum. The fix is to raise the overbought threshold to 80 and the oversold to 40 in trending conditions, or to use RSI only for divergences during trends.
How do I adjust RSI settings for scalping versus swing trading?
For scalping on 1-minute to 15-minute charts, many traders use RSI(7) or RSI(9) with tighter thresholds (say 80/20) to filter out the noise that a sensitive setting would otherwise pick up. For swing trading on 4-hour and daily charts, the default RSI(14) with 70/30 thresholds works well. For position trading on weekly charts, RSI(21) reduces the number of signals but each one carries more weight. Always backtest the setting on your specific asset before trading it live.
What is the best RSI divergence pattern to trade for reversals?
The highest-conviction divergence pattern is a bullish or bearish divergence that forms at a known support or resistance level on a higher timeframe (4-hour or daily), and that is followed by a break of the most recent price swing. This combination requires three things to align: a divergence, a structural level, and a confirmation break. The failure rate of divergences traded without structural context is materially higher, which is why patient waiting for the confluence pays off.
About the authors


Related articles
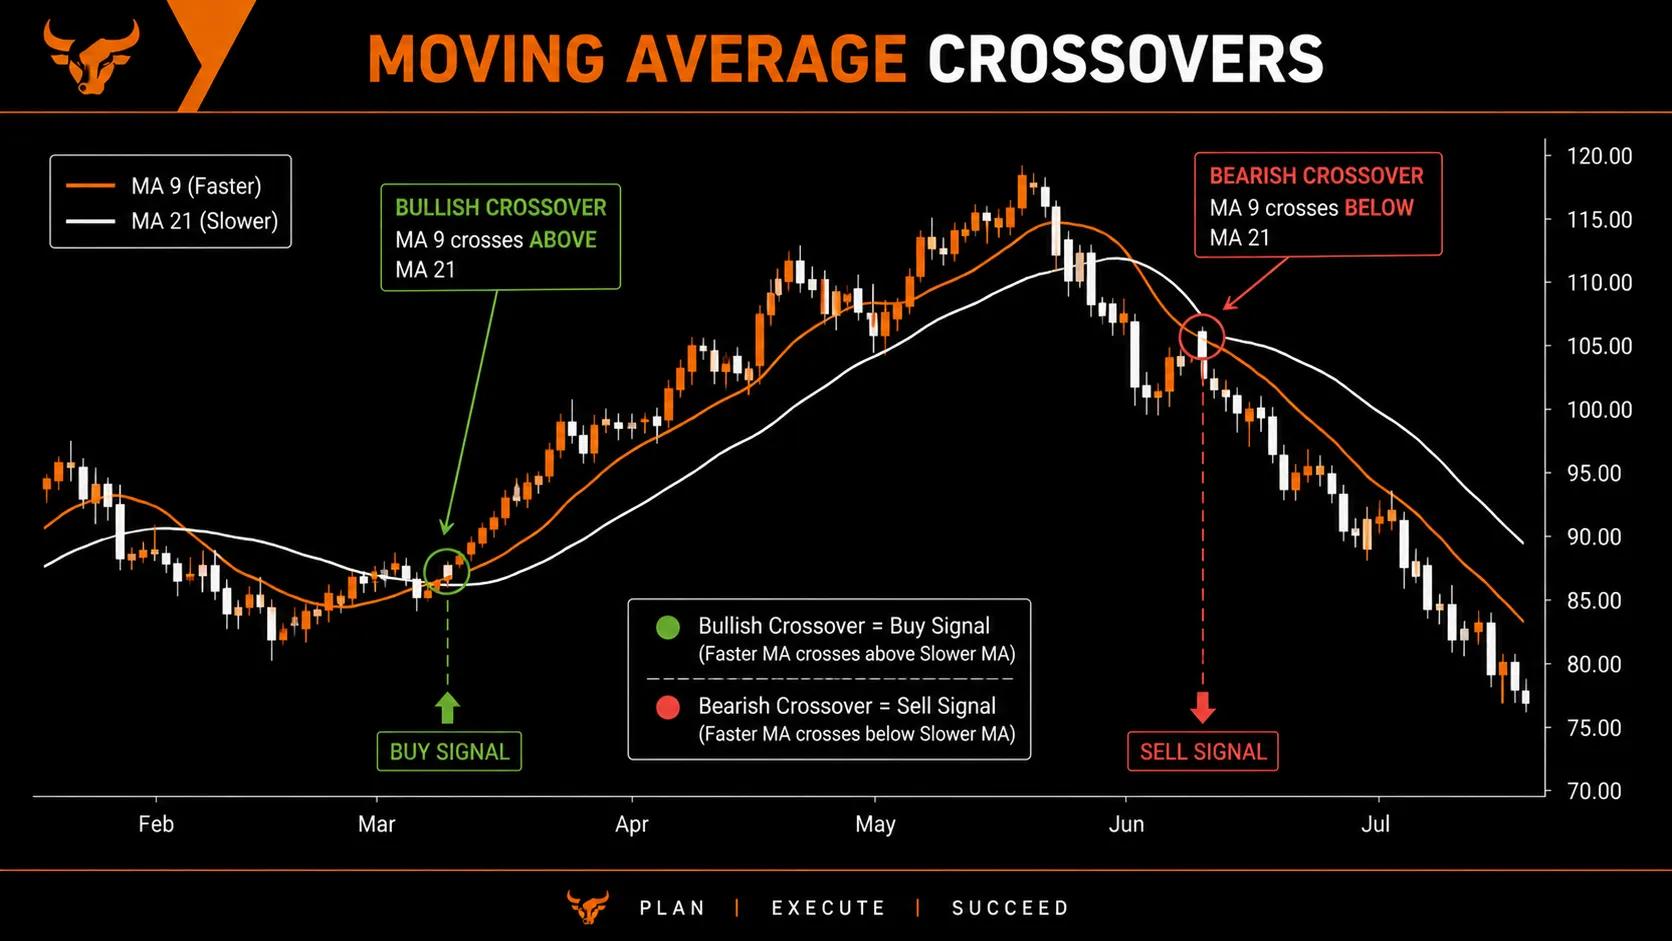
Moving Averages Explained: SMA, EMA, and How Traders Use Them
Moving average trading explained simply. Learn how SMA and EMA work, how to read crossovers, and how traders use them to spot trends and time entries.
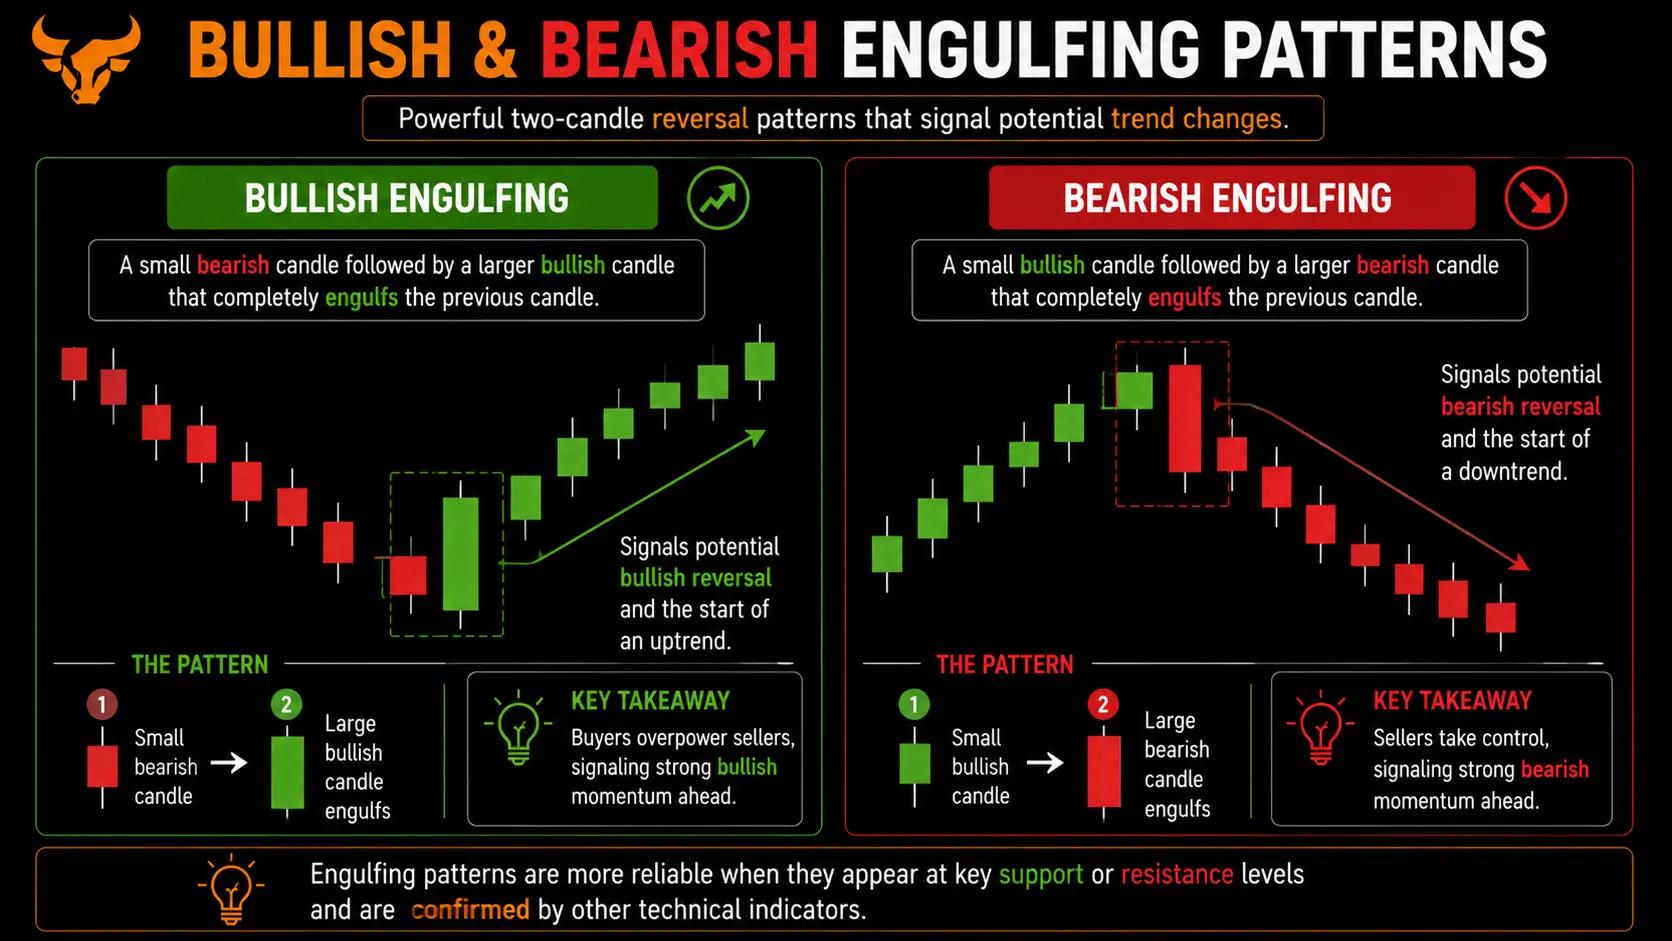
Candlestick Patterns Explained: A Practical Visual Guide
Candlestick patterns explained for new traders: read doji, hammer, and engulfing signals with clear visual chart examples.

Demo to Live Trading Guide: How to Make the Switch Without Blowing Up
Learn how to move from demo to live trading without blowing up. Covers mindset, position sizing, and your first week live.
0 comments