



Technical Analysis · Intermediate · 5 min read
ATR indicator explained: measuring volatility and setting stops
The ATR indicator, or Average True Range, is a volatility gauge that measures the average price movement of an asset over a set period, typically 14 bars, without indicating direction. Developed by J. Welles Wilder Jr. in 1978, ATR quantifies how much a market moves on average, helping you calibrate stop losses, position size and volatility expectations.
What is the ATR indicator and how does it measure volatility
ATR captures the size of price movement, not its direction. A rising ATR tells you that recent bars are covering more ground: wider ranges, larger swings, more risk per trade. A falling ATR tells you the market is compressing into a tighter range, which often precedes a breakout or signals a consolidation phase.
Wilder introduced ATR in his 1978 book, New Concepts in Technical Trading Systems, alongside RSI and the Parabolic SAR. Unlike oscillators that bounce between fixed bounds, ATR has no upper or lower limit: its value only makes sense relative to the same instrument's own history. On EUR/USD, an ATR of 90 pips is unremarkable; on a low-volatility bond ETF, that reading would be extraordinary.
Choose a broker with strong charts among the best forex & CFD brokers.
How to calculate True Range and ATR step by step
True Range (TR) is the foundation of the ATR indicator. For each bar, TR is the greatest of three values: the current high minus the current low, the absolute value of the current high minus the previous close, or the absolute value of the current low minus the previous close. Including the previous close captures gaps, which a simple high minus low would miss.
ATR is then a moving average of True Range. Wilder used a smoothed 14-period average, but a simple 14-period mean produces a close approximation. To compute it manually:
| Step | Action |
|---|---|
| 1 | Calculate TR for each of the last 14 bars |
| 2 | Sum the 14 TR values |
| 3 | Divide by 14 to get the initial ATR |
| 4 | For subsequent bars, apply Wilder smoothing: ((prior ATR × 13) + current TR) / 14 |
MT4, MT5, cTrader and TradingView all compute ATR automatically. Knowing the mechanics still matters: it explains why ATR reacts slowly and why a single volatile bar barely moves the reading.
Using ATR for stop loss placement and position sizing
ATR multiples are the most practical application. Multiplying the current ATR by 1.5 to 2.0 gives a stop loss distance that is wide enough to survive normal market noise but tight enough to protect capital. A stop loss placed inside one ATR is often taken out by ordinary fluctuation; a stop beyond three ATR is usually too wide to justify the reward.
For position sizing, divide your intended risk per trade by the ATR-based stop distance. You're risking £100 on GBP/USD with an ATR of 80 pips, so you set the stop at 120 pips (ATR × 1.5). At £100 risk divided by 120 pips, each pip is worth about £0.83, which translates to roughly 0.08 standard lots. A lot is 100,000 units of the base currency; a standard lot on GBP/USD moves about £8 per pip. This method links your position size directly to current volatility, and understanding position sizing in trading helps you apply this feedback consistently across all your trades.
When ATR expands, positions shrink automatically; when ATR contracts, positions grow. Fixed-pip stops ignore this feedback and lead to inconsistent risk exposure across market conditions.
Interpreting high and low ATR values in different markets
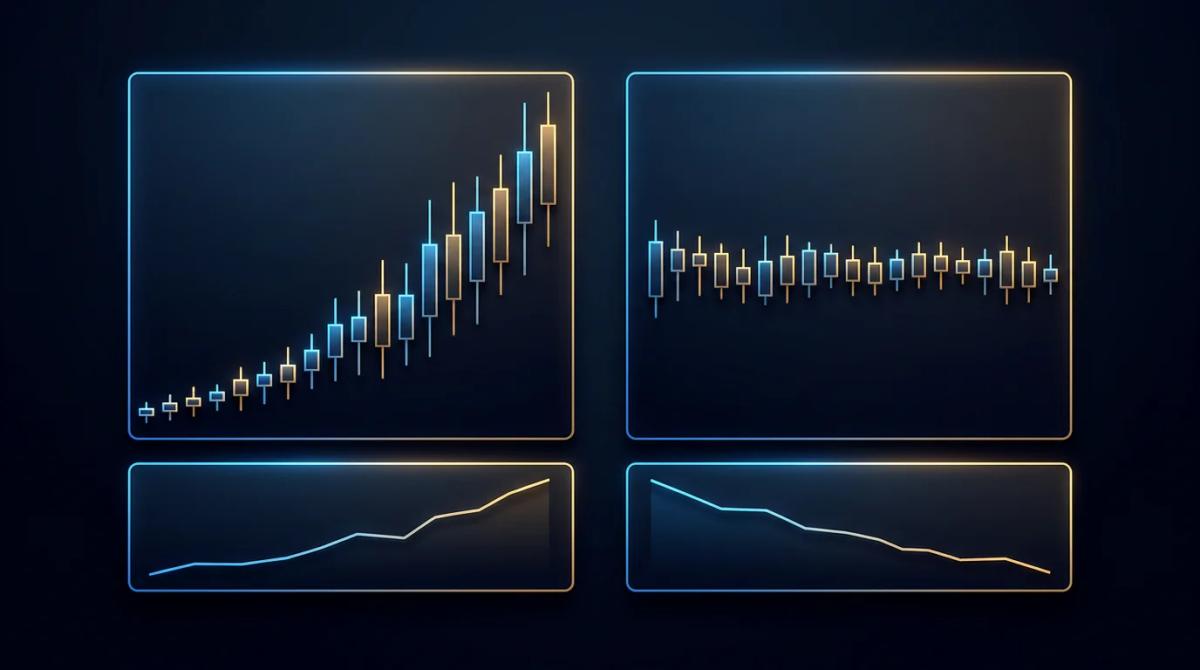
High ATR readings indicate strong volatility and wide price swings; low readings signal consolidation. ATR is relative: 200 pips on EUR/USD is a busy session, 200 pips on a micro-cap stock priced at $2 is extreme. Always compare an ATR value to its own history on the same chart and timeframe, never across different instruments.
Rising ATR often accompanies trend acceleration or breakout activity, while falling ATR points to range conditions where mean reversion strategies may perform better. Combine ATR context with price action and structural levels such as support, resistance, and prior highs. ATR alone tells you the size of the wave.
ATR limitations and when it fails in ranging markets
ATR measures volatility but does not predict direction, confirm trends or filter false signals. In tight ranges, ATR drops sharply, which pulls stop losses very close to entry and increases the chance of being stopped out by ordinary noise. ATR also lags: it reflects past volatility, so a sudden news release can produce a violent move before ATR adjusts to the new regime.
ATR-based stops can be triggered on whipsaws and false breakouts, especially around session opens and scheduled news. Pair ATR with a trend filter using moving averages or higher-timeframe structure, or combine it with a momentum indicator such as RSI or MACD to reduce low-quality entries.
ATR across asset classes: forex, indices, and equities
ATR behaves differently across asset classes because each has its own volatility profile.
| Asset class | Instrument example | Typical daily ATR |
|---|---|---|
| Major forex | EUR/USD, GBP/USD | 50 to 150 pips |
| Stock indices | FTSE 100, S&P 500 | 30 to 100 points |
| Large-cap equity | Liquid blue-chip | £0.50 to £2.00 |
| Small-cap equity | Illiquid micro-cap | Several pounds, highly variable |
Cryptocurrency CFDs are prohibited for UK retail clients by the FCA, so ATR calibration on crypto does not apply to that audience through UK-authorised brokers. Always recalibrate ATR expectations to the specific instrument, timeframe and session you trade.
Frequently Asked Questions
What is the difference between ATR and standard deviation as volatility measures?
ATR averages the true range of each bar, including gaps, giving an absolute size in pips or points. Standard deviation measures dispersion of returns around a mean, expressed statistically. ATR is more practical for setting stops in price units; standard deviation is more useful in options pricing and portfolio risk models.
Can you use the ATR indicator on intraday timeframes like 5-minute or 1-hour charts?
Yes. ATR works on any timeframe: it simply reflects the volatility of the bars you feed it. On a 5-minute chart, ATR captures short-term noise; on a 1-hour chart, it smooths session-level movement. Recalibrate stop multiples for each timeframe, because a 1.5 ATR stop on a 5-minute chart is far tighter than on a daily chart.
How do you optimise the ATR period for your trading style?
The default 14 periods reflects Wilder's original recommendation and suits swing and position trading. Shorter periods (7 to 10) react faster and suit scalpers and day traders who need responsive readings. Longer periods (20 to 30) smooth the output and suit position traders who want stable volatility estimates. Test the setting on your instrument and timeframe rather than assuming 14 is optimal.
Does ATR work better for trend-following or range-trading strategies?
ATR is neutral: it supports both approaches. Trend followers use it to trail stops, letting winners run while cutting losers at a volatility-adjusted distance. Range traders use it to size positions and identify contraction phases that may precede breakouts. The indicator itself does not favour one style; how you apply it does.
What happens to ATR during market gaps or overnight sessions?
Gaps enlarge True Range because TR includes the difference between the previous close and the current high or low. A weekend gap on GBP/USD or an earnings gap on a stock will spike TR on the first bar after the gap, which lifts ATR for several bars until the smoothing absorbs the value. Expect wider stops in the immediate aftermath of gap events.
About the authors


Put this into practice
Brokers we have reviewed
Scored on the same five dimensions. Here are three of them — the full list is on the brokers page.



Related articles

Ascending Triangle Chart Pattern: Definition, Setup, and Trading Rules
A working guide to the ascending triangle chart pattern: how to spot it, confirm the breakout, place stops, and avoid the false signals that trap most retail traders.

Bearish Candlestick Patterns: How to Identify and Trade Reversals
A practical reference to the most reliable bearish candlestick patterns, how to confirm them, and how to trade reversals while keeping risk under control.

Bollinger Bands explained: how to read and trade this volatility indicator
A trader-focused guide to Bollinger Bands: how the three lines are built, what band touches really mean, and how to avoid the mistakes that trap retail traders.
0 comments