Technical Analysis · Beginner · 9 min read
Bollinger Bands explained: how to read and trade this volatility indicator
Bollinger Bands are a volatility indicator built from a 20-period simple moving average (the middle band) with two outer lines plotted two standard deviations above and below it. The bands widen when volatility rises and contract when it falls, helping you locate stretched prices, quiet consolidations, and potential breakout points.
What are Bollinger Bands and how do they work?
Bollinger Bands wrap price in a statistical envelope that adjusts to recent volatility. The middle band is a 20-period simple moving average (SMA), which is the average closing price over the last 20 candles. The upper and lower bands sit two standard deviations away, where standard deviation is a statistical measure of how far prices deviate from that average. Because the bands are recalculated on every candle, they breathe with the market instead of sitting at fixed levels.
When the two outer lines pull apart, volatility is expanding, often during a fresh trend or news reaction. When they squeeze together, volatility is compressing, which historically precedes larger directional moves. A touch of the upper band shows price is stretched relative to its own recent behaviour; the same logic applies to the lower band on the downside.
Bollinger Bands they describe where current price sits inside its own volatility distribution and let you frame decisions around that context. You still need a trigger, a risk plan, and confirmation from price action or a second indicator before acting on any band touch or squeeze.
The history and components of Bollinger Bands
John Bollinger developed the indicator in the early 1980s while working as a market analyst on US financial television. His goal was to replace the fixed percentage envelopes then in use with a volatility-adaptive tool, and he formalised the design in his book Bollinger on Bollinger Bands (2001). The indicator has been in continuous public use for more than four decades and is bundled by default on MetaTrader 4, MetaTrader 5, cTrader, and TradingView.
The construction has three components. The middle band is a 20-period SMA of closing prices. The upper band is that SMA plus two standard deviations of the same 20 closes. The lower band is the SMA minus two standard deviations. The defaults (20 periods, two deviations) were chosen by Bollinger after empirical testing across US equities, and most trading platforms still ship with those numbers preselected.
How to calculate Bollinger Bands: the formula explained
The formula is compact and worth knowing, even if your chart draws it automatically. First, compute the 20-period simple moving average of closing prices: sum the last 20 closes and divide by 20. That gives you the middle band. Next, compute the standard deviation of those same 20 closes. Multiply the standard deviation by two. Add that value to the middle band to get the upper band; subtract it to get the lower band.
In compact form:
- Middle Band = SMA(close, 20)
- Upper Band = Middle Band + (2 × StdDev(close, 20))
- Lower Band = Middle Band - (2 × StdDev(close, 20))
The two-standard-deviation choice matters. In a normal statistical distribution, roughly 95% of observations fall within two standard deviations of the mean. Financial returns are not perfectly normal (they have fatter tails, meaning extreme moves occur more often than the model predicts), so band touches happen more frequently than 5% of the time in practice. Treat the 95% figure as a rule of thumb about typical days, not a hard probability for the next candle.
Trading strategies using Bollinger Bands: mean reversion and breakouts
Two strategy families dominate. Mean reversion assumes price will drift back toward the middle band after touching an outer band; you buy near the lower band and sell near the upper band, targeting the SMA. Breakout trading takes the opposite view: a close outside the band signals momentum strong enough to sustain, and you enter in the direction of the break. Both strategies use the same indicator; the difference is the market regime you apply them in.
Regime matters more than the strategy itself. Mean reversion wins in ranging markets where price oscillates around a stable average. Breakout trading wins in trending markets where each band tag extends further before reversing. Applying mean reversion during a strong trend is one of the most common ways retail traders bleed capital, because price can hug the upper band for dozens of candles in a genuine advance.
The Bollinger Squeeze is a hybrid setup. When bandwidth contracts to a multi-month low, volatility is compressed and a directional break often follows. You wait for a candle close outside the band and trade in that direction, using the opposite band as a trailing reference.
Bollinger Bands across timeframes and asset classes
Bollinger Bands work on any timeframe because standard deviation is unit-free relative to price. On a 1-minute forex chart, the bands respond to intraday spread and order-flow noise; on a weekly equity chart, they capture multi-month volatility cycles. The signal quality tends to improve on higher timeframes because there are fewer false touches from micro-noise, but the trade frequency drops accordingly.
Asset class changes the character of the signal. Major forex pairs like EUR/USD produce clean, symmetrical bands because their return distribution is relatively tight. Equity indices show wider bands around earnings and macro events. Individual stocks generate aggressive band expansions on news. Crypto, where allowed, produces the widest bands and the most frequent extreme touches due to structurally higher volatility. Adjust your period setting to the instrument: 10 to 15 periods for a more responsive read, 30 to 50 for a smoother, higher-timeframe filter.
Common mistakes and limitations when trading Bollinger Bands
The most damaging mistake is treating a band touch as a signal on its own. In a trending market, price can ride the upper band for a long sequence of candles, and every mean-reversion short taken against that trend loses. John Bollinger himself has repeated across interviews and his 2001 book that band tags are not buy or sell signals in isolation; they are context. Without confirmation from price action, volume, or a momentum indicator, the touch is just data.
A second mistake is assuming the bands predict. They do not. Bollinger Bands are lagging by construction, because the SMA and standard deviation are both derived from historical closes. When a flash crash or gap moves price several percent in one candle, the bands have not yet adjusted and price prints far outside them; the indicator is describing yesterday's volatility, not today's shock. Any strategy that relies on rapid mean reversion after such a print is exposed to further extension.
Third, over-optimisation of the settings is a trap. Traders who backtest hundreds of period and deviation combinations on a single instrument tend to find a curve fit that fails out of sample. The 20-period, 2-deviation default is a Schelling point: it is what most other participants are watching, which gives band levels a mild self-fulfilling quality. Deviating from it should be justified by the instrument's volatility profile, not by backtest cosmetics.
Combining Bollinger Bands with other indicators for confirmation
Pairing Bollinger Bands with a momentum oscillator is the standard upgrade. The Relative Strength Index (RSI), which measures the speed and magnitude of recent price changes on a 0 to 100 scale, filters out weak band touches. A mean-reversion long only fires when price tags the lower band AND RSI is below 30, indicating oversold momentum aligned with the volatility stretch. This double condition cuts a large share of the false signals that pure band-touch systems produce in trending markets.
Moving Average Convergence Divergence (MACD), an indicator that tracks the difference between two exponential moving averages and its signal line, helps you classify the regime before choosing the strategy. When the MACD histogram is expanding, treat band touches as trend continuation and lean on breakout logic. When MACD flattens near zero, treat band touches as reversion candidates. Adding a support and resistance overlay from prior swing highs and lows gives the entry a structural anchor beyond the indicator itself.
Advanced Bollinger Band variations: %b, bandwidth, and beyond
Bollinger %b normalises price against the bands on a 0 to 1 scale. A %b of 0 means price sits exactly at the lower band; 1 means it sits at the upper band; 0.5 means it sits at the middle band. Values above 1 or below 0 indicate price has closed outside the envelope. Because %b is a single number, you can plot it as an oscillator underneath price and screen dozens of instruments at once for extreme readings, which is faster than eyeballing every chart.
Bollinger Bandwidth measures the distance between the upper and lower bands as a percentage of the middle band. A very low bandwidth flags a Bollinger Squeeze, the compression phase that often precedes a directional move. A very high bandwidth flags exhaustion, where volatility may soon revert. Together, %b and Bandwidth cover the two questions a discretionary trader actually asks: where is price inside its distribution, and is the distribution widening or narrowing. Both are shipped by default on TradingView and most MetaTrader builds.
Frequently Asked Questions
What does it mean when price touches the upper or lower Bollinger Band?
A touch shows price is roughly two standard deviations away from its 20-period average, meaning the move is statistically stretched relative to recent behaviour. It is not a buy or sell signal by itself. In a range, a touch often precedes reversion to the middle band. In a trend, price can ride the band for many candles, so you need confirmation from momentum or price action before acting.
Can you use Bollinger Bands alone to trade profitably, or do you need other indicators?
Trading Bollinger Bands in isolation is possible but low-edge, because the indicator produces frequent false signals in trending markets. Adding a momentum filter (RSI or MACD) or a structural filter (support and resistance, prior swing levels) materially improves signal quality. John Bollinger has repeated across his book and interviews that the bands are a framework, not a standalone system.
How do you adjust Bollinger Bands settings for different timeframes and market conditions?
The 20-period, 2-deviation default is a strong baseline across timeframes. For higher-frequency intraday work, some traders shorten the period to 10 or 15 to increase responsiveness. For weekly or monthly analysis, 30 to 50 periods produce smoother envelopes. Increasing the deviation to 2.5 or 3 reduces false touches on highly volatile instruments; decreasing it below 2 is rarely useful.
Why do Bollinger Bands sometimes fail to contain price action during volatile market moves?
The bands are calculated from historical closes, so they lag current volatility. During gaps, news shocks, or flash crashes, price can jump several standard deviations in one candle and print far outside the envelope. The bands then widen on the following candles to catch up. This is a structural limitation of any volatility indicator built on rolling standard deviation, not a flaw in the specific settings.
What is the difference between Bollinger Bands and other volatility indicators like Keltner Channels?
Bollinger Bands use standard deviation of closing prices to set the outer lines, so they react to statistical dispersion. Keltner Channels use the Average True Range (ATR), a measure of average candle range including gaps, to set width around an exponential moving average. Bollinger Bands expand and contract more aggressively in fast markets; Keltner Channels tend to be smoother, which some traders prefer for trend-following systems.
About the authors


Related articles
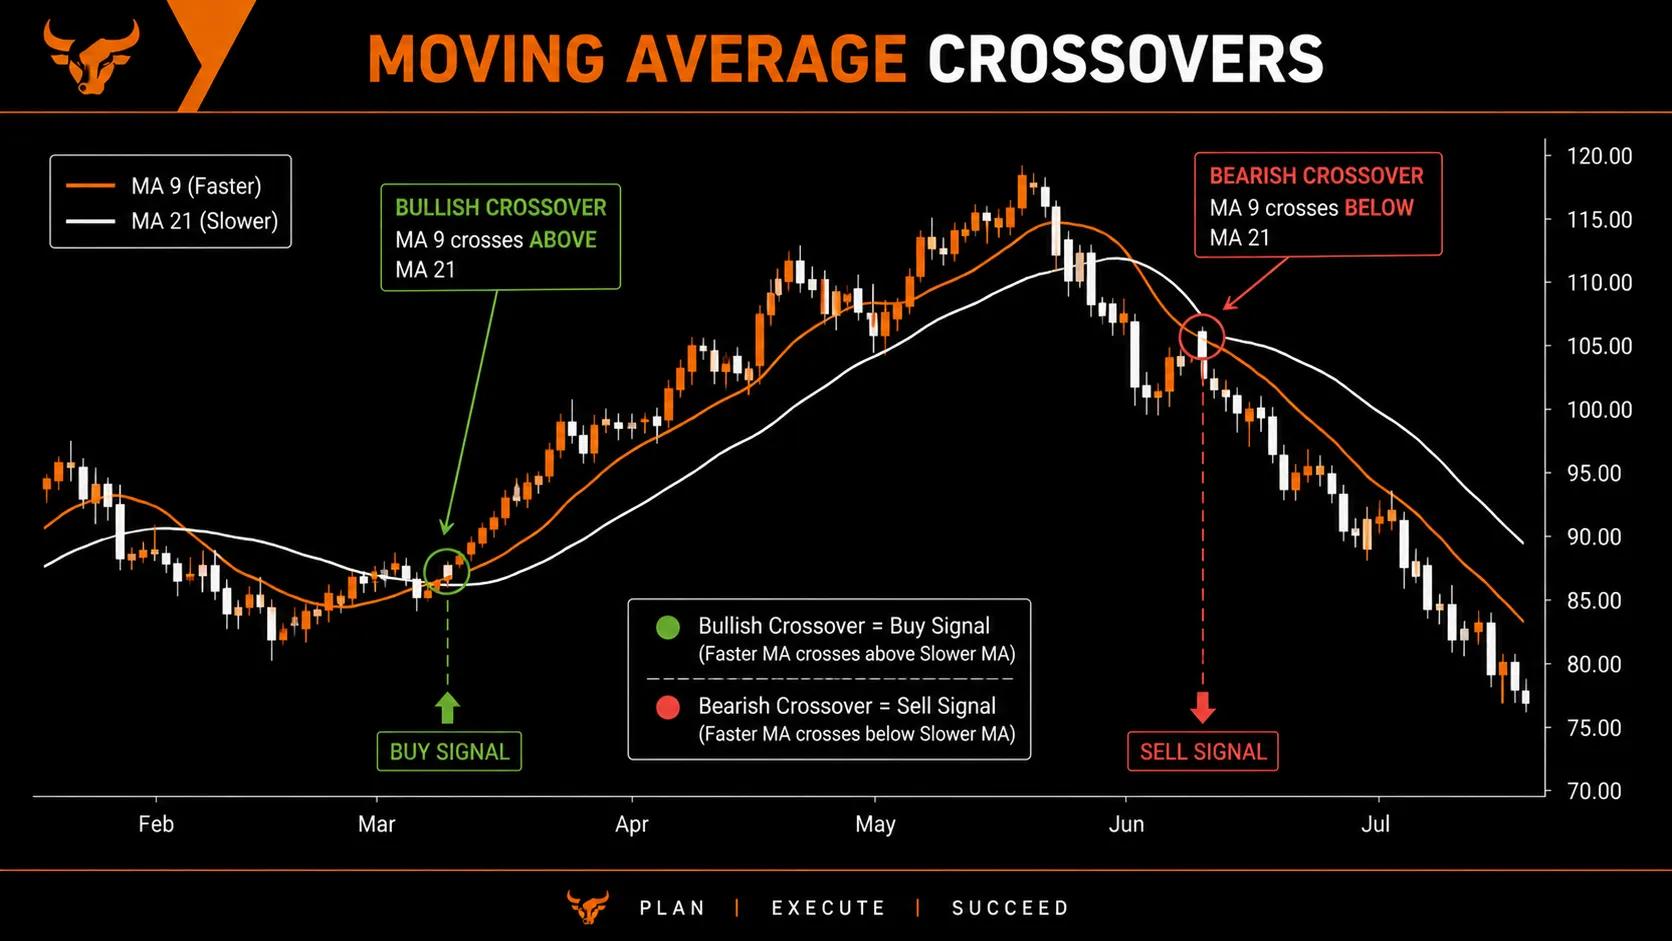
Moving Averages Explained: SMA, EMA, and How Traders Use Them
Moving average trading explained simply. Learn how SMA and EMA work, how to read crossovers, and how traders use them to spot trends and time entries.
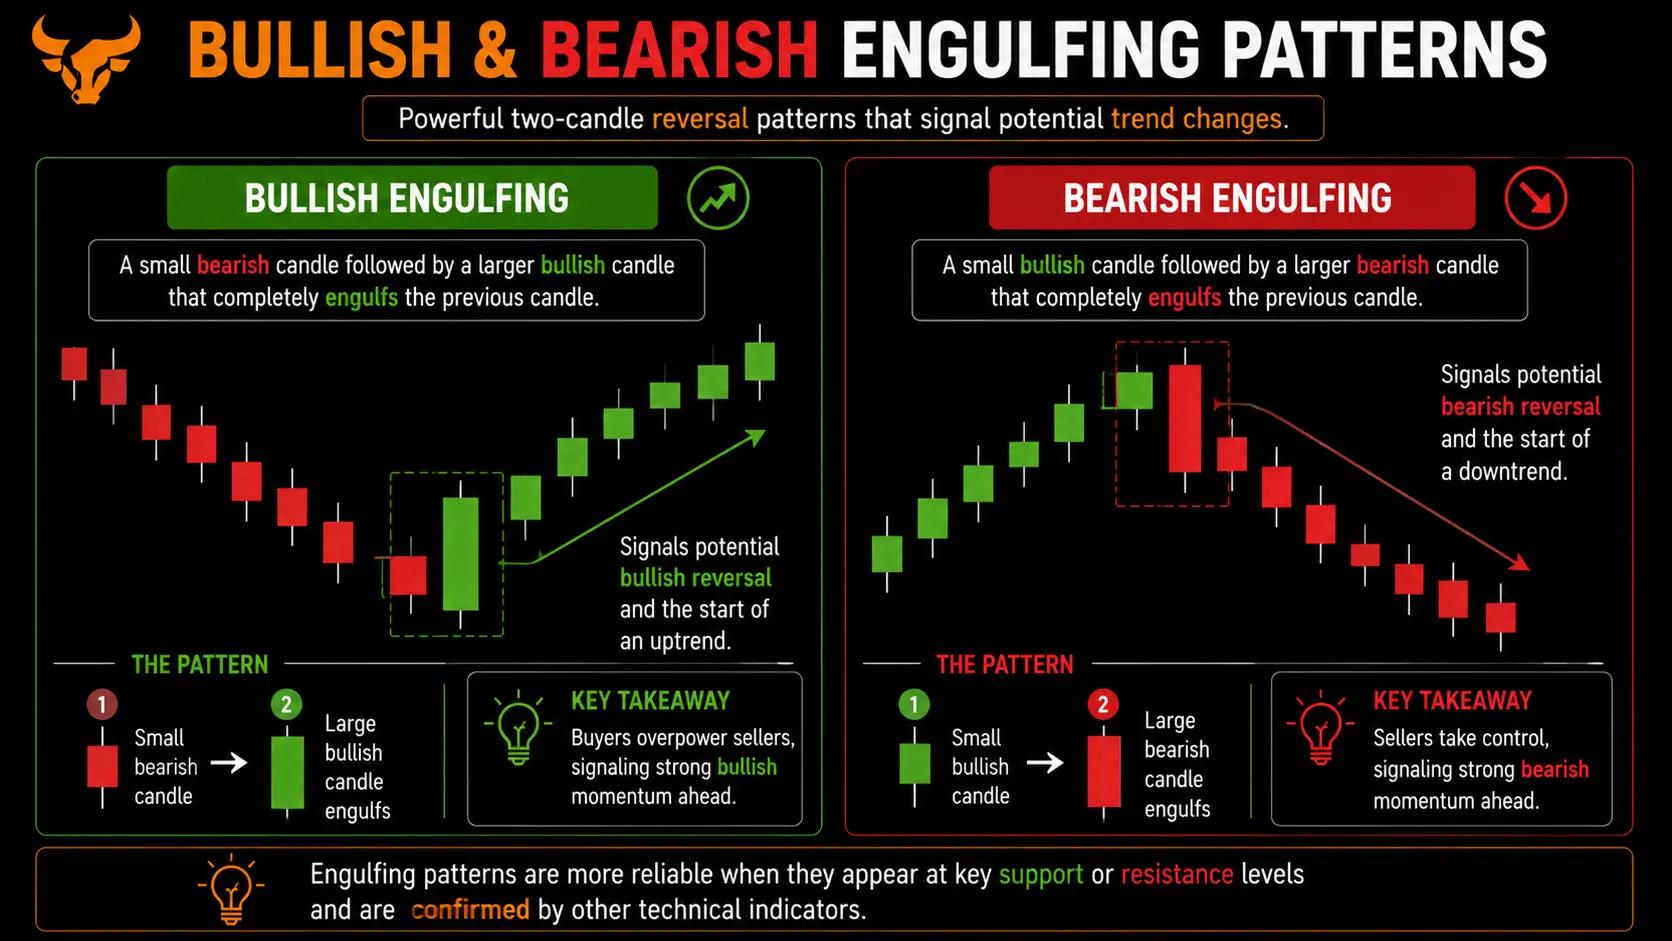
Candlestick Patterns Explained: A Practical Visual Guide
Candlestick patterns explained for new traders: read doji, hammer, and engulfing signals with clear visual chart examples.

Demo to Live Trading Guide: How to Make the Switch Without Blowing Up
Learn how to move from demo to live trading without blowing up. Covers mindset, position sizing, and your first week live.
0 comments