Technical Analysis · Intermediate · 9 min read
MACD Indicator Explained: How to Read Signals and Trade Trends
MACD (Moving Average Convergence Divergence) is a momentum oscillator that subtracts a 26-period exponential moving average from a 12-period exponential moving average. It uses three components: the MACD line, a 9-period signal line, and a histogram. Together they reveal trend direction and whether momentum is accelerating or fading.
What Is MACD and How Does It Work
MACD is a momentum oscillator designed by Gerald Appel in the late 1970s to track the relationship between two exponential moving averages of price. An exponential moving average (EMA) is an average that weights recent prices more heavily than older ones, so it reacts faster than a simple average. The MACD reading tells you whether the faster EMA is pulling away from the slower one, which is the signature of an emerging trend, or converging back into it, which signals momentum is stalling.
The indicator sits below the price chart and has three moving parts. The MACD line shows the raw difference between the 12-period and 26-period EMAs. The signal line, a 9-period EMA of the MACD line, smooths that reading. The histogram plots the gap between the two lines as vertical bars: it grows when momentum expands and shrinks when it fades.
Unlike bounded oscillators such as RSI, MACD has no fixed upper or lower limits, so its values scale with the instrument's price. A MACD reading of 50 on the S&P 500 index is not comparable to a reading of 50 on EUR/USD. You interpret MACD relative to its own recent range on that specific chart.
MACD Components and Calculation

The MACD line is computed by subtracting the 26-period EMA of closing prices from the 12-period EMA. When the fast EMA is above the slow EMA, the MACD line is positive; when it is below, the MACD line is negative. The distance between the two EMAs, expressed as a single line, is what you actually see plotted.
The signal line is a 9-period EMA calculated on the MACD line itself. Because it averages the MACD line, it always lags the MACD line slightly, and that lag is what produces the crossovers traders watch for. The default configuration is written as (12, 26, 9), referring to the fast EMA period, slow EMA period, and signal line period respectively.
The histogram is the arithmetic difference between the MACD line and the signal line. When the MACD line is above the signal line, histogram bars appear above zero; when it is below, bars appear below zero. Rising bars mean the gap is widening, so momentum is accelerating; shrinking bars mean the gap is closing, often the first hint of a coming crossover.
Trading Signals: Crossovers and Zero-Line Crossings
MACD produces two primary signal families. The signal-line crossover is the most common: when the MACD line crosses above its 9-period signal line, momentum is turning up, which traders read as a bullish trigger. When it crosses below, momentum is turning down, a bearish trigger. These crossovers happen frequently, which is both the strength and the weakness of the tool.
The second family is the zero-line crossing. When the MACD line crosses above zero, the fast EMA has just overtaken the slow EMA, confirming that price has shifted into an uptrend on that timeframe. Crossing below zero flips the trend structure to the downside. Zero-line crossings occur less often than signal-line crossovers and act more like a trend filter than an entry timer.
Many trend traders use both signals together: they only take long entries from signal-line crossovers that occur while the MACD line sits above zero, and short entries only while it sits below zero. That filter cuts the number of trades roughly in half but avoids the trades that fight the prevailing trend, which is why position sizing becomes critical to managing the remaining risk.
MACD as a Momentum and Trend-Following Tool
MACD is built for trending markets because its architecture measures the spread between a fast and a slow EMA, which only widens meaningfully when price is moving in one direction. The 12-period EMA reacts quickly to fresh moves; the 26-period EMA anchors the reading to the broader context. When the two diverge, a trend is running; when they converge, the trend is losing steam.
This dual-speed design makes MACD popular with swing traders holding positions from several days to a few weeks. On a daily chart, a fresh bullish signal-line crossover after a zero-line cross often marks the early stage of a multi-week move. Position traders on weekly charts use it similarly, taking fewer but larger signals. Intraday scalpers rely on MACD less, because the noise on 1-minute and 5-minute charts overwhelms the underlying signal.
MACD Limitations and Whipsaw Risk in Ranging Markets
MACD performs badly in ranging markets, meaning periods when price moves sideways within a horizontal band. In a range, the 12-period and 26-period EMAs constantly cross and re-cross each other as price oscillates around them, so the MACD line whips back and forth across the signal line. Each of those whipsaws (rapid alternating signals that reverse before a trader can profit) triggers an entry that is stopped out shortly after.
The second limitation is lag. Because MACD is built from EMAs, and EMAs are averages of past prices, every signal arrives after the move it describes has already started. A signal-line crossover on a daily chart typically confirms a move that began 3 to 8 sessions earlier. Traders accept that lag in exchange for filtered noise, but it means MACD is not suited for catching exact tops and bottoms.
The practical filter is to combine MACD with a trend-strength gauge such as ADX. When ADX (the Average Directional Index, which quantifies how strong a trend is regardless of direction) reads below 20, the market is ranging and MACD signals should be ignored or faded. When ADX reads above 25, MACD signals become far more reliable.
Divergence Trading and Confirmation Strategies
Divergence is the MACD signal experienced traders value most. Regular bullish divergence appears when price prints a lower low but the MACD line prints a higher low, meaning downside momentum is fading even as price grinds lower. Regular bearish divergence appears when price prints a higher high but MACD prints a lower high, signalling that upside momentum is weakening while price still climbs. Both often precede reversals.
Divergence works best at extremes of a move rather than in the middle of a trend. A bearish divergence forming after a long, extended rally into support and resistance is a higher-quality signal than the same divergence appearing mid-trend. The reason is context: reversals need a stretched market to reverse from. Divergences that form in the middle of a healthy trend frequently resolve by the trend simply continuing, wiping out the divergence trade.
Most practitioners combine MACD divergence with at least one confirmation. Common pairings are RSI divergence in the same direction, a break of a short-term trendline on price, or a candlestick reversal pattern at a known support or resistance level. That layered approach filters out the divergences that never resolve into reversals, which are the majority.
MACD Parameter Customization and Timeframe Considerations
The default (12, 26, 9) settings were designed for daily charts of US equities in the 1970s, and they remain a sensible baseline for daily and 4-hour charts today. On shorter timeframes such as 15-minute or 1-hour charts, faster settings like (5, 13, 5) or (6, 19, 9) reduce lag but produce more whipsaws, a trade-off intraday traders often accept because their holding periods are short enough to absorb the noise.
On weekly charts, some position traders extend to (19, 39, 9) or (24, 52, 9) for additional smoothing, which suppresses minor pullbacks and highlights only major trend shifts. The general principle is that shorter parameters mean faster signals and more false positives; longer parameters mean slower signals and fewer, higher-conviction triggers. Any parameter change should be backtested on the specific instrument and timeframe before it is used live.
MACD vs Other Momentum Indicators
MACD is one of several momentum tools, and it is useful to understand where each fits. RSI (Relative Strength Index) measures the ratio of recent gains to recent losses on a 0-100 scale and is designed to flag overbought conditions above 70 and oversold conditions below 30. Stochastic oscillators plot the current close relative to the recent price range, also on a 0-100 scale, and react faster than RSI. ADX quantifies trend strength without direction, on a 0-100 scale where readings above 25 indicate a strong trend.
Most traders use MACD alongside one of these rather than in isolation. A common pairing is MACD for direction plus RSI for timing entries within that direction, or MACD for signals plus ADX as an on-off filter for whether to act on those signals at all.
Frequently Asked Questions
What is the difference between the MACD line and the signal line?
The MACD line is the raw difference between the 12-period and 26-period exponential moving averages of price. The signal line is a 9-period exponential moving average of the MACD line itself, not of price. Because the signal line averages the MACD line, it lags slightly, and that lag is what produces the crossovers traders use as buy or sell triggers.
How do you identify a bullish MACD crossover and what does it mean for trading?
A bullish MACD crossover occurs when the MACD line crosses from below to above the signal line. It signals that short-term momentum is turning upward relative to the recent trend. Many traders take it as a long entry trigger, but the signal is stronger when it happens while the MACD line is already above zero, confirming that the broader trend supports the direction of the crossover.
Why does MACD fail in ranging or sideways markets?
In a ranging market, price oscillates around its moving averages instead of trending, so the 12-period and 26-period EMAs constantly cross each other. That produces rapid alternating MACD crossovers with no follow-through, known as whipsaws. Filtering MACD signals with ADX, and only trading MACD when ADX is above 25, avoids most of these false triggers.
Can you use MACD on crypto and forex charts, and do the settings change?
MACD works on any liquid market with continuous price history, including major forex pairs and large-cap crypto. The default (12, 26, 9) settings hold up well on daily and 4-hour charts across both. Because crypto is more volatile than most forex pairs, some traders lengthen the parameters on crypto to reduce noise, or shorten them on lower timeframes where they want faster response.
What is MACD divergence and how do traders use it to predict reversals?
MACD divergence appears when price and the MACD line move in opposite directions at a swing high or low. Bullish divergence means price prints a lower low while MACD prints a higher low, hinting at a possible upside reversal. Bearish divergence is the mirror image. Traders wait for confirmation, such as a broken trendline or a candlestick reversal at support or resistance, before acting on it.
About the authors


Related articles
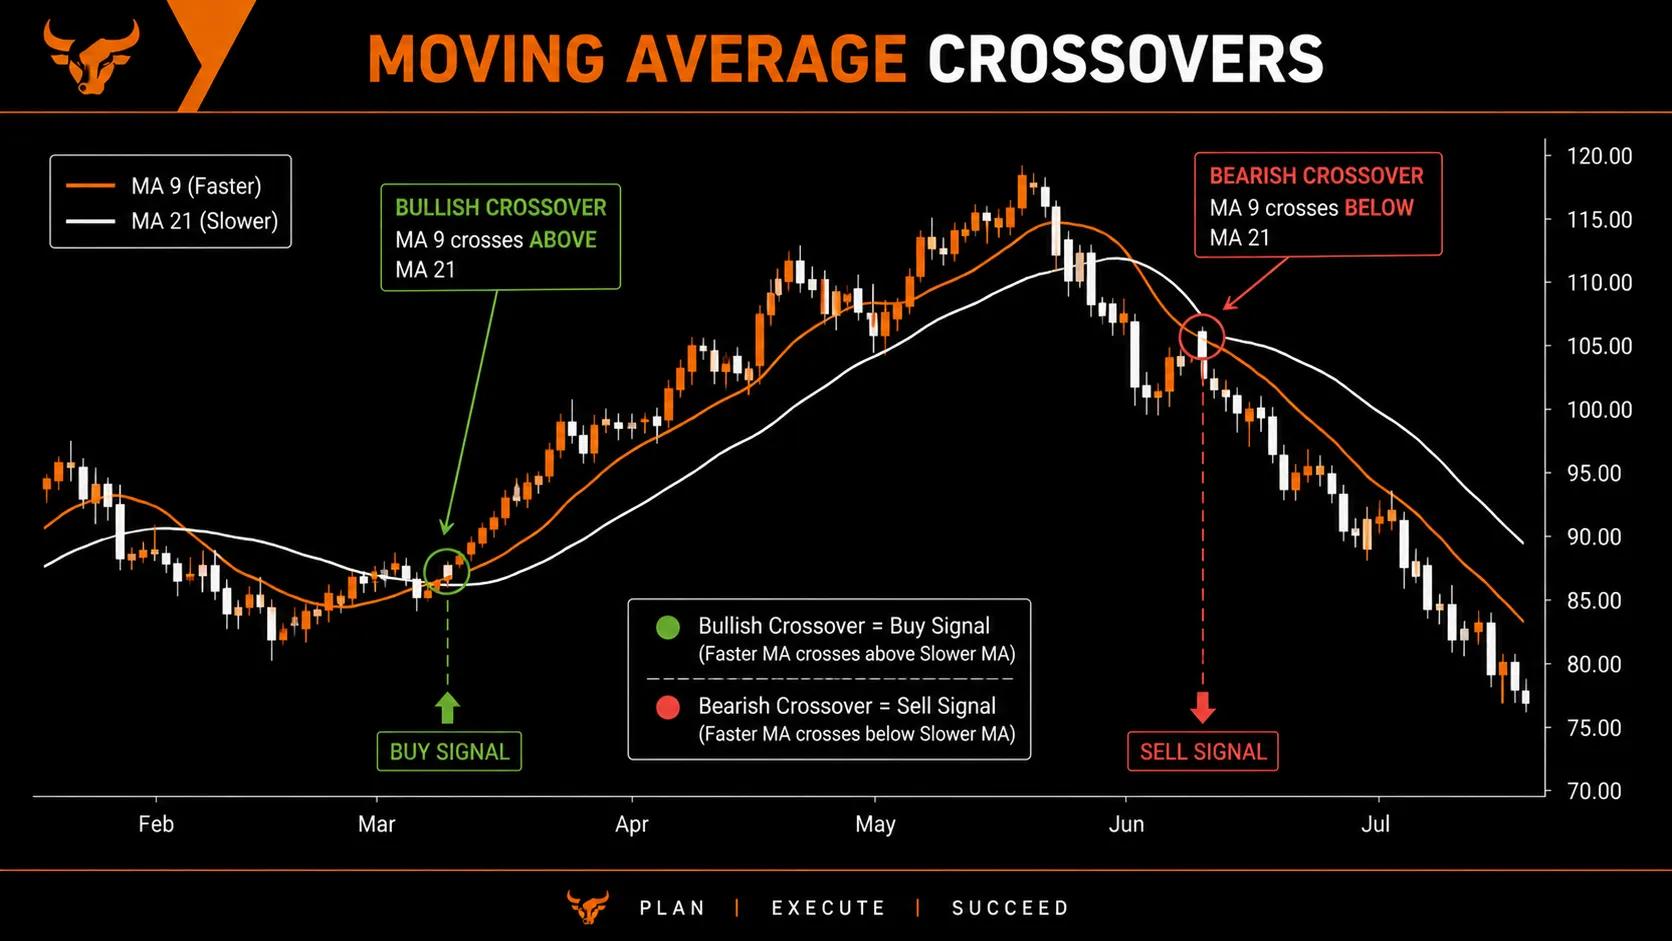
Moving Averages Explained: SMA, EMA, and How Traders Use Them
Moving average trading explained simply. Learn how SMA and EMA work, how to read crossovers, and how traders use them to spot trends and time entries.
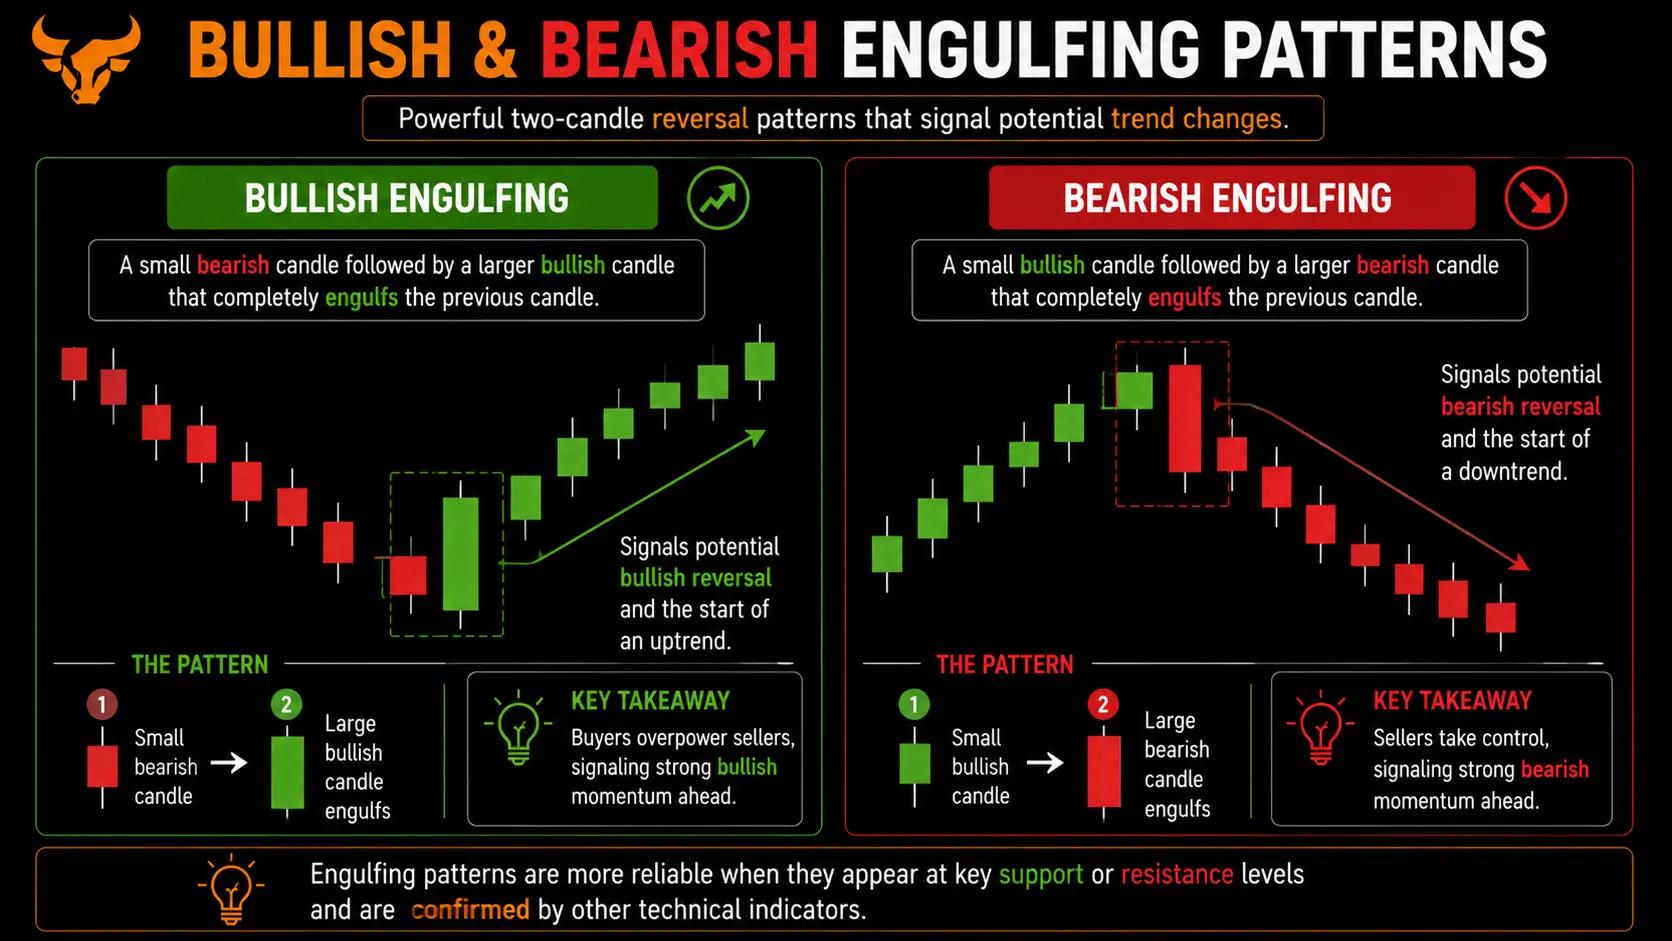
Candlestick Patterns Explained: A Practical Visual Guide
Candlestick patterns explained for new traders: read doji, hammer, and engulfing signals with clear visual chart examples.

Bollinger Bands explained: how to read and trade this volatility indicator
A trader-focused guide to Bollinger Bands: how the three lines are built, what band touches really mean, and how to avoid the mistakes that trap retail traders.
0 comments