



Technical Analysis · Beginner · 8 min read
Buy Side and Sell Side Liquidity: How to Read and Trade It
The smallest pools that move the biggest prices
Buy side and sell side liquidity refers to the concentration of pending buy and sell orders at specific price levels, typically clustered around swing highs and swing lows where retail traders place stop losses.
These pools attract institutional traders because they represent predictable exit points and entry opportunities. Reading where liquidity sits on your chart is the foundation of understanding institutional order flow.
A stop loss (an order that closes a position at a preset price to cap losses) is the raw material of these pools. When many traders place stops in the same neighbourhood, that cluster becomes a target: filling those orders is how a large buyer or seller gets size done without chasing price.
Understanding how liquidity spreads and slippage affect execution helps you anticipate how these pools will behave when price approaches them.
Choosing where to trade matters as much as the strategy; see the best forex brokers and their conditions.
Why buy-side and sell-side liquidity sit in different places
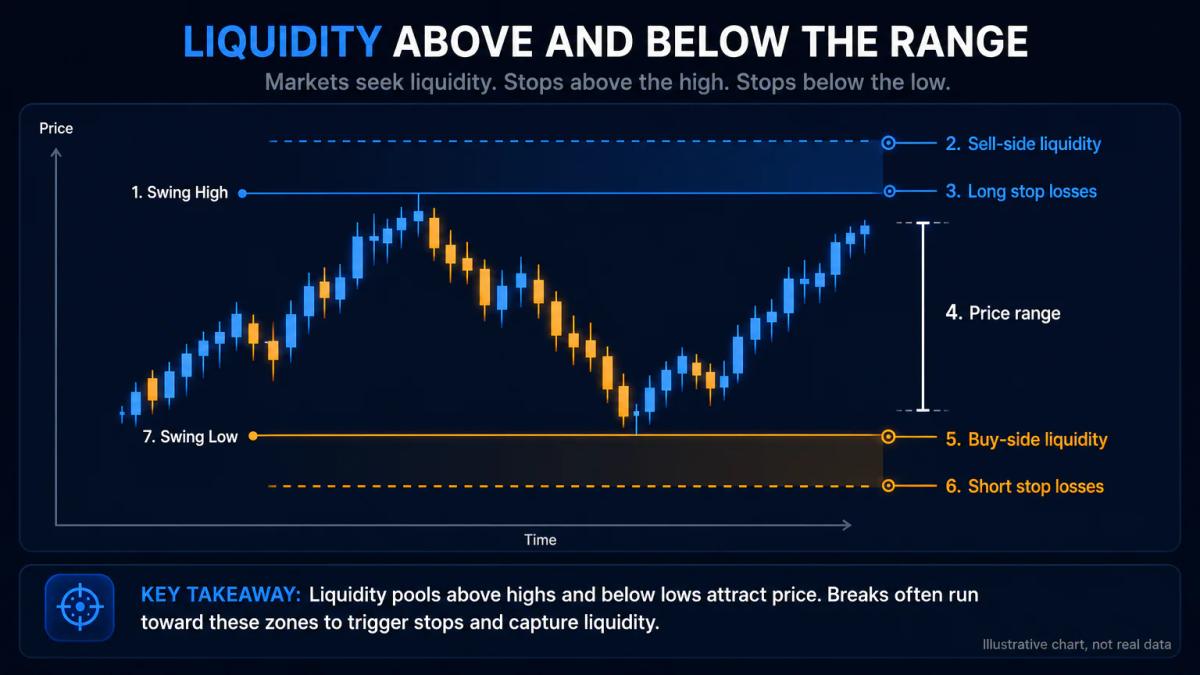
Buy-side liquidity accumulates below price action, at swing lows and support levels where short sellers park their stops. Sell-side liquidity pools above price, at swing highs and resistance levels where long positions keep their stops.
The naming follows order-book logic: a stop above a long position is a market sell (it feeds sell-side liquidity for someone else to buy into), and a stop below a short is a market buy (feeding buy-side liquidity).
Retail traders defend losing trades by placing stops just beyond recent extremes, because those extremes look like the point where the setup is wrong. The behaviour is consistent enough that the zones become mapped in advance by desks running execution algorithms.
A swing high is simply a candle whose high is higher than the candles either side of it; a swing low is the mirror. Mark those, and you have marked the raw liquidity map. The rest of this article works with that map.
How to spot liquidity zones on your chart
Open a clean chart on a 1-hour or 4-hour timeframe and mark the highest and lowest points over the last 20 to 40 candles. Extend a thin horizontal line through each.
Buy-side liquidity sits just below every swing low; sell-side liquidity sits just above every swing high. You are drawing the ceiling and floor of the recent range, then asking where retail stops are most likely piled up.
Strong zones share three traits.
- First, they are equal or near-equal highs (or lows) side by side: two swing highs within a few pips of each other create a magnet, because stops cluster twice at the same price.
- Second, they sit at round numbers (1.1000 on EUR/USD, £100 on a UK stock) where humans anchor decisions.
- Third, they align with obvious structure such as a prior day high, a session open, or a moving average.
Learning to identify market trends and structural support strengthens your ability to spot zones that will persist.
Once marked, watch how price behaves when it returns. A zone that price pierces briefly and then rejects with a large opposing candle is the textbook signal that the pool has been swept. A zone that price grinds through slowly, closing on the other side, is broken structure rather than a sweep.
Reading the signal: what liquidity tells you about price direction
A sweep is a fast wick through a marked zone followed by an aggressive close back inside the prior range. When price sweeps buy-side liquidity below a swing low and reverses upward, it usually means institutions have filled buy orders against the retail stops, cleared the pool, and can now push price higher with less overhead supply. A sweep of sell-side liquidity above a swing high often precedes a decline for the mirror reason.
Two details filter noise.
- Speed: the sweep candle should stand out visually, closing well back into the range rather than settling on the extreme.
- Follow-through: within one to three candles after the sweep, price should move decisively away from the zone. If it stalls at the zone, the read is weak and the setup is not there.
A sweep at a daily high inside a strong uptrend often just refuels the trend rather than reversing it. Sweeps are most reliable at range extremes or after an extended move into an obvious pool.
Trading liquidity zones: entry, exit, and risk management
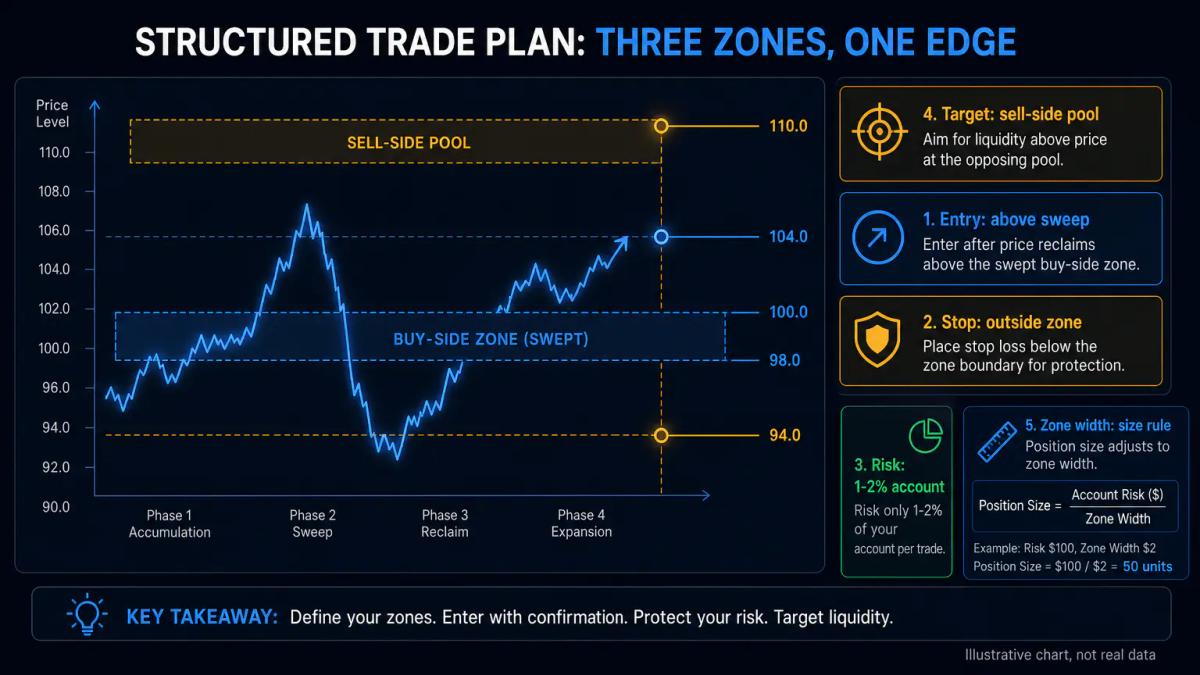
A basic liquidity trade is a three-part plan: enter after the sweep, place the stop beyond the zone (never inside it), and target the next opposing pool. Position size is a function of the distance between entry and stop, and you cap risk at 1% to 2% of account equity per trade. Wider zones mean smaller size, not looser risk.
| Element | Buy-side sweep (long setup) | Sell-side sweep (short setup) | Risk rule |
|---|---|---|---|
| Entry | After a wick below the swing low and a close back inside the range | After a wick above the swing high and a close back inside the range | Wait for the sweep candle to close; no anticipatory entries |
| Stop loss | Below the sweep wick, outside the buy-side zone | Above the sweep wick, outside the sell-side zone | Stop distance sets position size, not the other way round |
| Take profit | Next sell-side pool above (prior swing high, round number) | Next buy-side pool below (prior swing low, round number) | Partial exit at 1R, remainder trails to the target |
| Max risk | 1% to 2% of account equity | 1% to 2% of account equity | Skip the trade if the stop is so wide the minimum lot exceeds the risk cap |
According to the FCA, the majority of retail CFD accounts lose money, so account survival matters more than any single trade. Under FCA rules, UK retail clients face leverage caps of 30:1 on major forex pairs, 20:1 on major indices, and 5:1 on individual equities, and CFDs on crypto assets are banned for UK retail. Those caps limit how much size a wide liquidity stop can support, which is a feature, not a constraint to route around.
Why liquidity dynamics differ across forex, equities, and crypto
Forex trades 24/5 across a decentralised network of banks and brokers, so a liquidity zone that holds during the London session may break in New York simply because different participants are active. Equities trade on centralised exchanges with tighter spreads and consolidated order books, so liquidity clusters more predictably at round prices, prior day highs and lows, and the opening range.
Understanding how stocks and indices differ in risk and trading costs helps you adjust your liquidity strategy across asset classes.
Crypto is the outlier. Liquidity is fragmented across dozens of venues, volatility is higher, and zones form and dissolve within hours rather than days. The underlying idea (stops cluster at extremes, and large players hunt those clusters) still applies, but the persistence of any given zone is shortest in crypto and longest in liquid equities.
Common mistakes when trading liquidity zones
The most frequent error is trading every marked zone. Most zones are never swept, and of those that are swept, only a fraction produce a clean reversal. Waiting for the sweep candle to close, and for follow-through in the next one to three candles, filters out the majority of losing setups.
The second mistake is placing the stop inside the zone. If the zone runs from 1.1000 to 1.0995 and your stop is at 1.0998, you get stopped out by the very sweep you meant to trade. The stop belongs outside the zone by a margin large enough to survive normal wick behaviour on your timeframe.
The third is ignoring structure: a liquidity pool at a daily support that has held three times is not comparable to a pool at a minor 15-minute swing. The fourth is failing to scale size to stop width, which turns a 1% risk plan into a 3% risk trade the moment the zone is wide. Avoiding these errors is part of broader leverage trading mistakes that blow accounts.
FCA: UK retail clients trading CFDs face maximum leverage of 30:1 on major forex pairs, 20:1 on major indices, and 5:1 on single-name equities, with CFDs on crypto assets prohibited for retail. The majority of retail investor accounts lose money when trading CFDs, which is why per-trade risk caps and stop discipline matter more than entry precision.
Frequently Asked Questions
What is the difference between buy-side and sell-side liquidity?
Buy-side liquidity is the pool of buy orders (mostly stop losses from short sellers) resting below price, at swing lows and support. Sell-side liquidity is the pool of sell orders (mostly stops from long positions) resting above price, at swing highs and resistance. The label describes which side of the order book the resting orders fill, not the direction traders expect price to move.
How do I identify buy-side and sell-side liquidity on a price chart?
Mark the swing highs and swing lows over the last 20 to 40 candles on a 1-hour or 4-hour chart. Draw a thin horizontal line just above each swing high (sell-side pool) and just below each swing low (buy-side pool). Prioritise equal highs, equal lows, round numbers and levels aligned with prior day extremes, because stops cluster densest there.
Why do institutional traders target liquidity zones?
Large orders need counterparties. A cluster of resting stop losses is a pre-filled book of counterparties at a known price, so a desk can execute size against those stops with less slippage than by walking a thin book. This is order-flow logic, not conspiracy: it is simply where the volume sits.
Can I trade buy-side and sell-side liquidity on all timeframes?
Yes, but reliability rises with timeframe. On a 5-minute chart, zones form and are swept within a session and produce many false signals. On a 4-hour or daily chart, zones persist for days or weeks and sweeps are cleaner. Beginners are better served by higher timeframes until sweep recognition becomes automatic.
What is the relationship between liquidity sweeps and market reversals?
A sweep clears resting orders at an extreme and often removes the immediate supply or demand blocking a move in the opposite direction. That is why sweeps frequently precede reversals. However, not every sweep reverses: sweeps in the middle of strong trends often just refuel the trend, so context and follow-through matter more than the sweep candle alone.
About the authors


Put this into practice
Brokers we have reviewed
Scored on the same five dimensions. Here are three of them — the full list is on the brokers page.



Related articles

Chaikin Volatility Indicator: How to Read Expansion and Contraction Signals
A plain-English guide to the Chaikin Volatility Indicator: how it is built, what expansion and contraction mean, and how to combine it with ATR, RSI and volume.

Consolidation in Trading: What It Is and How to Trade It
A plain-English guide to consolidation in trading: why price goes sideways, which patterns are worth knowing, and how to trade the eventual breakout without getting whipsawed.

Continuation vs. Reversal Patterns: How to Tell Them Apart and Trade Them
A beginner-friendly guide to continuation vs reversal patterns: definitions, worked examples, stop placement, profit targets, timeframes and indicator confirmation.
0 comments