



Technical Analysis · Intermediate · 7 min read
How to Identify Market Trends: A Practical Technical Analysis Guide
A market trend is the prevailing direction of an asset's price over a defined period, identified through price action, support and resistance levels, and technical indicators. To identify market trends, you read the sequence of swing highs and lows, confirm slope with a moving average, and validate strength with a trend indicator such as ADX before committing capital.
How to identify market trends: definition and core mechanics
A trend exists when price prints a repeatable structure of swings in one direction. An uptrend forms a series of higher highs and higher lows; a downtrend prints lower highs and lower lows; a sideways market oscillates between horizontal support (a price floor buyers defend) and resistance (a price ceiling sellers defend). Charles Dow described this structural definition in the original Dow Theory writings, and it still underpins modern technical analysis.
Identifying the structure early is important because it decides which side of the order flow you sit on. If you buy inside a confirmed uptrend, pullbacks act as entries. If you buy inside a downtrend, the same pullbacks are traps. The mechanics are straightforward: mark the last three swing points on the chart, connect them, and check whether each successive point is higher, lower, or flat compared with the previous one. That single exercise decides the trade thesis before any indicator is loaded.
Choose a broker with strong charts among the best forex & CFD brokers.
Three trend types and how to spot each one
Markets move in three regimes, and each demands a different playbook.
- Uptrends print rising peaks and troughs and reward buying pullbacks toward a rising moving average.
- Downtrends print falling peaks and troughs and reward selling rallies into resistance.
- Sideways markets, also called ranges, oscillate between horizontal support and resistance and reward mean-reversion tactics rather than breakout entries.
The fastest way to classify the regime is a two-step visual check on a clean chart with no indicators. First, look at the last five swing points: are they stepping up, stepping down, or flat. Second, overlay a 50-period simple moving average and read its slope.
| Trend type | Structure | Moving average slope | Preferred tactic |
|---|---|---|---|
| Uptrend | Higher highs, higher lows | Rising | Buy pullbacks |
| Downtrend | Lower highs, lower lows | Falling | Sell rallies |
| Sideways | Flat swings inside a band | Flat | Fade the extremes |
Mismatching the tactic to the regime is the most common reason retail trend trades lose money.
Price action and chart patterns for trend confirmation
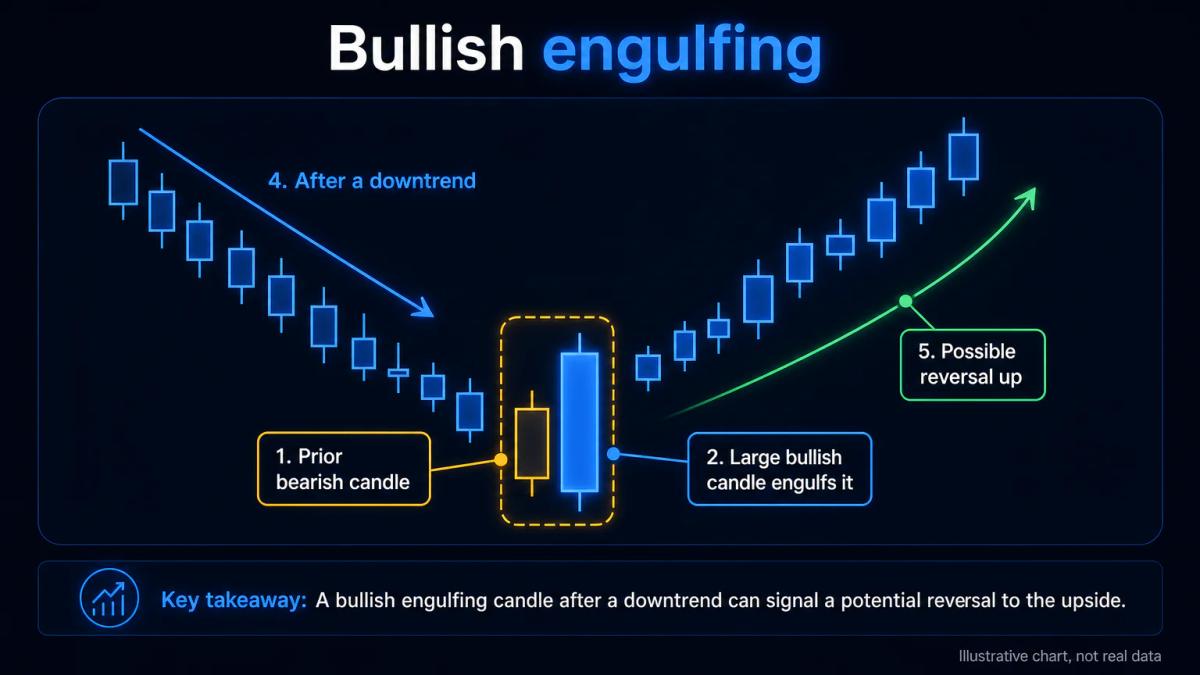
Price action analysis reads how price moves without relying on indicators: you interpret candlestick patterns, breakouts from support and resistance, and the slope of swing highs and lows to confirm trend direction. A candlestick (a price bar showing open, high, low and close for a period) that closes decisively beyond a prior swing point is the cleanest confirmation available, because it reflects a real shift in order flow rather than a lagging calculation.
Continuation patterns add a second layer of confidence. Flags and pennants (short consolidations that lean against the prevailing trend) usually resolve in the direction of the underlying move. Ascending and descending triangles mark accumulation or distribution against a horizontal level, and channels contain the trend inside two parallel lines that you can use as dynamic entry zones.
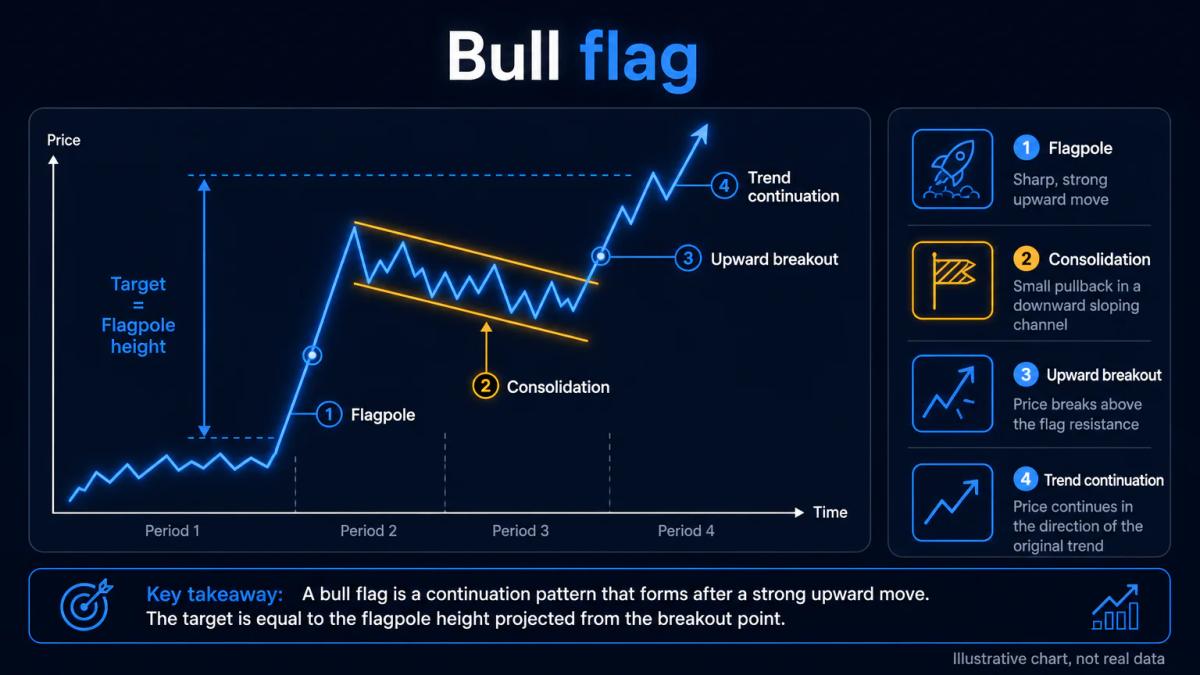
The test for a valid pattern is context. A bull flag inside a confirmed uptrend, formed after a strong impulse leg, has statistical weight. The same pattern printed inside a range or against a higher-timeframe downtrend is noise. Combining structure (higher highs and higher lows), a defined pattern, and a decisive breakout close is what separates a trend confirmation from a hopeful guess.
Technical indicators that identify and confirm trends
Moving averages smooth price into a single line that reveals slope. A simple moving average (SMA) weights all periods equally; an exponential moving average (EMA) weights recent prices more heavily and reacts faster. When a fast EMA crosses above a slow EMA and both slope upward, the reading confirms an uptrend; the mirror image confirms a downtrend.
Momentum and strength tools sit on top of that base. The MACD indicator tracks the distance between two EMAs and warns of momentum shifts. The RSI indicator measures the speed of recent gains against recent losses on a 0 to 100 scale. The Average Directional Index (ADX) measures trend strength on the same 0 to 100 scale; readings above 25 are traditionally used as a threshold for a trending market, while readings below 20 suggest a range.
| Indicator | What it measures | Trend use |
|---|---|---|
| 50/200 SMA | Long-term direction | Golden or death cross |
| 20 EMA | Short-term slope | Pullback entries |
| MACD | Momentum divergence | Early reversal warning |
| ADX | Trend strength | Filter ranges |
No single indicator identifies trends alone. Stacking a slope reading, a momentum reading, and a strength filter reduces the false signals that dominate choppy conditions.
Timeframe selection and multi-timeframe trend analysis
A trend on the 4-hour chart may not exist on the 15-minute chart, so the timeframe you analyse must match your holding period. Swing traders holding positions for days work from the daily and 4-hour charts. Intraday traders holding for hours work from the 1-hour and 15-minute charts. Scalpers holding for minutes work from the 5-minute and 1-minute charts.
Multi-timeframe analysis stacks two or three charts to align direction with timing. The standard approach uses a higher timeframe for context (identify the dominant trend), an intermediate timeframe for setup (locate a pullback or pattern), and a lower timeframe for execution (time the entry with a candlestick trigger). A useful rule of thumb is a ratio of roughly four to six between adjacent timeframes: daily, 4-hour, 1-hour works cleanly.
This stack cuts whipsaws because it forces you to trade with the higher-timeframe order flow. Ignoring it is why intraday breakouts fail against a daily downtrend.
Behavioural and psychological factors in trend reversals
Trends reverse when sentiment shifts, and sentiment shifts before price breaks structure. The tells are visible on the chart if you know what to look for. Momentum divergence, where price prints a new high but RSI or MACD prints a lower high, signals that fewer participants are pushing the move. Rising volume on counter-trend candles suggests that late buyers are being absorbed by larger sellers.
News catalysts and scheduled macro data, tracked on any economic calendar, are the usual triggers. A trend that has run for weeks often reverses on a central bank decision or a surprise inflation print. Watching how price reacts to these events, rather than the headline itself, is what informs the read: an uptrend that fails to make a new high on bullish news is telling you the buyers are exhausted.
Risk management strategies for trend-following trades
Risk management is what turns a trend read into a survivable strategy. In an uptrend, place your stop loss (an automatic exit that closes the trade at a defined loss) below the most recent swing low; in a downtrend, above the most recent swing high. Placing stops inside the noise of the current candle gets you stopped out by ordinary pullbacks.
Size the position so that the distance between entry and stop equals no more than 1 to 2% of account equity. If the trend extends, a trailing stop that follows each new swing point locks in profit without capping the upside. UK retail traders using CFDs on major forex pairs are capped by the FCA at 1:30 leverage, and equity CFDs at 1:5, which naturally constrains position sizing on trend trades.
Common mistakes when identifying market trends
The most frequent error is confusing noise with trend. A 20-pip move on EUR/USD inside a range is not a breakout; it is a fluctuation. Waiting for a confirmed close beyond the prior swing point, ideally on the higher timeframe you selected, filters most of these false starts.
The second recurring error is indicator overload. Six oscillators on one chart do not add six independent votes; they largely repeat the same momentum reading. A cleaner setup is one slope tool, one momentum tool, and one strength filter, applied to a chart with clearly marked structure.
Frequently Asked Questions
What is the difference between a trend and a pullback or correction?
A trend is the dominant direction across multiple swings, while a pullback is a short counter-move inside that trend that does not break the prior swing low (in an uptrend) or swing high (in a downtrend). Once price breaks that structural level, the pullback graduates into a correction or a full reversal.
How long does a trend typically last before reversing?
There is no fixed duration. Intraday trends can last minutes to hours, swing trends several days to weeks, and primary trends on the daily and weekly charts often run for months. Duration matters less than structure: a trend is alive until the sequence of swing points breaks, regardless of how much time has passed.
Can you identify a trend on a 5-minute chart, or do you need a longer timeframe?
You can identify a trend on any timeframe, but a 5-minute trend has a short lifespan and is more prone to reversal on news or spread widening. Scalpers work with 5-minute trends; anyone holding beyond a session should confirm with the 1-hour or 4-hour chart to avoid trading against the dominant flow.
What indicator is best for identifying trends: moving averages, MACD, or ADX?
Each answers a different question. Moving averages show direction and slope, MACD flags momentum shifts and divergences, and ADX quantifies trend strength so you can filter out ranges. Using them together is more reliable than picking a single winner; ADX above 25 combined with a rising 50 EMA is a common trend filter.
How do you know when a trend is about to reverse?
Look for a cluster of signals rather than one: momentum divergence between price and RSI or MACD, rising volume on counter-trend candles, failure to print a new high or low, and a break of the most recent swing point. Reversals confirmed by only one of these are frequently false.
About the authors


Put this into practice
Brokers we have reviewed
Scored on the same five dimensions. Here are three of them — the full list is on the brokers page.



Related articles

Leading Stock Indicators: How to Spot Trend Reversals Early
A plain-English guide to leading stock indicators: what they are, how RSI, Stochastic, MACD and volume tools work, and how to trade them without getting whipsawed.

MACD Indicator Explained: How to Read Signals and Trade Trends
A retail trader's guide to the MACD indicator: how it is built, what its signals mean, where it fails, and how to combine it with other tools.

Morning Star Pattern: How to Spot and Trade This Reversal Setup
A practical guide to reading the morning star candlestick reversal, sizing trades against its middle candle, and filtering the false signals that trap beginners.
0 comments