Trading Basics · Intermediate · 8 min read
Position Sizing in Trading: How to Calculate Risk Per Trade
Position sizing is the practice of deciding how many units to trade based on your account equity, your stop-loss distance, and the percentage of capital you accept to lose. It is the single most important lever in risk management: a commonly cited retail benchmark is to risk about 2% of account value per trade, so a $10,000 account risks no more than $200 on any position.
What Is Position Sizing and Why Does It Matter?
Position sizing determines the number of units, shares or lots (a lot is a standardised trading quantity, typically 100,000 units of the base currency in forex) you buy or sell on a given trade. It is the primary tool separating traders who survive drawdowns from those who blow up their accounts. By capping capital at risk on each idea, you preserve the mathematical ability to recover from losses and compound gains over time.
According to QuantInsti (2025), a widely cited retail benchmark is to risk about 2% of total account value per trade, so a $10,000 account risks no more than $200 on a single position. That ceiling is about ensuring no individual trade can meaningfully damage your capital base. Without a sizing rule, even a correct strategy can be ruined by one oversized loss. Understanding how to choose the right broker is equally critical, as platform stability and order execution quality directly affect whether your sizing rules are honoured.
QuantInsti, 2025: Account risk refers to the amount of the total account value that you are willing to lose on a single trade, typically expressed as a percentage. A commonly cited retail benchmark is to risk about 2% of total account value per trade, meaning a $10,000 account should not risk more than $200 on a single position.
The Fixed Fractional Method: The Most Common Approach
The fixed fractional method calculates position size by dividing a fixed percentage of your account equity by the monetary risk of the trade. Each position then scales with account growth, and losses stay proportional to capital. The formula is compact and disciplined, which is why it dominates retail risk frameworks.
According to Adaptrade Software (2015), the fixed fractional formula is N = f x Equity / |Trade Risk|, where f is a fraction between 0 and 1 (for example, 0.05 (5%) for a 5% risk fraction) and |Trade Risk| is the per-unit distance between entry and stop. If equity is $20,000, f is 0.02 and the per-share risk is $2, then N = 0.02 x 20,000 / 2 = 200 shares.
The method has two structural advantages competitors of this article rarely spell out. First, it is self-correcting: as equity falls during a losing streak, position size automatically shrinks, dampening the drawdown. Second, it works across asset classes, from stocks priced in dollars to CFDs (contracts for difference, which mirror the underlying price without transferring ownership) priced per pip. This flexibility makes it ideal whether you trade forex or crypto markets.
How to Calculate Position Size: A Step-by-Step Example
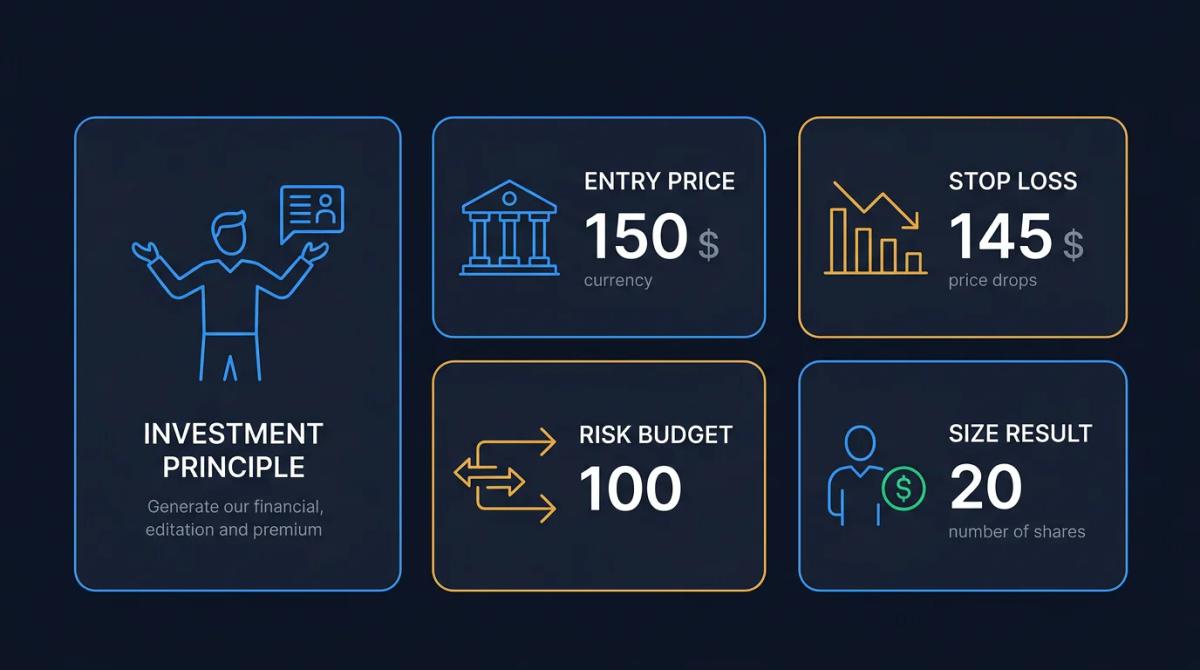
To calculate position size, identify three inputs: entry price, stop-loss level, and the pound or dollar amount you accept to lose. Then divide the risk amount by the per-unit distance between entry and stop.
According to TradingSim (2026), on a $10,000 account risking 1% ($100) with an entry at $150 and a stop at $145, the per-share risk is $5. Dividing $100 by $5 gives 20 shares. If the stop is hit, the loss is capped at $100, exactly 1% of equity.
The same logic extends beyond equities. For a forex pair where a pip (the smallest standard price increment, usually the fourth decimal) is worth $10 per standard lot, a 25-pip stop and $100 risk budget imply 0.4 lots. For a bitcoin CFD, replace pip value with dollar move per contract. The formula is identical; only the unit changes.
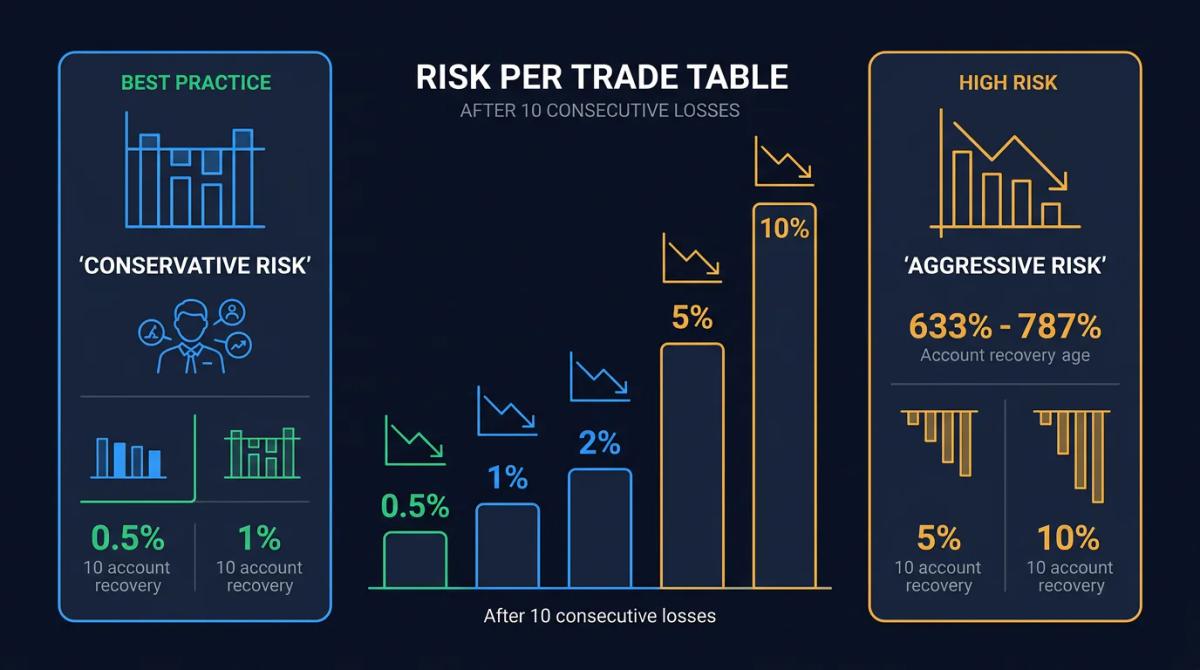
TradingSim, 2026: If you risk 5% per trade and take 10 losses in a row, you're down roughly 41% of your account. On a $10,000 account risking 1% ($100) with an entry at $150 and a stop at $145, the trader buys 20 shares, capping the loss at $100 if the stop is hit.
Risk Per Trade: The 1-2% Rule and Its Alternatives
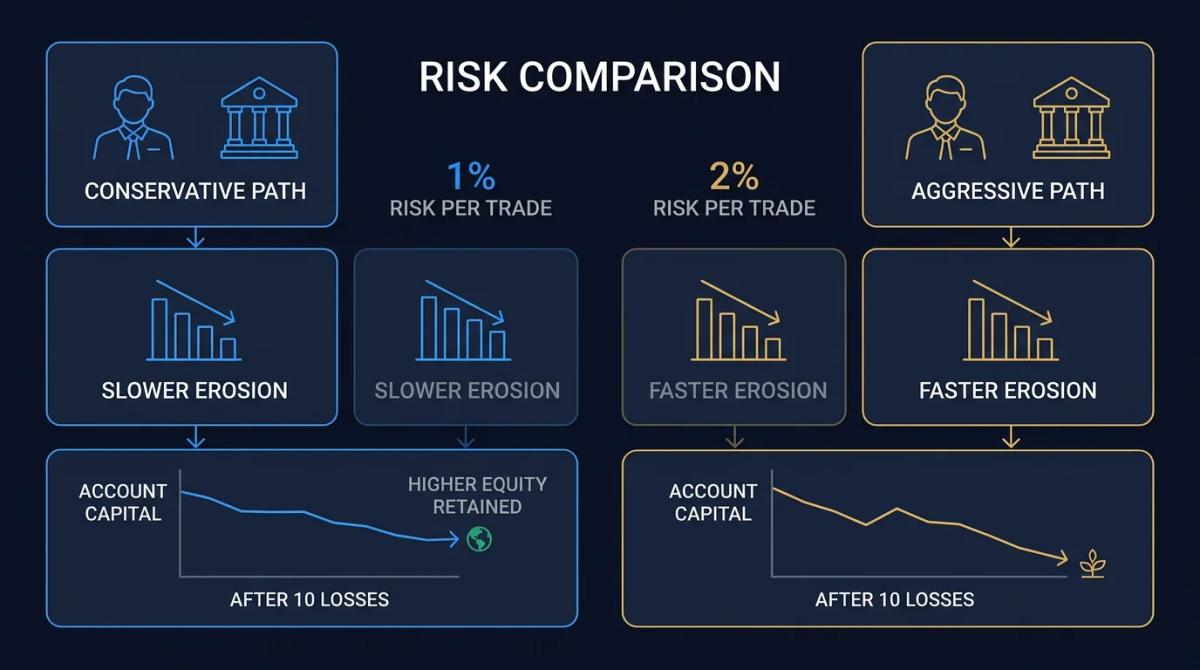
Professional traders typically risk between 1% and 2% of total account equity per trade. This conservative envelope ensures a ten-trade losing streak does not crater the account and leaves capital intact for recovery.
According to TradingSim (2026), professionals target 1-2% because the recovery mathematics remain manageable. Beginners and traders sizing volatile instruments such as small-cap stocks or altcoin CFDs typically anchor at 0.5-1%. A hidden benefit of the 1-2% cap is psychological: the loss on any single trade is small enough that you stay analytical rather than reactive after a stop-out.
TradingSim, 2026: Professional traders typically risk 1-2% of their account per trade, ensuring that a 10-trade losing streak does not crater the account.
The Kelly Criterion: A Mathematical Approach to Position Sizing
The Kelly Criterion is a formula that calculates the optimal fraction of capital to risk based on historical win rate and win-loss ratio. It maximises long-term geometric growth but often recommends aggressive sizes. Many traders preparing for prop firm challenges study Kelly as a theoretical benchmark before learning why it rarely works in practice.
According to QuantInsti (2025), the formula K% = W - (1 - W) / R applied to a 60% win rate and a 1.74 win-loss ratio recommends exposing 37% of capital to the next trade. That number rarely survives contact with a real drawdown, which is why most practitioners use half-Kelly or quarter-Kelly. Kelly also assumes stable, known probabilities; live markets provide neither, so treat the output as a ceiling, not a target.
QuantInsti, 2025: A disadvantage of the Kelly criterion is that it reduces the size of your position during losing streaks, which can be psychologically difficult, and it assumes you know your true win rate and win-loss ratio with certainty.
Adjusting Position Size During Drawdowns and Volatility
When the account draws down or volatility spikes, cutting position size protects you from forced liquidation and reactive decisions. Institutional desks formalise this with tiered protocols instead of leaving it to feel.
According to the International Trading Institute (2025), a three-tiered drawdown protocol cuts per-trade risk by 25% after a 5% equity drawdown, by 50% after a 10-15% drawdown, and halts trading for 24 to 72 hours after a drawdown greater than 15%. A parallel volatility rule reduces risk per idea by 25-50% when the 14-day ATR (average true range, a measure of typical daily movement) rises above its 6-month median.
This is a gap most competing guides skip. Retail traders inherit fixed-percentage rules but rarely automate the de-risking layer above them. In practice, size should be a function of both equity and current volatility regime. For crypto and small-cap CFDs, tighten the tiers further: consider halving at 3% drawdown and halting at 10%, given overnight gap risk.
International Trading Institute, 2025: Down 5% from recent high, risk per trade minus 25%. Down 10-15%, risk per trade minus 50%. Down 15%, halt trading. A risk-reward ratio of 1:3 to 1:5 is typical for institutional traders managing drawdown tiers.
Common Position Sizing Mistakes and How to Avoid Them
The most damaging mistake is risking too much per trade. Other errors include ignoring volatility, failing to rescale as the account grows, and overriding sizing rules under emotional pressure.
According to TradingSim (2026), risking 1% per trade means ten consecutive losses reduce the account by about 10%, while risking 10% per trade reduces the same account by 65% and demands a 186% return to reach breakeven. The asymmetry is what kills accounts: gains compound arithmetically, but drawdowns compound against you geometrically. Learning to manage emotions like greed and impatience is essential to enforcing your sizing discipline when the market tempts you to override it.
A practical enforcement layer: pre-compute your position size before entry, log it, and let the platform's order ticket reject anything larger. Traders running multiple concurrent strategies should also cap portfolio-level risk (typically 6% aggregate open risk) so correlated positions cannot combine into a single oversized bet.
Frequently Asked Questions
What percentage of my account should I risk per trade?
Most professionals risk 1-2% of account equity per trade. According to TradingSim (2026), this range keeps a ten-loss streak recoverable. Beginners and traders on volatile instruments such as small-cap stocks or crypto CFDs typically anchor at 0.5-1%.
How do I calculate position size if I know my entry, stop loss, and risk amount?
Divide your monetary risk by the per-unit distance between entry and stop. On a $10,000 account risking 1% ($100) with entry at $150 and stop at $145, the per-share risk is $5, so you buy 20 shares (TradingSim, 2026).
Should I use the Kelly Criterion or the 1-2% rule for position sizing?
For most retail traders, the 1-2% rule is safer. The Kelly Criterion can recommend 37% exposure on a 60% win rate with a 1.74 win-loss ratio (QuantInsti, 2025), which is too aggressive when true probabilities are unknown. If you use Kelly, run half-Kelly or quarter-Kelly.
How does position sizing change when market volatility increases?
According to the International Trading Institute (2025), a common rule cuts risk per idea by 25 to 50% when the 14-day ATR rises above its 6-month median. This keeps dollar risk stable when price ranges expand.
What happens to my account if I risk 10% per trade instead of 1%?
At 1% per trade, ten consecutive losses reduce the account by about 10%. At 10% per trade, the same streak reduces the account by 65% and requires a 186% return to break even (TradingSim, 2026). Larger risk fractions compound losses geometrically.
About the authors


Related articles
Questions to Ask Before Opening a Trading Account
A structured checklist of key questions to ask any broker before you deposit -- covering regulation, fund safety, fees, execution, and red flags.
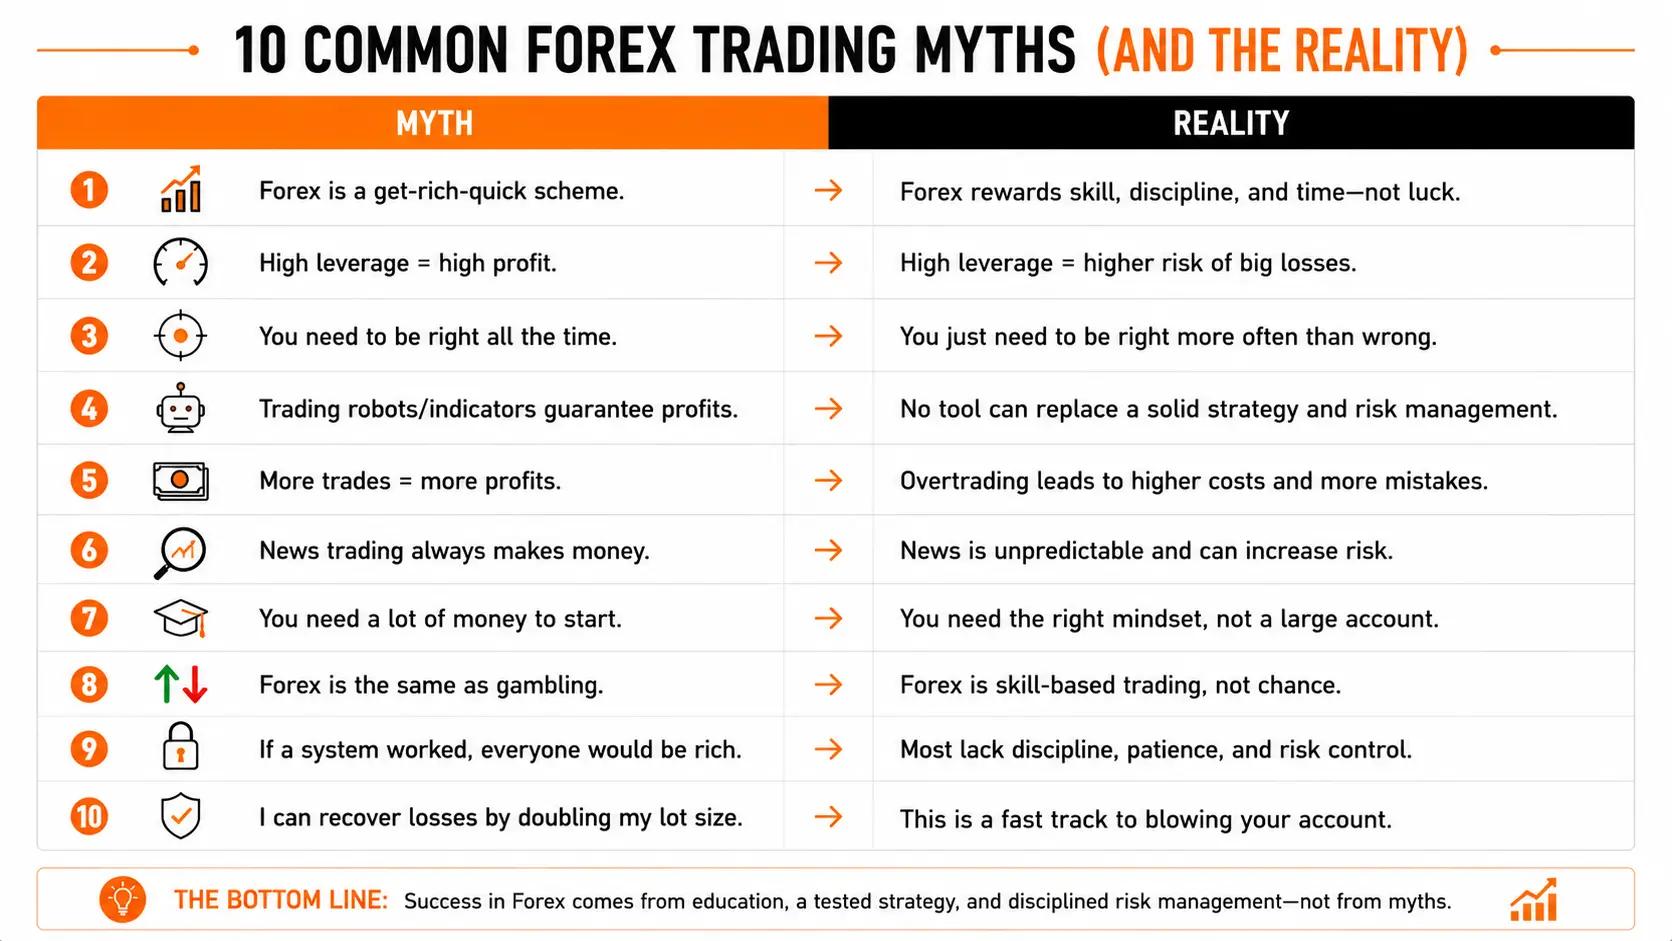
10 Forex Trading Myths That Are Costing You Money
From leverage to signal services, these 10 forex trading myths cost retail traders real money. Here's what the evidence actually shows.
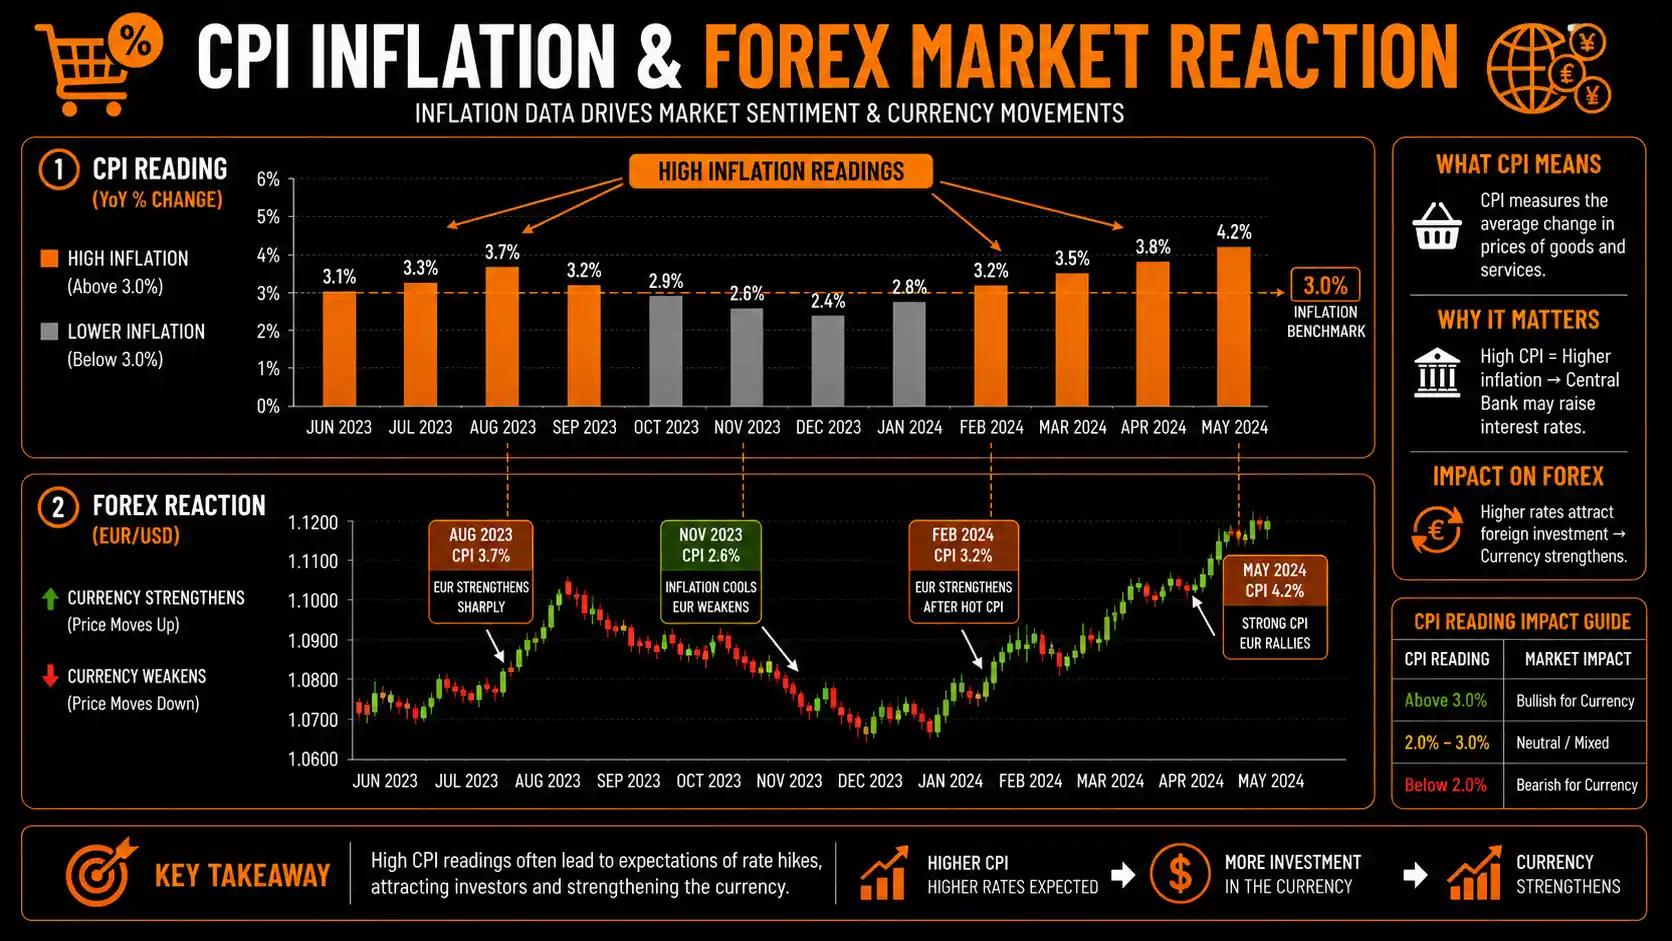
What Is Fundamental Analysis? How Economic Data Moves Currency Markets
Learn how fundamental analysis works in forex: how interest rates, inflation, jobs, and GDP data move currencies, and how to read the economic calendar.
0 comments