Multiple Timeframe Analysis: The Complete Trading Guide
Multiple timeframe analysis (MTF analysis) is a structured method of examining the same instrument across two or more timeframes before making a trade decision.
Instead of basing your entry on a single chart, you layer information from higher and lower timeframes to confirm directional bias, identify structure, and sharpen your timing. Think of it like planning a road trip: you check the country map for the overall route, the regional map for highways and turns, and the local map for street-level navigation. Each layer serves a distinct purpose, and skipping one means making decisions with incomplete information.
This guide walks you through a clear, rules-based framework for combining timeframes, resolving conflicting signals, and building a process you can repeat on every trade.
What Is Multiple Timeframe Analysis?
Multiple timeframe analysis means consulting more than one timeframe before you commit to a trade. Rather than staring at a single chart and hoping for the best, you deliberately zoom out to understand the broader market context, then zoom back in to find your entry.
It’s a top-down approach, and it gives you something single-chart analysis simply cannot: perspective.
How It Differs from Single-Timeframe Trading
When you trade off a single timeframe, every signal exists in a vacuum. A bullish engulfing candle on the M15 chart might look convincing on its own, but if the H4 chart shows price grinding into a major resistance zone, that “perfect” candle is more likely a trap than an opportunity.
Single-timeframe trading forces you to treat every signal as equally valid. Multi-timeframe trading introduces a hierarchy. It’s a filtering system that separates high-probability setups from noise. You stop asking “Is there a signal?” and start asking “Does this signal agree with what the market is doing on a larger scale?”
The difference is like checking the weather forecast versus just looking out your window. The window shows you right now. The forecast tells you what’s heading your way.
Why Most Professional Traders Use It
Professional and institutional traders rarely make decisions based on a single timeframe. The reason is straightforward: context changes everything. A trend on the M5 chart might last 30 minutes. A trend on the daily chart can persist for weeks.
By aligning your trades with higher-timeframe direction, you stack probabilities in your favor. This won’t guarantee success on every trade, but it consistently filters out the low-quality setups that chip away at accounts over time.
So what does this hierarchy actually look like in practice?
The Logic Behind Timeframe Hierarchy
The real power of MTF analysis is about assigning each timeframe a specific role so you know exactly what you’re looking for and where to look.
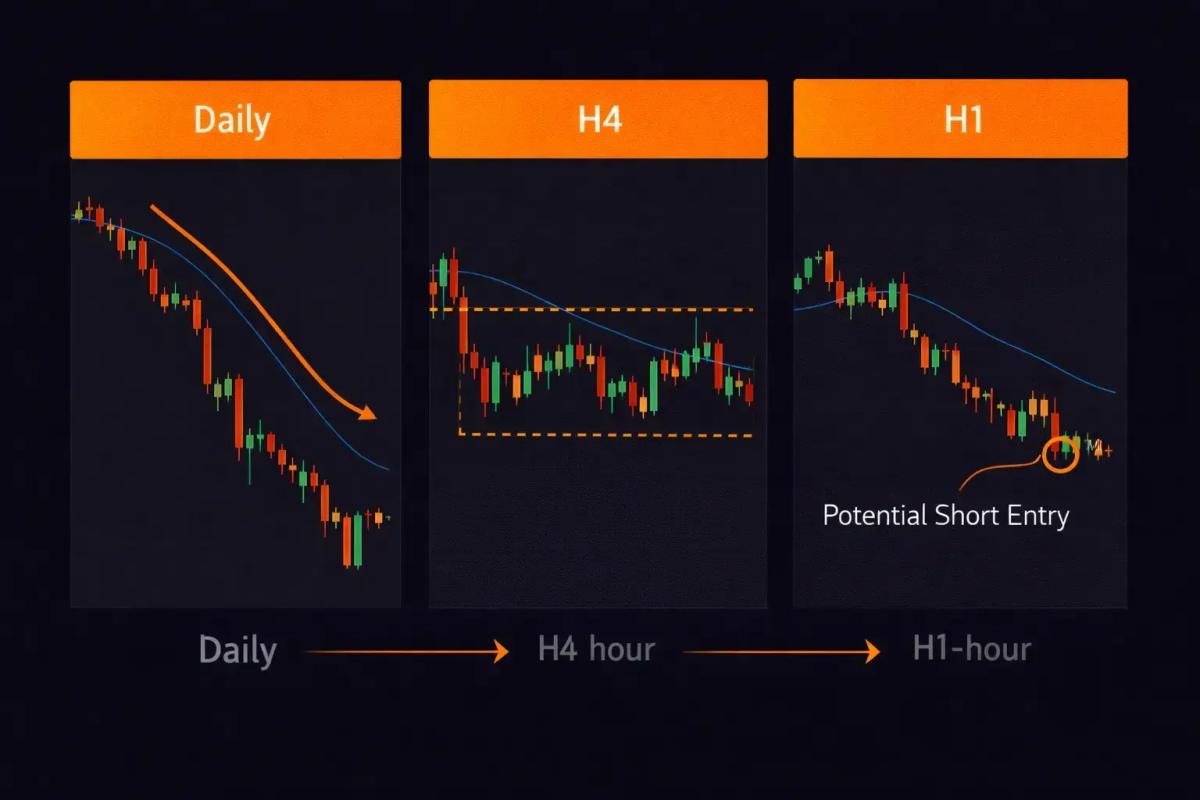
The standard framework uses three timeframes, each with a distinct job. Think of it as a chain of command: the higher timeframe sets the direction, the middle timeframe maps the terrain, and the lower timeframe tells you when to move.
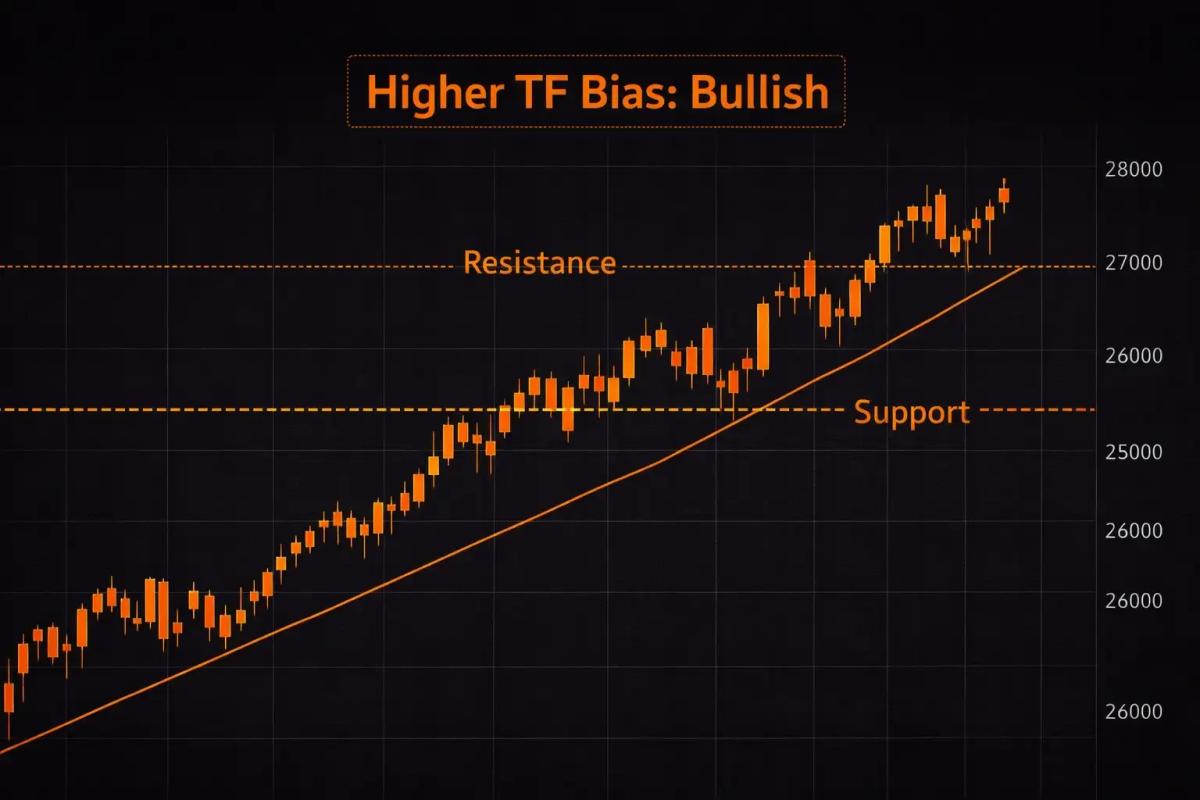
Higher Timeframe: Directional Bias
Your higher timeframe answers one question: which side of the market should you be on?
This is where you identify the dominant trend or range. If the daily chart is printing higher highs and higher lows, your bias is bullish. Full stop.
The higher timeframe acts as your compass. It doesn’t tell you where to step, but it tells you which direction to walk.
Middle Timeframe: Structure and Context
The middle timeframe is where you map out the structural landscape: key support and resistance levels, consolidation zones, and areas where price is likely to react.
This is your tactical chart. It bridges the gap between the big-picture bias and the granular entry. You’re looking for price to pull back into a key level, form a consolidation pattern, or reach a zone that aligns with your higher-timeframe direction.
If the higher timeframe is the compass, the middle timeframe is the trail map showing you the path ahead.
Lower Timeframe: Entry and Timing
Your lower timeframe is the execution chart. This is where you watch for the specific trigger (a candlestick pattern, a break of structure, a momentum shift) that tells you it’s time to get in.
The lower timeframe gives you precision. It lets you enter with tighter stop-losses and better risk-to-reward ratios because you’re drilling into the micro-movements of price within a context that’s already been validated by the higher timeframes.
Without the first two layers, the lower timeframe is just noise. With them, it becomes your sharpest tool.
But how do you decide which specific timeframes to pair together? That’s where most traders get tripped up.
How to Choose Your Timeframe Combinations
There’s a logical structure behind which timeframes work well together and which ones create more confusion than clarity.
The 4x-6x Multiplier Rule
A reliable rule of thumb is to separate each timeframe by a factor of roughly four to six. So if your middle timeframe is the H1, your higher timeframe should be approximately 4-6 times larger (H4 or H6), and your lower timeframe should be 4-6 times smaller (M10 or M15).
Why this ratio? If your timeframes sit too close together (say, M5 and M15), the information overlaps so heavily that you’re essentially reading the same chart twice. If they’re too far apart (M1 and the daily), the gap is so wide that the higher timeframe provides almost no actionable context for your entries.
The 4x-6x multiplier keeps each layer distinct enough to offer unique information while staying connected enough to tell a coherent story.
Recommended Combinations by Trading Style
Your ideal combination depends on how long you typically hold trades. Here’s a breakdown of common setups:
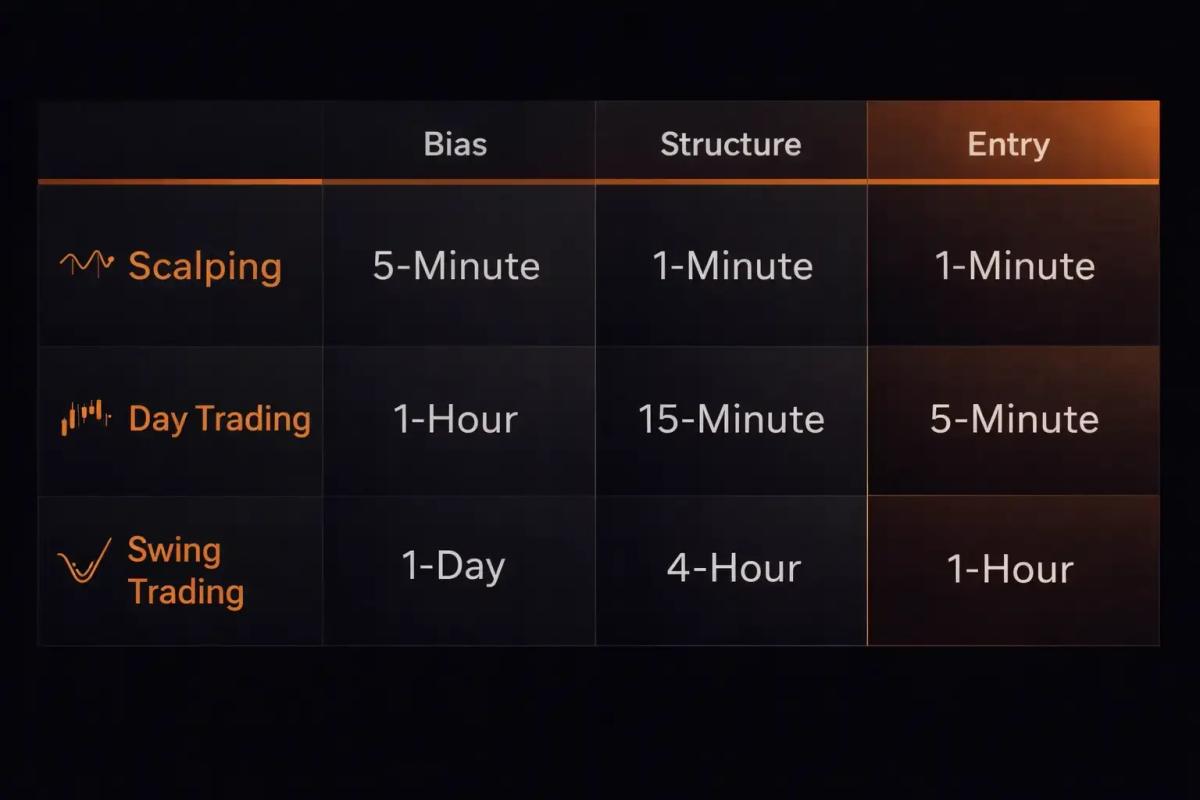
- Scalpers operate in the fastest environment. The M15 provides a micro-trend bias, the M5 reveals structure, and the M1 serves as the execution chart. Everything moves quickly, so your analysis window is compressed.
- Day traders benefit from the H4/H1/M15 combination. The H4 shows the session’s dominant direction, the H1 highlights key levels and patterns, and the M15 delivers precise entries within the day.
- Swing traders zoom out further. The daily or weekly chart sets the macro bias, the H4 provides structural context, and the H1 is where you time entries on pullbacks or breakouts.
These are well-tested starting points. What matters most is maintaining that approximate 4x-6x spacing between layers and sticking with your chosen combination consistently.
Now that you know which timeframes to use, let’s walk through how to actually execute a multi-timeframe trade from start to finish.
Step-by-Step Multi-Timeframe Trading Strategy
Having the right timeframe combination means nothing without a consistent process behind it. This step-by-step framework gives you a repeatable routine, one that works whether you’re trading forex, stocks, or crypto.
Step 1: Read the Higher Timeframe for Bias
Open your higher timeframe chart first. Before you draw a single line, ask yourself: is this trending up, trending down, or ranging?
Look at the structure. Are you seeing higher highs and higher lows (bullish)? Lower highs and lower lows (bearish)? Or is price chopping sideways between clear boundaries?
You can use a moving average (like the 50 or 200 period) as a quick visual guide. If price is above and the moving average slopes upward, that’s a bullish bias. Below and sloping down, bearish. But the structure of highs and lows remains your primary read.
Once you’ve established your bias, write it down or say it out loud: “My bias is bullish” or “My bias is bearish.” This simple act anchors you and prevents second-guessing five minutes later when the lower timeframe wiggles against you.
Step 2: Identify Key Levels on the Middle Timeframe
Now move to your middle timeframe. Your job here is to mark the structural levels that matter most: the zones where price is likely to react.
Look for:
- Horizontal support and resistance levels with multiple touches
- Recent swing highs and swing lows
- Consolidation zones or areas of heavy price interaction
- Key technical levels like round numbers or prior breakout points
You’re building a map. When price reaches one of these levels and your higher-timeframe bias supports a trade in that direction, you’ve got a potential setup brewing. If nothing lines up, you wait. Patience here pays dividends later.
Step 3: Time Your Entry on the Lower Timeframe
Once price reaches a key level on the middle timeframe and aligns with your higher-timeframe bias, switch to the lower timeframe for your trigger.
What counts as a trigger depends on your strategy, but common entry signals include:
- A bullish or bearish engulfing candle at the key level
- A break of a lower-timeframe consolidation or range
- A momentum shift confirmed by indicators like RSI or MACD
- A rejection wick or pin bar showing clear buying or selling pressure
The lower timeframe is where precision matters. Your stop-loss goes below the most recent structural point on this chart, giving you a tight, well-defined risk.
Step 4: Manage the Trade Across Timeframes
Your entry happens on the lower timeframe, but your trade management should reference all three.
Use the middle timeframe’s key levels as partial profit targets or areas to trail your stop. Use the higher timeframe to gauge whether the overall trend still supports holding the position. If the higher timeframe structure breaks (a trend reversal, a key level violation), that’s your cue to manage risk aggressively, regardless of what the lower timeframe shows.
This layered management approach keeps you from exiting too early because of lower-timeframe noise, while also keeping you alert to genuine shifts in the broader market direction.
What happens, though, when the timeframes aren’t telling the same story?
Resolving Conflicting Signals Across Timeframes
Few things frustrate traders more than charts that seem to disagree. The daily looks bullish, the H1 is bearish, and the M15 is doing its own thing entirely. This is where most traders either freeze or, worse, start cherry-picking the timeframe that supports the trade they already want to take.
When Higher and Lower Timeframes Disagree
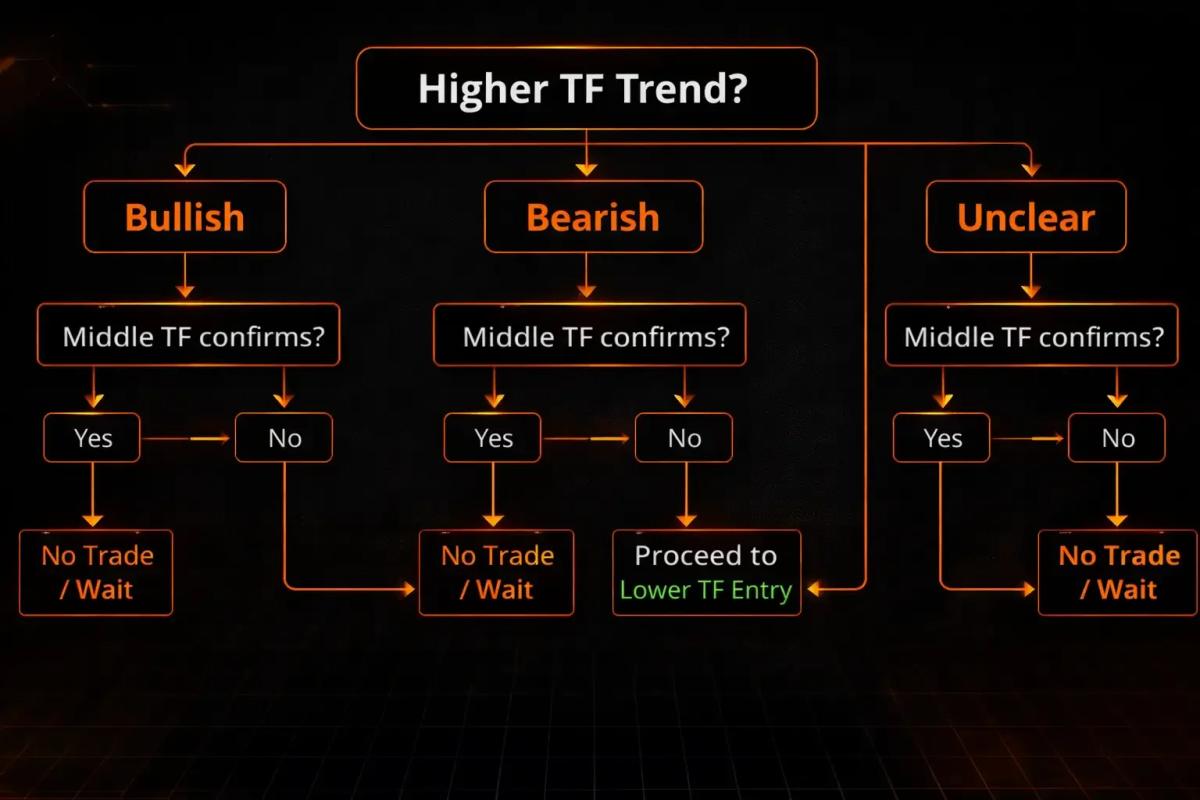
Here’s the principle that will save you from endless confusion: the higher timeframe always gets priority.
If the daily chart is bullish and the H1 is showing a pullback, that’s not a conflict. That’s a potential buying opportunity. A lower-timeframe move against the higher-timeframe trend is often just a retracement, not a reversal.
The real conflict arises when the higher timeframe is unclear (ranging or sitting at a major inflection point) and the lower timeframe is flashing a strong signal. In that scenario, your lower-timeframe signal has no wind behind it. It might work, but the odds shrink because there’s no dominant flow supporting it.
The “No Trade” Filter
This is the part most traders skip, and it’s the part that protects your capital the most.
If your higher and middle timeframes don’t agree, or if the higher timeframe is messy and directionless, the correct action is to do nothing. No trade is a valid position. Your framework isn’t just a system for finding trades; it’s equally a system for filtering them out.
Build a simple rule: if you can’t clearly state your higher-timeframe bias in one sentence, you don’t trade. If the middle timeframe doesn’t offer a clean level that aligns with that bias, you don’t trade. The lower timeframe entry only matters after the first two boxes are checked.
This single filter can dramatically cut the number of impulsive, low-quality trades that drain accounts. But even with a solid process, there are pitfalls that trip up nearly every trader learning MTF analysis.
Common Multiple Timeframe Analysis Mistakes
Understanding the framework is one thing. Sidestepping the traps that come with it is another. These are the mistakes worth catching before they cost you real money.
Overcomplicating with Too Many Timeframes
More timeframes don’t equal better analysis. Each additional timeframe introduces more potential contradictions, more noise, and more opportunities for analysis paralysis.
Three timeframes is the standard for a reason. It gives you bias, structure, and entry, which covers everything you need. If three charts aren’t giving you clarity, a fourth or fifth won’t solve the problem. The issue is usually with interpretation, not with the amount of information.
Ignoring Higher Timeframe Bias on Entries
This one is painfully common. You do the analysis, see the daily is bearish, and then a bullish setup on the M15 looks so clean that you convince yourself it’s the exception.
It’s almost never the exception.
Taking lower-timeframe entries against the higher-timeframe bias is one of the quickest ways to erode an account. Those setups might work occasionally, but over a large sample, you’re fighting the dominant flow. It’s like walking up a down escalator. You can do it, but why would you when the one going your direction is right there?
Timeframe Hopping and Confirmation Bias
Timeframe hopping happens when you move between charts searching for the one that supports the trade you’ve already decided you want.
This is confirmation bias dressed in technical analysis clothing. Pick your three timeframes before the trading session starts and commit to them. If your chosen combination isn’t showing a setup, accept it and move on.
With these pitfalls in mind, let’s look at some tools that can make your multi-timeframe process smoother.
Tools and Indicators That Support MTF Analysis
You don’t need complex or expensive tools to do multi-timeframe analysis well. In many cases, the simpler your toolkit, the cleaner your reads tend to be.
Moving Averages Across Timeframes
Moving averages are one of the most effective tools for MTF analysis because they distill trend direction into a single visual line.
A common approach is to apply the same moving average period (such as the 50-period or 200-period) across all three of your timeframes. This gives you an instant visual read:
- Higher timeframe: Is price above or below the MA? What’s the slope? This confirms your directional bias.
- Middle timeframe: Is price interacting with the MA? Bouncing off it or breaking through? This highlights structural turning points.
- Lower timeframe: Is the MA supporting your entry direction? A lower-timeframe price crossing above a rising MA in the direction of the higher-timeframe bias adds a solid layer of confirmation.
The beauty of moving averages lies in their simplicity. They strip out noise and give you a clean, visual snapshot of trend alignment across your chosen timeframes.
MTF Indicator Overlays on Trading Platforms
Most modern trading platforms, including TradingView and the MetaTrader suite (MT4/MT5), offer multi-timeframe indicator capabilities that save you from constantly flipping between charts.
On TradingView, the built-in MTF function lets you plot a higher-timeframe moving average directly on your lower-timeframe chart. This means you can see your H4 trend context while watching price action on the M15, all on one screen.
MT4 and MT5 support similar overlays through custom indicators. Several free community-built MTF indicators allow you to display higher-timeframe support, resistance, and moving averages on your execution chart.
The goal is to pick one or two overlays that keep the bigger picture visible while you focus on execution.
Frequently Asked Questions
What is the best timeframe combination for beginners learning multi-timeframe analysis?
If you're just starting with MTF analysis, the H4/H1/M15 combination is a strong choice. It moves slowly enough that you have time to analyze without pressure, while still offering regular trading opportunities. This day trading combination is also well-documented, making it easier to find educational examples and practice setups.
How many timeframes should I analyze at once?
Three is the widely accepted standard, and for good reason. Three timeframes give you a complete picture (bias, structure, entry) without creating information overload. Some experienced traders condense it to two, but going above three typically introduces more confusion than clarity.
Does multiple timeframe analysis work for crypto and stocks, or only forex?
MTF analysis works across any liquid, charted market. The principles of trend alignment and top-down analysis apply equally to forex pairs, stock indices, individual equities, and major cryptocurrencies. The timeframe combinations may shift slightly (crypto markets run around the clock, which affects how daily candles form), but the core framework remains the same.
What should I do when all three timeframes show conflicting signals?
When none of your timeframes agree, the simplest and most effective action is to stand aside. Conflicting signals across all three layers mean the market lacks a clear directional bias. Forcing a trade in this environment is essentially gambling. Wait for alignment, even if that means sitting out for a session or two.
Do I need specific indicators for multi-timeframe analysis, or is price action enough?
Price action alone is absolutely sufficient for MTF analysis. The three-timeframe framework is built on reading market structure (highs, lows, levels), which requires nothing beyond a clean chart. Indicators like moving averages can help confirm what you're already seeing, but they're supplementary, not required.
How long does it take to become proficient at reading multiple timeframes?
There's no universal timeline, but most traders find that consistent practice over two to three months of active screen time brings noticeable improvement. The challenge is training yourself to follow the process consistently and resist the urge to override your higher-timeframe bias. Keeping a trading journal focused on MTF alignment tends to speed up the learning curve significantly.
Does multi-timeframe analysis work for scalpers, or is it only useful for swing traders?
MTF analysis absolutely works for scalpers. In fact, many successful scalpers consider it essential. The timeframes are simply compressed (M15/M5/M1 instead of D1/H4/H1), but the logic is identical. Even on the fastest timeframes, knowing whether the slightly higher timeframe supports your direction makes a measurable difference in trade quality. This content is for educational purposes only and does not constitute financial advice. Trading involves significant risk of loss, and you should never trade with money you cannot afford to lose. Past performance does not guarantee future results.
About the authors


Related articles
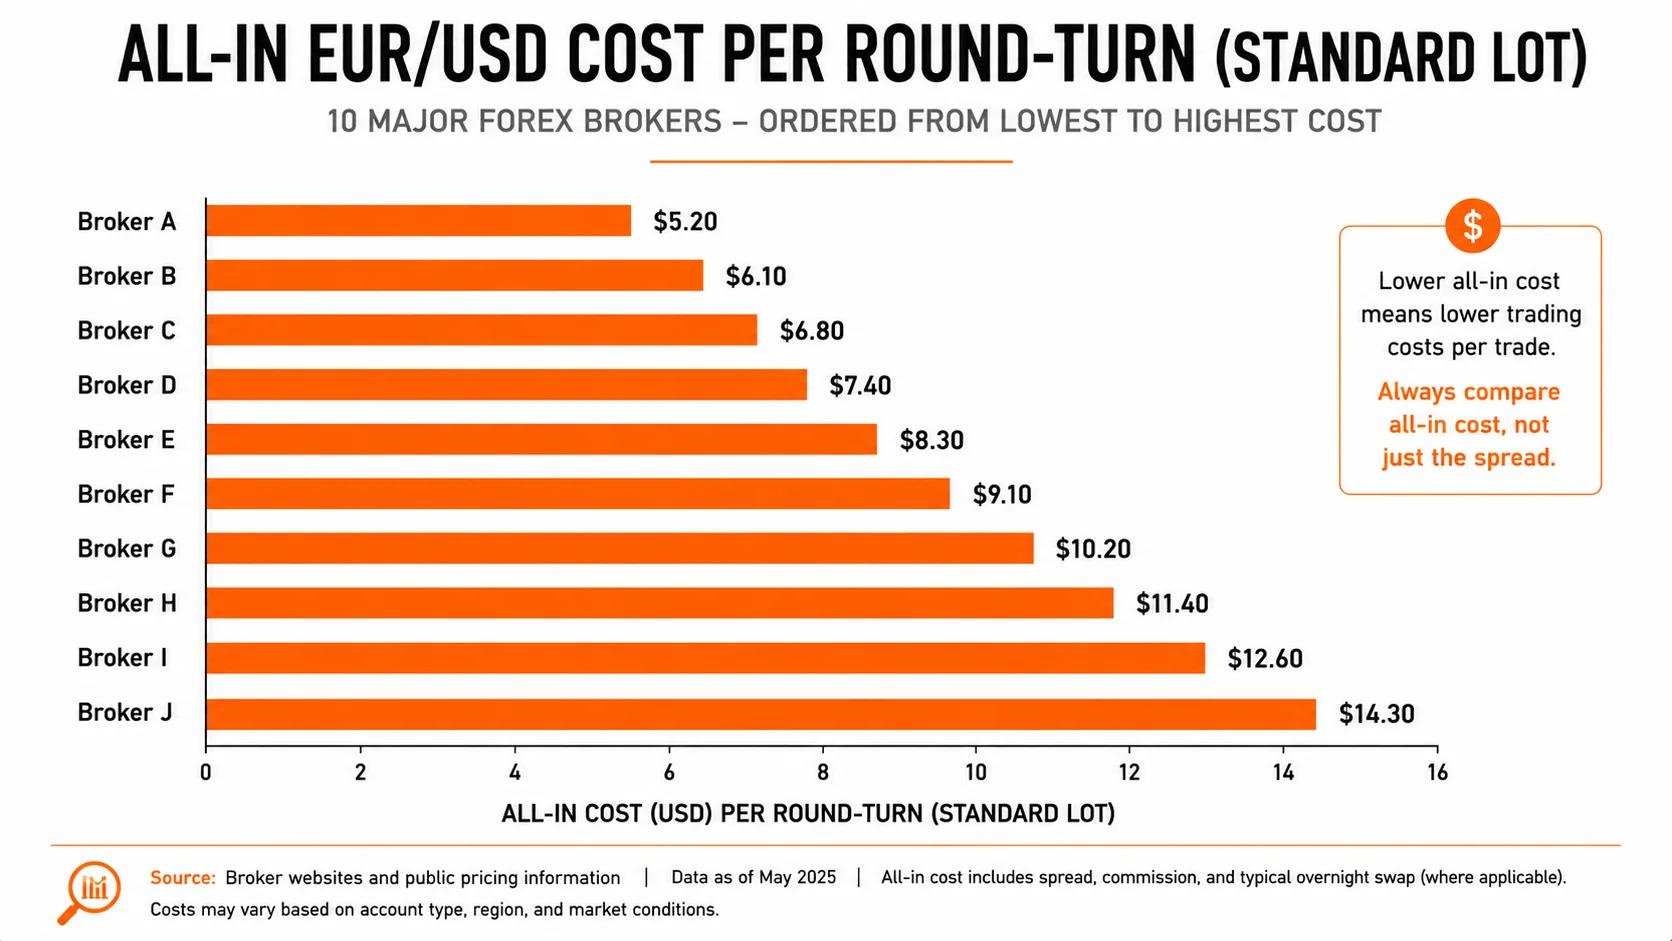
The True Cost of Trading: A Data-Driven Comparison Across 10 Forex Brokers
Full-cost comparison across spreads, commissions, swap rates, and fees for 10 major forex brokers; including EUR/USD, GBP/USD, and Gold trading costs per lot.

7 Moments to Be Bullish on Gold (When to Buy Gold and Why It Matters)
Discover 7 key moments that signal when to buy gold, from real rate shifts to dollar weakness and central bank demand.

Best Day Trading Platforms: Features, Fees, and Execution Speed Compared
A structured comparison of the best day trading platforms: execution latency, spreads, FCA leverage caps, tax reporting, and the psychological tooling that separates disciplined traders from
0 comments