



Trading Basics · Beginner · 6 min read
What is liquidity in trading: spreads, slippage, and execution
Many trading beginners tend to fall in the same trap when placing their first trades: they only look at price, ignoring another data point that is just as important: liquidity.
In this article, we will explain why liquidity is critical when making trading decisions and how to use it to evaluate trades.
The smallest price move, explained
Liquidity is how easily you can buy or sell an asset at a price close to what the market is quoting right now. High liquidity means tight bid-ask spreads and fast execution; low liquidity means wider spreads, slippage and slower fills. For you, liquidity decides whether your entry and exit happen at the price you expected or at a worse one.
[SEC Investor.gov glossary]: Liquidity generally refers to how easily or quickly a security or asset can be bought or sold in the market without affecting its price.
Think of liquidity as the depth of the pool of orders sitting on both sides of the market. A deep pool absorbs your order without moving the price much. A shallow pool moves visibly the moment you hit the button.
Understanding how trading skills development helps you read these dynamics is key to managing execution risk. This guide breaks down where that depth comes from, how to see it on your platform and how it changes across forex, indices, equities and commodities.
Choosing where to trade matters as much as the strategy; see the best forex brokers and their conditions.
Supply, demand, and the bid-ask spread
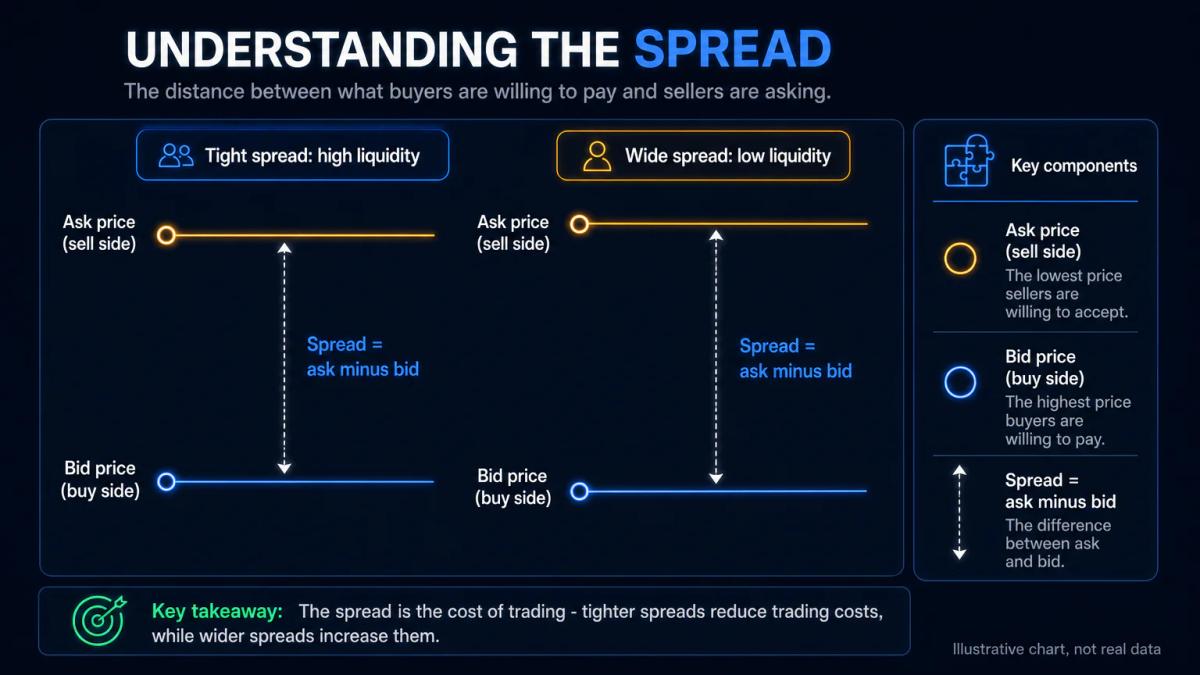
Liquidity flows from the balance between buyers and sellers in a market. When many traders want to buy and sell the same asset, the bid-ask spread (the gap between the best buy price and the best sell price) narrows, because there is always someone ready to take the other side of your trade. When few traders are active, the spread widens and you pay more to enter or exit.
A worked example makes it concrete.
- On a liquid pair like EUR/USD during the London-New York overlap, the spread often sits around 0.1 pip on a raw-spread account (a pip is the fourth decimal of the quote, the standard unit of price movement in forex).
- On an exotic pair like USD/TRY at the same hour, the spread can be 40 to 80 pips. Same broker, same platform, radically different cost, because the underlying liquidity is not the same.
| Asset class | Typical instrument | Indicative spread in liquid hours |
|---|---|---|
| Major forex | EUR/USD | 0.1 to 0.6 pip |
| Major index CFD | FTSE 100, S&P 500 | 0.4 to 1.0 point |
| Blue-chip equity CFD | AstraZeneca, Apple | 0.05% to 0.10% of price |
| Commodity CFD | Gold (XAU/USD) | 0.15 to 0.30 dollar |
| Exotic forex | USD/TRY, USD/ZAR | 20 to 100 pips |
How liquidity shapes your execution and costs
Slippage and execution speed are direct consequences of liquidity.
Slippage is the difference between the price you clicked and the price you actually got. In a liquid market like EUR/USD or the FTSE 100, your market order fills within milliseconds at or near the quoted price. In an illiquid market, your order may sit unfilled, or fill at a price meaningfully worse than expected, eating into your profit margin or widening your loss.
Execution cost is not only the spread. It is spread plus slippage plus, on some accounts, commission. Understanding leverage trading mistakes helps you avoid blowing your account when thin liquidity amplifies losses. In May 2010, during what became known as the Flash Crash, the S&P 500 dropped roughly 9% and recovered within about 36 minutes; the U.S. Securities and Exchange Commission and the Commodity Futures Trading Commission concluded in their joint 2010 report that a large sell order interacted with thin liquidity and triggered a cascade of withdrawn quotes. Retail stop losses were filled well below intended levels that day.
Since then, exchanges have added circuit breakers to pause trading when prices move too fast.
Why liquidity is a critical factor in trading
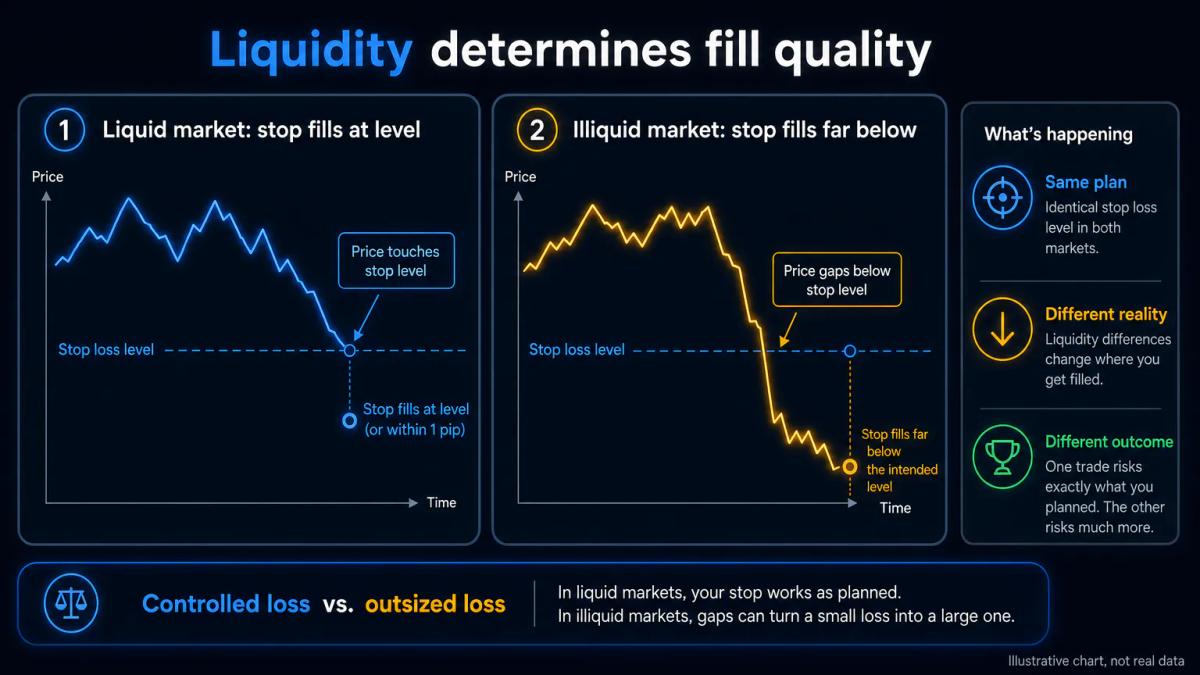
Liquidity is critical because it directly affects your risk management and profitability.
- A stop loss (a resting order that closes your position once price reaches a set level) placed in an illiquid market can trigger far below the level you chose, turning a controlled loss into an outsized one.
- In a liquid market, the same stop is much more likely to fill within a pip or two of your level, giving you the predictable outcome your position sizing assumed.
[SEC Investor.gov, liquidity risk]: Liquidity risk is the risk that investors won't find a market for their securities, potentially preventing them from buying or selling when they wish.
According to the Financial Conduct Authority, a majority of retail clients lose money trading CFDs. Under FCA rules, UK retail leverage is capped at 1:30 on major currency pairs, 1:20 on major indices and 1:5 on individual equities; CFDs on cryptocurrencies are banned for UK retail clients. These caps limit how large a position you can hold against thin liquidity.
How to find liquidity on your chart
Look for volume spikes and tight bid-ask spreads on your broker's platform or on TradingView. Major currency pairs, large-cap indices and blue-chip equities are highly liquid; smaller stocks, emerging-market currencies and exotic pairs are less so.
Learning how to identify market trends gives you the framework to spot volume patterns and liquidity shifts in real time. Liquidity is highest during regional session overlaps (London-New York for forex, the London and New York cash opens for indices) and drops sharply on weekends, public holidays and around major economic releases.
- On MT4 and MT5, the Volumes indicator shows tick volume per candle. On cTrader, the Level II depth-of-market window shows real orders resting on each side.
- On TradingView, the built-in Volume study plus the current spread quote give you a fast read. If tick volume is falling and the spread is widening, you are watching liquidity thin out in real time.
Liquidity in day trading versus swing trading
Day traders depend on high liquidity because they enter and exit multiple positions within hours or minutes. Understanding how many day traders are successful shows why liquidity is non-negotiable for this style: a single tick of slippage repeated across ten trades can wipe out the edge on a small account.
Swing traders hold positions for days or weeks, so they can tolerate lower liquidity and wider spreads, because they are not fighting the clock and the entry cost is a small fraction of the expected move.
If you trade a $2,000 account, this changes your market selection. You want instruments where the round-trip cost, spread plus commission plus expected slippage, is well under your average target. For most small retail accounts that means majors in forex, front-month major-index CFDs and highly traded large-cap shares, and it means avoiding exotic pairs and thinly traded small caps during off-hours.
Frequently Asked Questions
What is the difference between high liquidity and low liquidity in trading?
High liquidity means many buyers and sellers are active at the same price level, so spreads are tight and orders fill quickly at or near the quoted price. Low liquidity means few participants, so the spread widens, orders can partially fill or slip to a worse level, and price can jump on modest volume.
How does liquidity affect the bid-ask spread and my trading costs?
Spread is the direct price of liquidity. On a liquid instrument like EUR/USD the spread can be 0.1 to 0.6 pip in peak hours; on an exotic pair or a small-cap share the spread can be many multiples of that. Your total cost is spread plus slippage plus any commission, and all three widen as liquidity falls.
Which markets and asset classes have the highest liquidity for retail traders?
Major forex pairs (EUR/USD, USD/JPY, GBP/USD), major stock index CFDs (S&P 500, FTSE 100, DAX), gold and blue-chip equities like Apple or AstraZeneca are the deepest markets available to retail. They stay liquid during London and New York cash hours and are the safest choice for small accounts.
Can I trade illiquid assets, and what risks should I watch for?
You can, but you accept wider spreads, larger slippage, higher risk that stop losses fill far from your level and the possibility of gap moves on news. If you trade an illiquid market, reduce your position size, avoid market orders in fast conditions and never assume your stop will fill at the price you set.
How do I measure liquidity in real time on my trading platform?
Watch the live spread and tick volume. On MT4 and MT5 use the Volumes indicator; on cTrader open the Level II depth-of-market window to see resting orders on each side; on TradingView add the Volume study and monitor the quote. A widening spread together with falling volume is the classic signal that liquidity is thinning.
About the authors


Put this into practice
Brokers we have reviewed
Scored on the same five dimensions. Here are three of them — the full list is on the brokers page.



Related articles
How Much Do Forex Traders Actually Make? A Realistic Income Breakdown
A realistic, data-grounded breakdown of forex trader income across four trader types, from part-time retail to institutional, including what account size actually means for your earnings.
Which Forex Brokers Have the Most Complaints? What Regulatory Records Actually Show
Learn how to check forex broker complaint records across FCA, ASIC, NFA, and CySEC databases; and what those records actually tell you before you open an account.
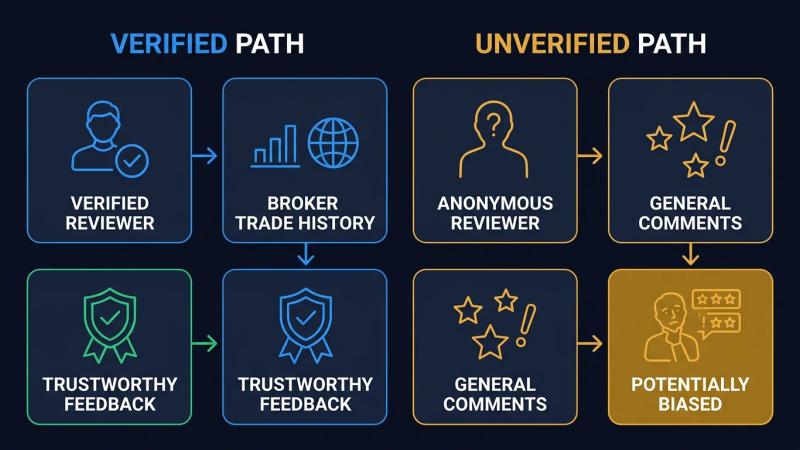
Verified vs Unverified Forex Broker Reviews: What the Difference Actually Means
What "verified" actually means on broker review platforms, how to spot fake review campaigns, and how to build a credibility framework that surfaces genuine signal before you open an account.
0 comments