



Technical Analysis · Beginner · 8 min read
Chaikin Volatility Indicator: How to Read Expansion and Contraction Signals
The smallest price swings, measured and ranked
Marc Chaikin built the Chaikin Volatility Indicator to measure the rate of change in the distance between a security's high and low prices over a set period, using an exponential moving average (EMA), a moving average that gives more weight to recent bars, to smooth the data.
The indicator tells you whether volatility is expanding or contracting relative to recent history. For a retail trader, that reading flags when price movement is accelerating, which often precedes a breakout or a reversal.
Think of it as a speedometer for price range rather than for price itself. Two markets can trade at the same level, but one is coiling while the other is stretching its daily bars wider. The Chaikin Volatility Indicator isolates that difference and turns it into a single line that oscillates around zero, which you can read at a glance.
If you still need a broker, our guide to the best forex brokers compares the regulated options side by side.
How the calculation works: EMA of the high-low range
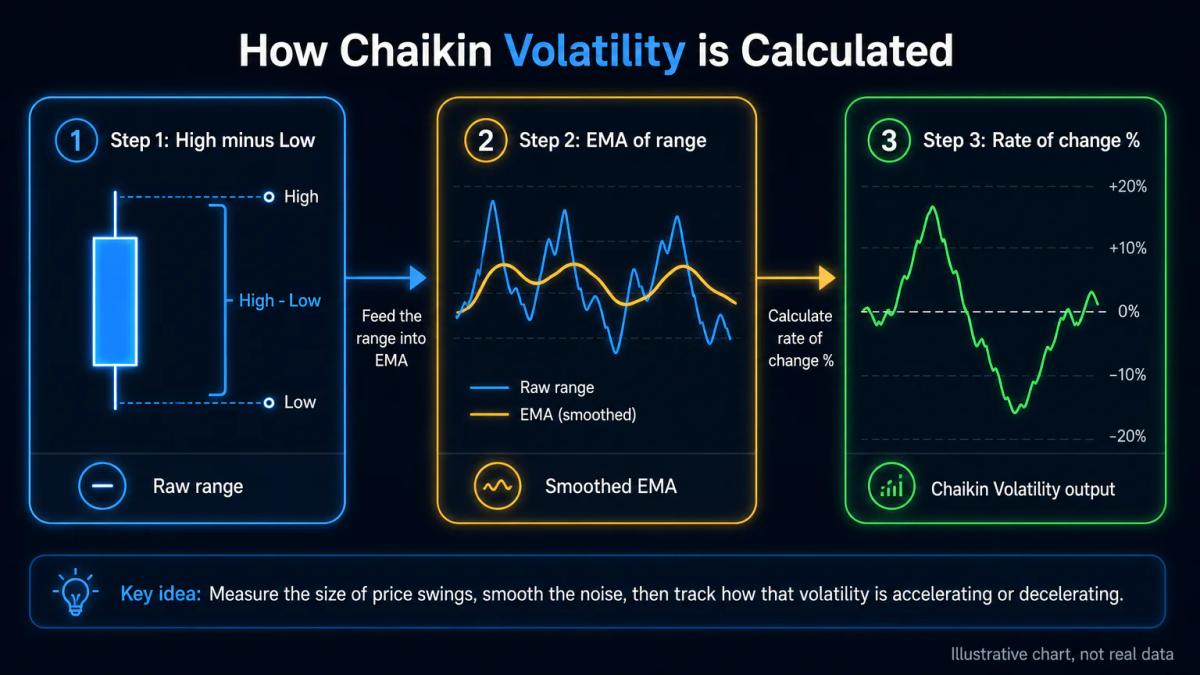
The indicator is built in three steps.
- First, for each bar, you take the difference between the high and the low.
- Second, you apply an EMA to that range, typically over 10 bars, so short spikes do not dominate the reading.
- Third, you measure the rate of change of that EMA over another lookback, usually 10 periods, and express it as a percentage.
The formula, in plain terms:
| Step | Calculation | What it captures |
|---|---|---|
| 1 | High minus Low | Raw range of each bar |
| 2 | EMA of (High minus Low), 10 periods | Smoothed recent range |
| 3 | ((EMA today, EMA 10 bars ago) / EMA 10 bars ago) x 100 | Percentage change in volatility |
A positive reading means the smoothed range has grown compared with 10 bars ago; a negative reading means it has shrunk. The absolute value tells you how fast the change is happening. Because the calculation is anchored to the high-low range and not the close, gaps and wicks feed directly into the signal, which is why the Chaikin Volatility Indicator responds faster than close-based volatility measures.
Reading expansion and contraction signals
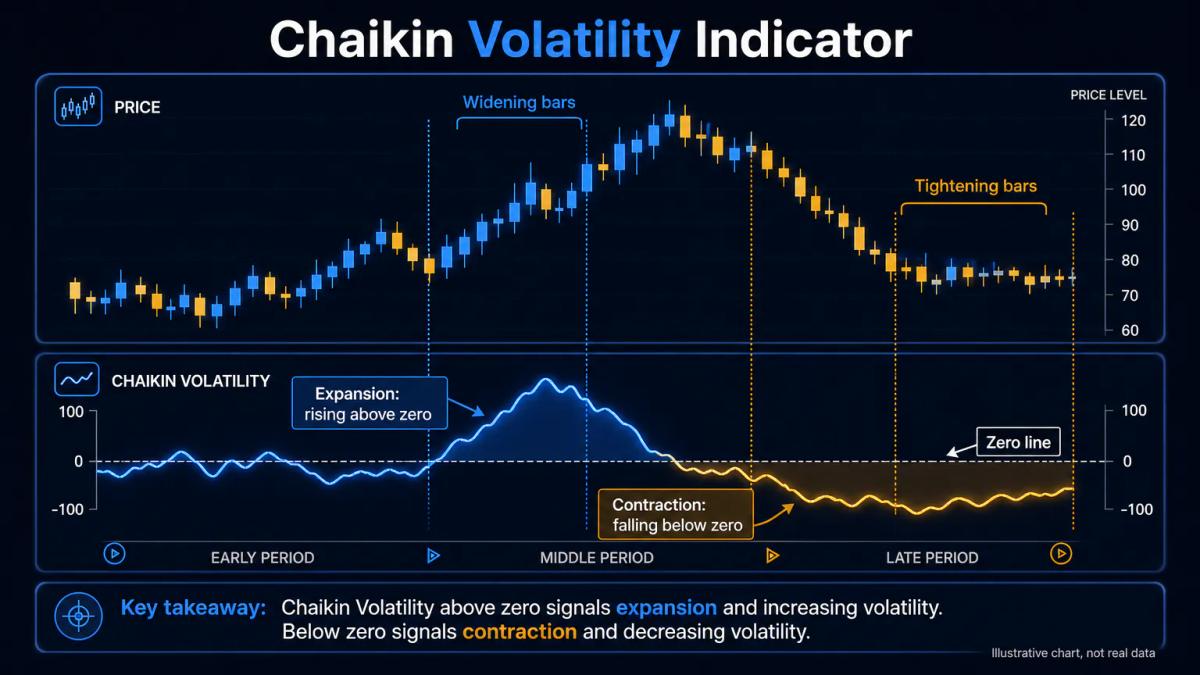
When the Chaikin Volatility line rises above zero and keeps climbing, volatility is expanding: bars are getting wider than they were 10 periods ago. When the line falls below zero or slides toward it, volatility is contracting: bars are getting tighter.
Expansion often signals that a new trend or breakout is under way, while contraction points to consolidation, and sometimes to an incoming reversal once the market is fully coiled.
The slope matters as much as the level. A gentle rise from +5 to +10 suggests steady acceleration, while a sharp jump from -20 to +40 in a handful of bars flags a volatility shock, the kind you see around economic releases or news events. Read the two together:
| Line behaviour | What it usually means | Typical setup |
|---|---|---|
| Rising above zero, steep slope | Fast expansion | Breakout in progress |
| Rising above zero, shallow slope | Steady expansion | Established trend |
| Falling toward zero | Deceleration | Trend maturing |
| Persistent below zero | Contraction | Range or coil |
Because the indicator says nothing about direction, treat it as a filter, not as a trigger. It answers "is now a moment when price is likely to move", not "which way".
Spotting reversals and breakout setups
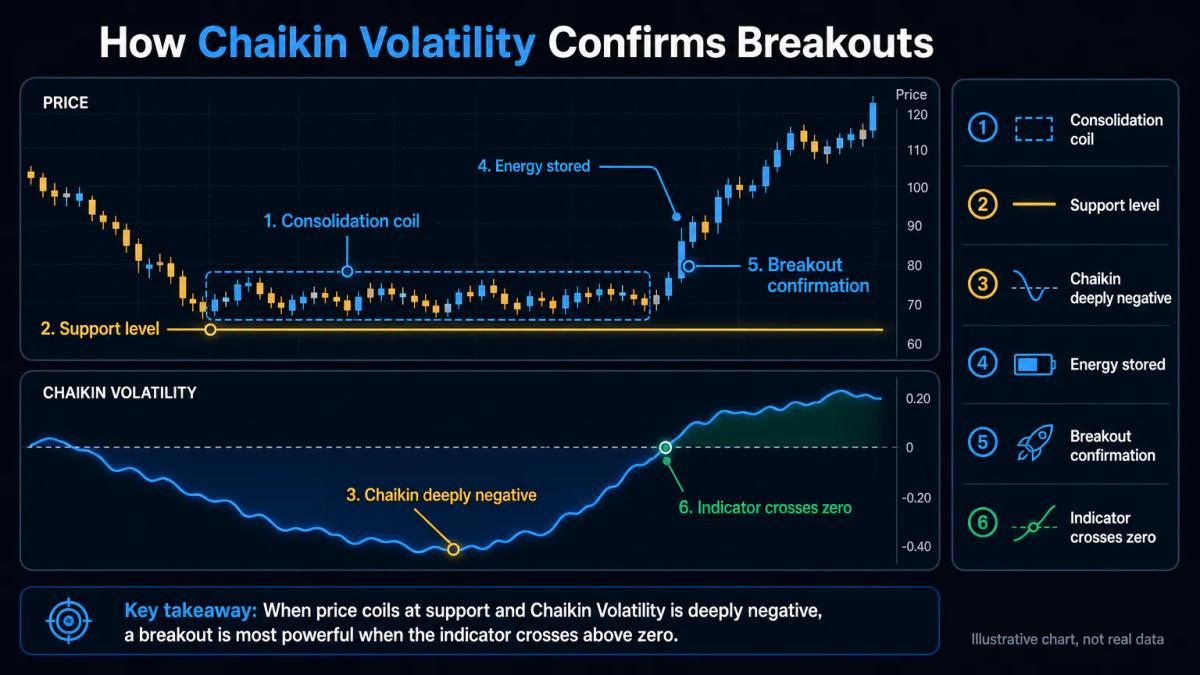
Many traders use the Chaikin Volatility Indicator to time reversals and breakouts by looking for a sharp contraction, a reading near zero or negative, that precedes a directional move. When price is compressing near a horizontal support or resistance and the indicator is deeply negative, you have a coil: energy is being stored. The first push out of that range, accompanied by the indicator crossing back above zero, is your breakout confirmation.
A practical checklist for a breakout setup:
- Identify a clear horizontal level (support or resistance) tested at least twice.
- Confirm the Chaikin Volatility line has been negative for several bars, showing contraction.
- Wait for price to close beyond the level.
- Require the indicator to turn upward through zero on the breakout bar.
- Place a stop loss (a preset order that closes the trade at a loss to cap the damage) on the opposite side of the broken level.
For reversals, the logic flips. A very high positive reading during an extended trend often marks a climactic move: volatility peaks, then contracts, and price rolls over. The indicator alone will not tell you the top or bottom is in; combine it with continuation vs. reversal patterns on the chart, a momentum divergence on RSI or MACD, and a swing failure before acting.
Chaikin Volatility versus ATR and other volatility tools
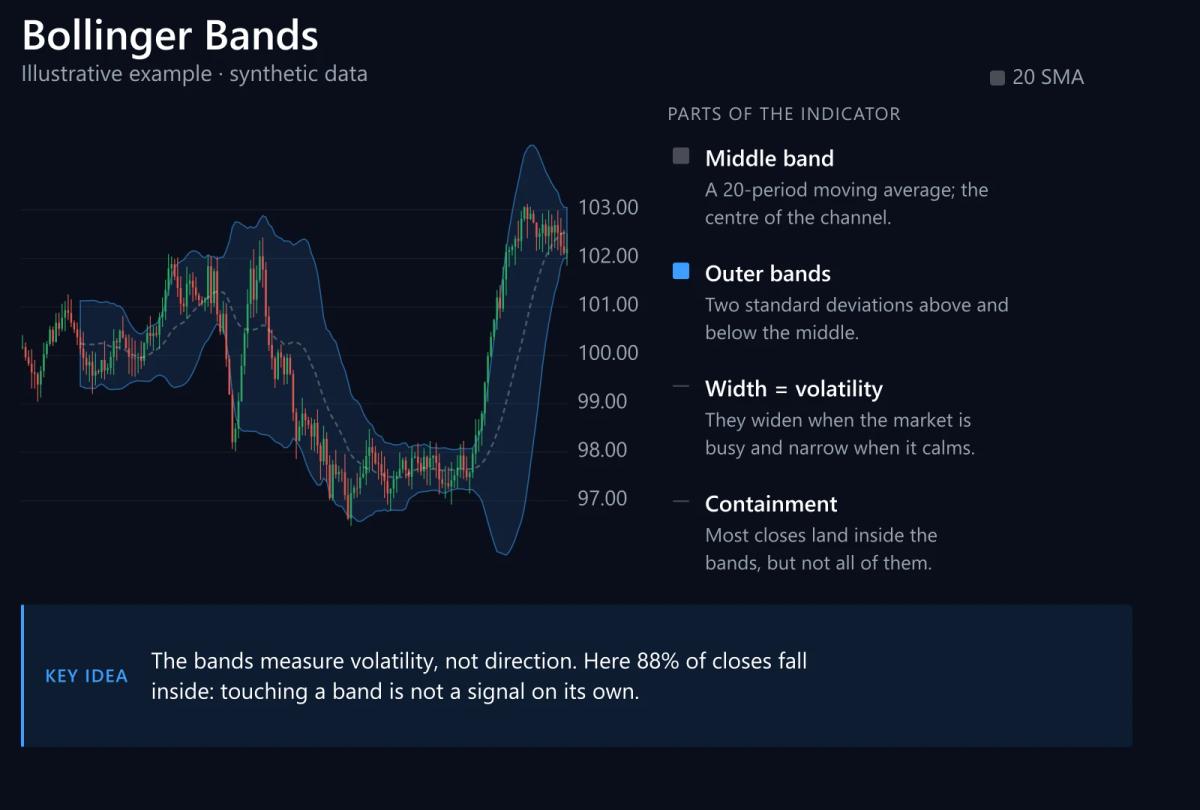
Chaikin Volatility measures the rate of change of volatility. ATR, the Average True Range, measures the absolute size of recent bars. Bollinger Bands, two standard deviations plotted around a moving average, show volatility visually as band width. Each answers a different question, and mixing them gives you a fuller picture.
| Tool | What it measures | Best use |
|---|---|---|
| Chaikin Volatility | Rate of change of high-low range | Timing expansion and contraction |
| ATR | Average size of recent true range | Position sizing and stop distance |
| Bollinger Bands | Standard deviation of closes | Visual squeeze and mean reversion |
| Keltner Channels | ATR-based envelopes around EMA | Trend channels with fixed volatility |
A workable pairing: use ATR to set the stop loss and position size, and use Chaikin Volatility to decide whether now is a moment worth trading at all. If ATR is low and Chaikin Volatility is deeply negative, you are early; if Chaikin turns up and ATR follows, you are in the move.
Common pitfalls and limitations
The Chaikin Volatility Indicator works best in markets that alternate cleanly between quiet and active phases. In choppy, sideways price action it whipsaws: the line crosses zero repeatedly without a real breakout, and every crossing looks like a signal. The indicator also says nothing about direction, so a rising reading with no trend context can send you long into a fake breakout that reverses within hours.
Understanding types of trading and how different strategies respond to choppy conditions can help you filter these false signals.
Typical false-signal patterns to watch for:
- Volatility spikes on a single news bar, then collapses.
- Rising Chaikin during a wide range on low volume: participation is thin.
- Positive Chaikin while price grinds sideways: volatility from wicks, not directional bars.
Filter these by demanding a close beyond a structural level, volume above its own recent average, and a trend filter such as the 50-period moving average agreeing with the trade side.
Practical setup and parameter tuning
Most charting platforms ship a Chaikin Volatility Indicator with a default 10-period EMA of the high-low range and a 10-period rate-of-change calculation. Those defaults are fine as a starting point, but the right settings depend on the asset and the timeframe you trade.
| Market | Timeframe | EMA length | ROC length |
|---|---|---|---|
| FX majors | 5m to 15m | 5 to 7 | 5 to 7 |
| Crypto | 15m to 1h | 7 to 10 | 7 to 10 |
| Index CFDs | 1h to 4h | 10 | 10 |
| Equities | Daily | 10 to 14 | 10 |
| Commodities | Daily | 14 to 20 | 10 to 14 |
Setup on the main platforms is similar: in MT4 and MT5 the indicator is available through custom indicators or the Chaikin family bundled with add-on packs; in TradingView it is a built-in study named "Chaikin Volatility"; in cTrader it is loaded from the indicator library.
If you trade with prop firms that use TradingView, test any parameter change on at least a year of historical data on the specific asset before you trade it live.
Combining Chaikin Volatility with other indicators
A single indicator rarely produces a robust system. Pair the Chaikin Volatility Indicator with a trend filter such as the 200-period moving average or ADX, the Average Directional Index that measures trend strength, to avoid trading breakouts against the dominant direction. Use RSI or MACD to confirm that momentum aligns with the volatility expansion, and require volume to be above its own 20-period average on the signal bar. Learning how to trade momentum stocks gives you a framework for this kind of multi-indicator confirmation.
A simple multi-indicator template for a long breakout:
- Price above the 200-period moving average.
- ADX above 20 and rising.
- Chaikin Volatility crossing from negative to positive.
- RSI above 50, not yet above 70.
- Volume above its 20-bar average on the breakout bar.
Risk each trade at a fixed fraction of account equity, and set the stop loss at 1 ATR below the breakout level.
Frequently Asked Questions
What is the Chaikin Volatility Indicator and who created it?
It is a technical indicator developed by Marc Chaikin that measures the rate of change of an exponential moving average applied to the high-low range of price. It quantifies whether volatility is expanding or contracting relative to a recent lookback window, typically 10 periods.
How do you interpret Chaikin Volatility expansion versus contraction?
Readings above zero and rising indicate expansion: bars are getting wider than they were 10 periods ago, often around breakouts. Readings below zero or falling indicate contraction: bars are tightening, which points to consolidation and sometimes precedes a reversal once the coil is complete.
Can Chaikin Volatility predict price direction or only volatility change?
It measures volatility change only, not direction. A rising Chaikin line tells you a move is likely, but you need price action, a trend filter or a momentum oscillator such as RSI or MACD to decide whether that move is up or down.
What are the best parameter settings for Chaikin Volatility on different timeframes?
For fast markets such as FX and crypto on intraday charts, shorten the EMA and rate-of-change lengths to 5 to 7. For index CFDs and equities on hourly and daily charts, the default 10 and 10 work well. For daily commodities, extend the EMA to 14 to 20 periods.
How does Chaikin Volatility compare to ATR and Bollinger Bands?
ATR measures the absolute size of recent bars and is used for stop distance and position sizing. Bollinger Bands display volatility visually as band width around a moving average. Chaikin Volatility isolates the rate of change of volatility itself, which makes it better for timing expansion and contraction phases.
About the authors


Put this into practice
Brokers we have reviewed
Scored on the same five dimensions. Here are three of them — the full list is on the brokers page.



Related articles

Consolidation in Trading: What It Is and How to Trade It
A plain-English guide to consolidation in trading: why price goes sideways, which patterns are worth knowing, and how to trade the eventual breakout without getting whipsawed.

Continuation vs. Reversal Patterns: How to Tell Them Apart and Trade Them
A beginner-friendly guide to continuation vs reversal patterns: definitions, worked examples, stop placement, profit targets, timeframes and indicator confirmation.

Demo to Live Trading Guide: How to Make the Switch Without Blowing Up
Learn how to move from demo to live trading without blowing up. Covers mindset, position sizing, and your first week live.
0 comments