



Trading Strategies · Beginner · 10 min read
How to Trade Momentum Stocks: Entry, Exit, and Risk Rules
The core mechanism: how momentum trading works
Stocks already moving sharply higher tend to keep moving higher for short windows, often minutes to hours, before the buying pressure fades. You buy strength, ride the continuation, then exit before the move reverses. Timing comes from price action, volume, and a few technical indicators.
Momentum trading is a directional strategy that assumes recent winners keep winning over short horizons. A day trader might hold a position for 10 minutes; a swing trader might hold for two days. News, earnings surprises, or sector rotation attract more buyers, which pushes price higher, which attracts more buyers. That loop breaks once fresh demand dries up.
Three ingredients define the strategy.
- Price must be trending.
- Volume must confirm that real money is behind the move.
- And a catalyst, such as an earnings beat, an analyst upgrade, or a sector news event, usually sits behind the strongest moves.
Without volume and a catalyst, an early breakout often fails within the first hour.
According to the FCA, the majority of retail CFD accounts lose money when trading with leverage. That figure sets the tone for everything below: momentum is a high-turnover strategy, and turnover multiplies both edge and cost.
Choosing where to trade matters as much as the strategy; see the best forex brokers and their conditions.
Screening for momentum stocks in real time
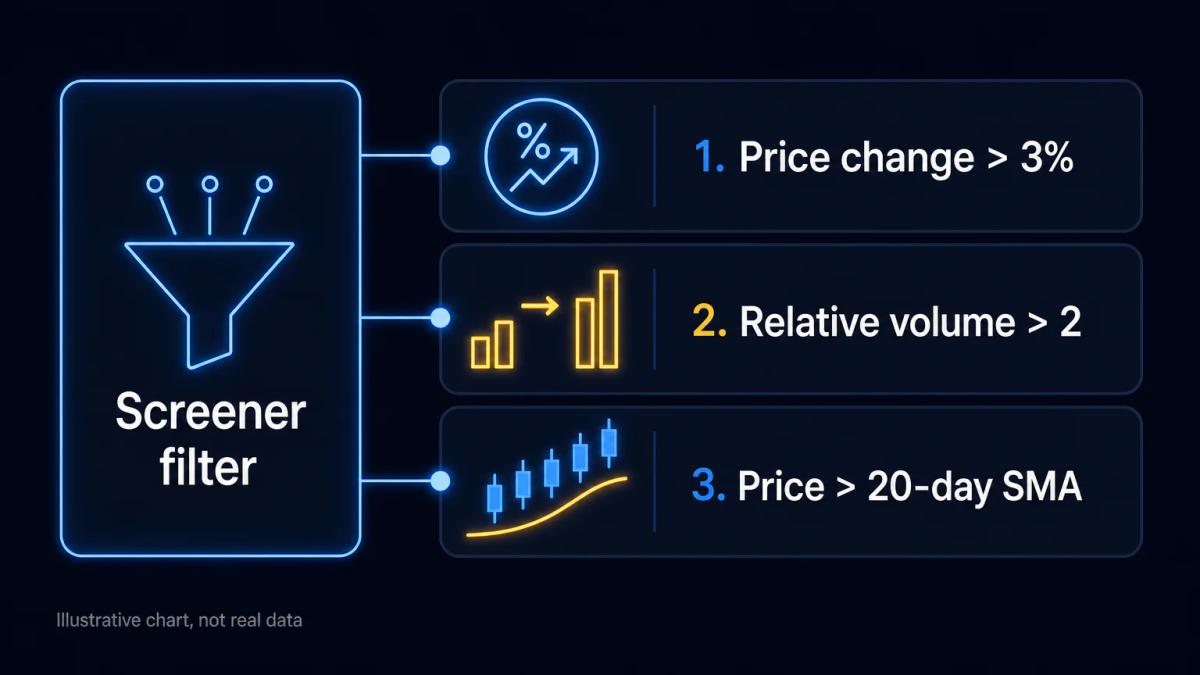
You cannot watch 2,000 tickers at once, so a screener does the work. Free tools like Finviz, paid scanners like Trade Ideas, and the built-in screeners inside most retail brokers all let you rank stocks by percentage change, volume, and technical setup.
A workable pre-market filter for a beginner looks like this: price change greater than 3% on the day, relative volume greater than 2 (meaning the stock is trading at least twice its usual pace), price above the 20-day simple moving average (the average closing price over the previous 20 sessions, acting as a rough trend line), and a minimum average daily volume of 500,000 shares to avoid thin, unpredictable tickers.
| Screener criterion | Beginner setting | What it filters out |
|---|---|---|
| Daily price change | > +3% | Flat, non-trending stocks |
| Relative volume | > 2.0 | Quiet tickers with no fresh interest |
| Price vs 20-day MA | Above | Downtrending stocks |
| Average daily volume | > 500,000 shares | Illiquid names with wide spreads |
| RSI (14) | 60 to 80 | Weak or already exhausted moves |
The Relative Strength Index, or RSI, is an oscillator scaled 0 to 100 that measures how fast price has been rising. Readings above 70 traditionally signal overbought conditions; momentum traders treat 60 to 80 as the sweet spot where a stock is strong but not yet exhausted.
Layer a sector filter on top. If technology is leading the market that day and utilities are lagging, screen momentum candidates inside technology first. This is called relative strength filtering: you trade the strongest names inside the strongest sector rather than isolated single-stock breakouts.
Entry rules: pullbacks versus breakout chasing
Momentum traders use two entry setups, and choosing between them defines your risk profile. A pullback entry means you wait for a rising stock to dip back to a support level, usually a short moving average like the 9-period or 20-period exponential moving average, then buy when it bounces. A breakout entry means you buy the moment price pushes above a previous high or a defined resistance level on strong volume.
Pullbacks carry lower risk because your stop loss sits close to a visible support level. If the stock breaks that support, you know quickly that the setup has failed, and your loss is small. Breakouts catch the fastest part of the move, but if the breakout fails, price often snaps back through your entry, producing a larger loss.
| Entry style | Where you buy | Stop placement | Typical risk |
|---|---|---|---|
| Pullback | At the 9 or 20 EMA on a dip | Just below the moving average | Lower |
| Breakout | 1 to 2 ticks above resistance | Just below the breakout level | Higher |
| Chasing (avoid) | Well above the breakout | Anywhere convenient | Very high |
Chasing is what happens when you buy a stock that has already run 5% and hope it runs 5% more. This is the classic momentum trap. The fix is mechanical: define your entry level before you place the order, and if price has already passed it, skip the trade. There is always another setup within the hour.
On the pullback side, wait for confirmation. A single green candle bouncing off the moving average is worth more than a hopeful buy mid-dip.
Exit signals and profit-taking rules
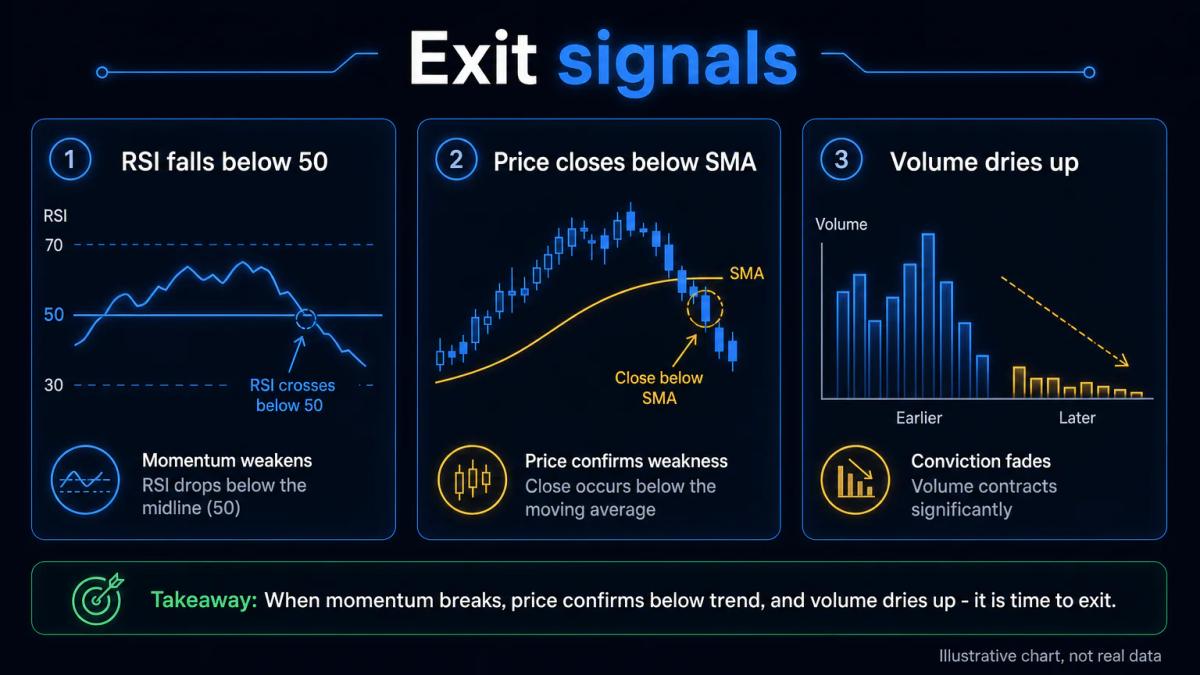
Exits decide whether momentum trading works for you, because entries are only half the trade. Three technical signals typically trigger an exit: RSI falling back below 50, which means upward momentum has flattened; a candle closing below the moving average you used for the entry, which breaks the short-term trend; or a sharp drop in volume, which shows fresh buyers have stopped arriving.
Many day traders also set a hard profit target of 2% to 5% and a time stop. A time stop is a rule that closes the trade if the stock has not moved in your favour within, say, 30 minutes. Momentum is time-sensitive: a stock that refuses to trend within half an hour of your entry probably will not trend at all that session.
Use a partial exit approach to reduce regret. Sell half your position at the first profit target, move your stop loss to breakeven on the remainder, and let the other half run against a trailing stop. A trailing stop is a stop order that automatically adjusts higher as price rises, locking in gains without capping the upside. This structure means you rarely give back a full winner, and you keep a smaller unrealised loss if the move reverses hard.
Position sizing and risk management
Position sizing turns a trading idea into a survivable strategy. The standard rule for retail traders is to risk 1% to 2% of your account on any single trade, where risk is defined as the distance from your entry to your stop loss multiplied by the number of shares.
A worked example: you have a £1,000 account and decide to risk 1% per trade, which is £10. You want to buy a stock at £10.00 with a stop at £9.80, so your risk per share is £0.20. Divide £10 by £0.20 and you can buy 50 shares. If the trade hits your stop, you lose £10, not more. If it works, your upside scales with the move.
| Account size | Risk per trade (1%) | Stop distance | Shares to buy |
|---|---|---|---|
| £1,000 | £10 | £0.20 | 50 |
| £5,000 | £50 | £0.20 | 250 |
| £10,000 | £100 | £0.50 | 200 |
The formula is: shares = (account × risk %) / stop distance. Notice that a wider stop forces a smaller position, which keeps your monetary risk constant across setups. Beginners often make the opposite mistake: they buy a round number of shares first, then place a stop wherever it feels comfortable, and their real risk swings wildly from trade to trade.
Backtesting and validating your momentum system
Backtesting means running your entry and exit rules against historical price data to see how they would have performed. Platforms like TradingView (with its Pine Script strategy tester), MetaTrader 4 (MT4), and dedicated tools like Amibroker let you code the rules once and replay them across years of data.
Aim for at least 100 historical trades before you draw any conclusions. Two numbers matter most: win rate is the percentage of trades that finish in profit, and profit factor is gross profits divided by gross losses; anything above 1.5 is a workable system, and above 2.0 is strong. A momentum system with a 45% win rate and a profit factor of 1.8 is more robust than one with a 70% win rate and a profit factor of 1.1, because the second is one bad losing streak away from breaking.
Always forward-test on a demo account for at least a month before committing real money. Historical data does not include your hesitation, your slow order entry, or the tab you had open when the signal fired.
Execution challenges and real-world slippage
Momentum stocks move fast, which means the price you see is rarely the price you get. Slippage is the difference between your expected fill and your actual fill; on a UK equity, expect 1 to 3 pence of slippage per trade during normal conditions and considerably more around the open or on a news spike.
Three habits reduce execution damage. Use limit orders rather than market orders, so you cap the worst price you will accept. Trade only liquid names with tight bid-ask spreads, because the bid-ask spread (the gap between the highest buy price and the lowest sell price) is a cost you pay on every round trip. Avoid the first five minutes of the session unless you have specifically planned an opening-range trade, because that window carries the widest spreads and the least predictable fills.
Remember tax as well. In the UK, profits from actively trading shares outside an ISA or SIPP are generally subject to Capital Gains Tax, and short holding periods do not qualify for any reduced rate. Keep clean records from day one.
Discipline and emotional control in fast-moving markets
Momentum trading punishes emotion faster than almost any other strategy. Prices move in seconds, missed trades feel expensive, and the fear of missing out (FOMO) pulls you into setups that do not meet your rules. Every experienced momentum trader has blown up an account chasing a runner.
The defence is mechanical. Write your entry criteria, stop loss, and profit target on paper before the session starts. Skip any trade that does not fit; there will be another within the hour. Cap the number of trades per day at 3 to 5 while you build the habit, and stop trading entirely after two consecutive losers to break the tilt cycle.
Compare this with mean reversion, a strategy that buys weakness and sells strength on the assumption that price returns to an average. Mean reversion suits patient temperaments; momentum suits decisive ones. Choose the strategy that matches how you actually react under pressure, not the one that looks best on a chart.
Frequently Asked Questions
What is the difference between momentum trading and swing trading?
Momentum trading focuses on stocks moving sharply right now and typically holds positions for minutes to hours, exiting the same day. Swing trading holds positions for several days to a few weeks and relies more on chart patterns and broader trend structure than on intraday velocity. Momentum is higher turnover and more sensitive to execution costs; swing trading gives you more time to plan each trade.
Can you trade momentum stocks with a small account under £1,000?
You can, but the maths is tight. Risking 1% per trade on a £1,000 account is £10, which forces small share counts and makes commission and spread a large percentage of each trade. Focus on liquid, moderately priced shares, use limit orders to control slippage, and treat the account as a training environment rather than an income source until it grows.
What indicators work best for identifying momentum stocks?
The core toolkit is a moving average (9 or 20 period) to define the short-term trend, the Relative Strength Index (RSI) to gauge how stretched the move is, and relative volume to confirm real interest. Layer a sector strength view on top so you focus on stocks inside leading industries. Avoid stacking six indicators; three well-understood ones outperform a crowded chart.
How much capital do I need to day trade momentum stocks profitably?
There is no fixed threshold, but under £5,000 the ratio of fixed costs (spreads, any commissions, data fees) to profits is unfavourable. Many active traders find £10,000 to £25,000 a workable starting point for UK share trading, because it lets you diversify across trades and absorb losing streaks without breaching your risk-per-trade rules.
Is momentum trading suitable for beginners, or should I learn other strategies first?
Momentum trading is teachable to beginners, but the pace amplifies mistakes. A sensible path is to backtest and paper-trade a defined momentum system for at least two to three months, then start with the smallest position sizes your broker allows. If you find the speed uncomfortable, mean reversion or swing trading may suit your temperament better.
About the authors


Put this into practice
Related articles

Insider Trading: Definition, Laws, and Penalties for Retail Traders
A retail-focused breakdown of insider trading law: Rule 10b-5, material nonpublic information, criminal penalties, prosecuted cases, and how to legally read Form 4 filings.

Is Day Trading Worth It? A Realistic Look at Costs, Risk, and Who Actually Succeeds
A grounded answer to whether day trading is worth it for retail traders: real costs, tax bite, regulatory limits, failure rates and the alternatives.

Option Strategies: A Trader's Guide to Calls, Puts, and Spreads
A plain-English guide to option strategies: how calls, puts, and spreads work, how to price risk and reward, and how to pick one for your outlook.
0 comments