



5 Trading Strategies That Work Across Multiple Asset Classes
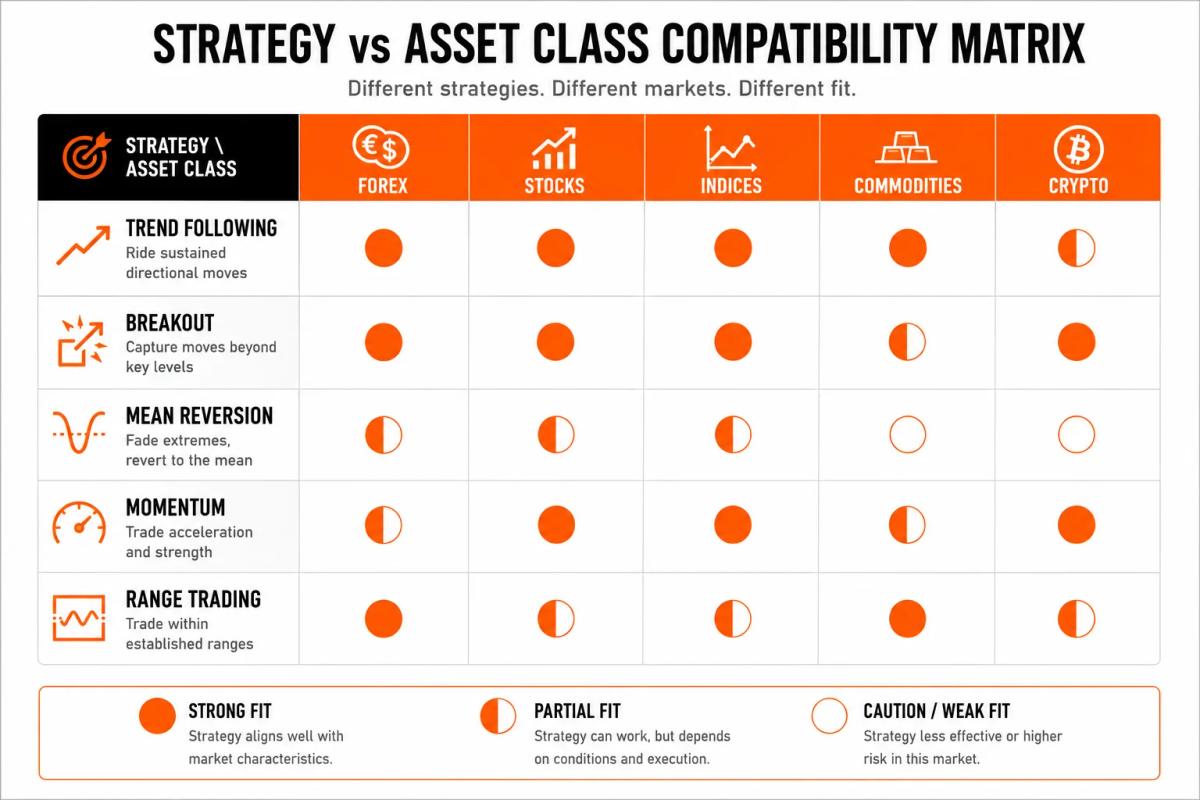
Multi-asset trading strategies are the frameworks that hold up whether you're trading EUR/USD, the S&P 500, gold, or Bitcoin. This guide covers five of them: what makes each one genuinely portable across markets, where each performs best, and where it tends to break down.
Traders who have watched a solid strategy fall apart after moving to a new asset class are usually dealing with a transfer problem. Here's how to fix that.
What Makes a Strategy Truly Multi-Asset?
Most trading strategies were built for a specific market, by traders who lived in that market, and the conditions that made them work were quietly baked in. That's why lifting a strategy from forex and dropping it into commodities often produces results that range from disappointing to expensive.
A strategy that genuinely works across asset classes does so because of price behaviour that shows up wherever human beings are buying and selling.
The Conditions a Strategy Must Meet to Transfer
For a strategy to qualify as a real multi-asset trading strategy, it needs to meet a few baseline conditions:
- It's built on universal price behaviour. Trends, ranges, breakouts, and mean reversion all occur because of supply, demand, and market psychology: forces that exist in every liquid market.
- It can accommodate volatility differences. A strategy that requires tight stops may work on the Nasdaq but blow up on natural gas. The logic must survive scaling.
- It doesn't depend on instrument-specific mechanics. Options Greeks, dividend timing, DeFi yield, and overnight funding quirks are all instrument-specific. A cross-asset strategy can't lean on any of these.
- It works across multiple timeframes. Portability usually comes with timeframe flexibility. Strategies locked to a specific timeframe often reflect one market's liquidity profile more than a universal truth.
Strategies that meet these conditions tend to cluster around five core approaches. Here's how each one travels.
Pick a low-cost broker for this approach from our best forex brokers.
Trend Following
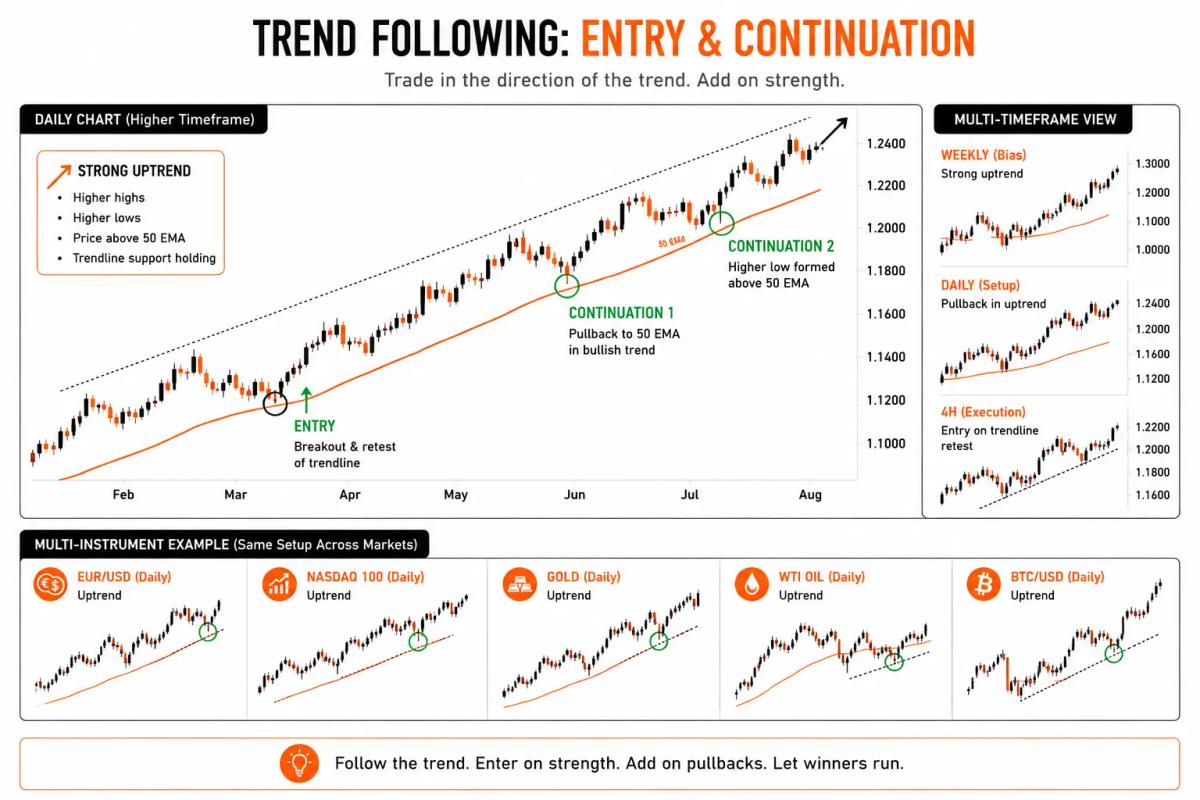
If there's one strategy that has shown up consistently across markets, timeframes, and decades, it's trend following. The premise is simple: prices move in sustained directions, and you want to be on the right side of those moves while they last.
How It Works Across Asset Classes
Trend following identifies an existing direction and participates in it, typically using tools like moving averages, the Average Directional Index (ADX), or a combination of higher highs and higher lows. Entry comes after evidence of a trend, not in anticipation of one.
- In EUR/USD, a trend following system might use a 50-period and 200-period moving average crossover to enter long when short-term momentum aligns with the broader direction.
- In gold, the same crossover logic applies, but the moves tend to be faster and more volatile, so stop placement needs to reflect that.
- In equities, trend following often works better on indices than individual stocks, because indices smooth out company-specific noise.
Best Markets for Trend Following
Trend following performs best in markets with:
- Sustained directional moves: commodities like crude oil and gold are strong candidates, as are major forex pairs during macro-driven periods
- Lower mean-reversion tendency: indices like the S&P 500 have a long-term upward bias that suits trend following on higher timeframes
- Clear macroeconomic drivers: when central banks or geopolitical events create lasting directional pressure, trend following captures it
Crypto markets are technically trend-friendly given their volatility, but the frequency of sharp reversals demands tighter risk management than most other asset classes.
Where It Struggles
Trend following earns its losses in ranging, choppy, or news-driven markets. When price oscillates without committing to a direction, the strategy generates false signals and repeated small losses: a pattern traders call getting chopped up.
This is a real cost of the approach, worth factoring into your expectations before you apply it. Individual stocks during earnings season can be particularly punishing for trend systems.
Breakout Trading
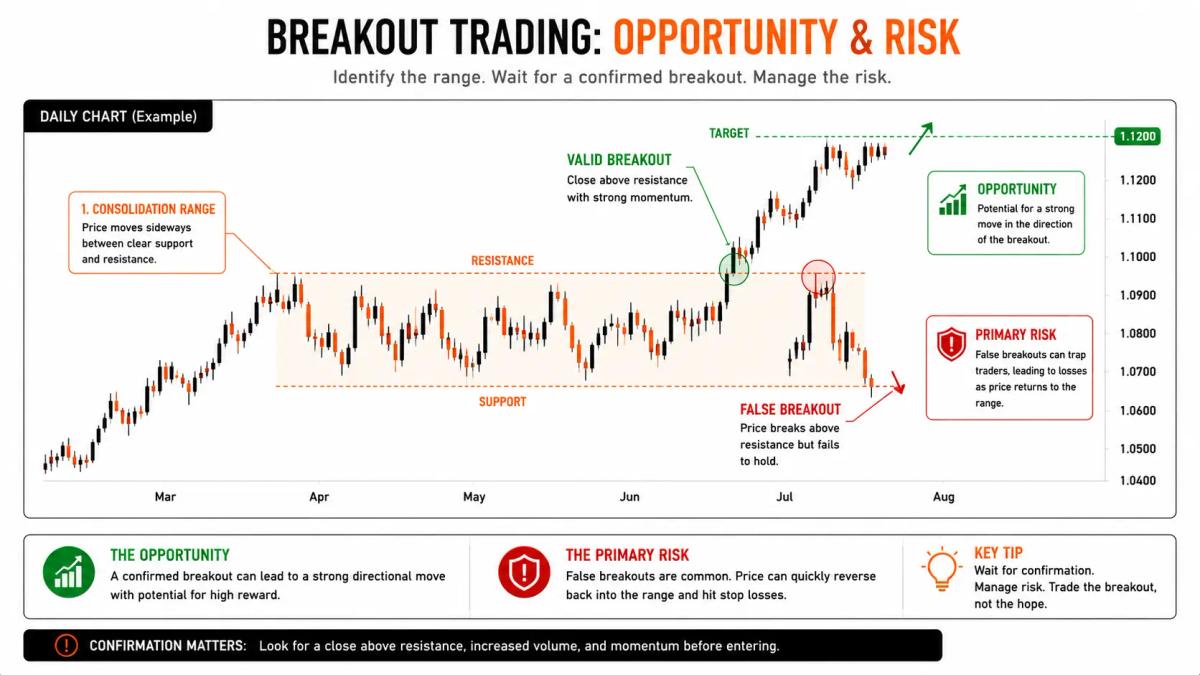
Every period of compression eventually ends. Breakout trading is built on that idea: when price finally escapes a consolidation zone, the move that follows tends to be meaningful. It's one of the more intuitive multi-asset trading strategies, which also makes it one of the most frequently misapplied.
The Core Mechanics
A breakout occurs when price moves decisively beyond a defined level: a range boundary, a triangle, a prior high or low. The trader enters as price clears the level, expecting continuation in the direction of the break. Volume (where available) and the width of the prior consolidation both help confirm whether a break is likely to hold.
Applying Breakouts Across Forex, Indices, and Commodities
The breakout framework carries across markets cleanly because consolidation and expansion are universal market behaviours. A few examples:
- Forex: Asian session ranges on pairs like GBP/USD or USD/JPY often set up London session breakouts.
- Indices: Pre-market ranges on the S&P 500 or Nasdaq frequently produce clean opening breakouts. The range is defined by overnight futures trading; the break happens at the cash open.
- Commodities: Gold consolidations ahead of major economic data releases (US CPI, Federal Reserve decisions) can produce sharp directional breaks when the data lands.
The logic is the same across all three. The trigger and timing differ by market.
False Breakout Risk by Asset Class
False breakouts (where price clears a level briefly before reversing) are a real hazard in every market, but the frequency and cause vary:
- In forex, false breakouts are common around news events when price spikes through levels before snapping back
- In crypto, low liquidity in off-hours can produce breaks that look convincing on a chart but lack real follow-through
- In commodities, thin markets can generate false breaks that large participants actively use to trigger retail stops
Waiting for a close beyond the level, rather than entering on the touch, reduces false breakout exposure. It costs you some entry quality on real breaks, but it filters a meaningful portion of the fakes.
Mean Reversion
Price moves away from equilibrium, then it comes back. Mean reversion is the strategy built on that pull, and when the conditions are right, it can be one of the more consistent approaches available.
The Logic Behind Mean Reversion
Mean reversion assumes that extreme price moves away from an average (a moving average, a Bollinger Band boundary, or an RSI reading above 70 or below 30) tend to correct. The trader fades the extreme, expecting price to return toward its recent centre. RSI and oscillator indicators are the natural tools for identifying these extremes.
The key assumption is that the market in question doesn't have a strong directional bias at the time. Mean reversion works best when price is fundamentally range-bound.
Which Markets Suit It Best
Mean reversion has a natural home in:
- Forex pairs in tight ranges: during low-volatility periods, major pairs often oscillate around a mean rather than trending
- Equity indices during calm, low-volatility environments: indices with strong institutional participation tend to exhibit mean-reverting behaviour over short timeframes
- Commodities with established price anchors: agricultural commodities sometimes have mean-reverting tendencies around historical price bands, though this is highly context-dependent
Why It Fails in Trending Conditions
Applied to a trending market, mean reversion becomes a strategy for fighting the tape. The RSI can stay above 70 for weeks in a strong uptrend. Prices can trade far from their moving average for longer than most mean reversion traders can remain on the right side of the move. The conditions must be right before the strategy makes sense to apply. This is arguably where more traders go wrong with mean reversion than anywhere else.
Momentum Trading
Momentum trading sits in interesting territory between trend following and breakout. It buys the idea that assets moving strongly in a direction tend to continue doing so, at least in the short term.
Momentum Signals Across Asset Classes
Momentum signals are broadly similar across markets: rate of change indicators, relative strength comparisons, and price acceleration metrics all apply.
- In equities, momentum is sometimes measured by comparing an individual stock's performance to the index.
- In forex, it might appear as a currency pair outperforming its peers in a given session.
The common thread is that something is already moving faster than the surrounding market, and the question is whether that relative strength persists. Across commodities, the same logic shows up when crude oil or gold starts moving with unusual speed relative to its recent behaviour.
Timeframe Considerations by Market
Momentum behaves differently depending on the timeframe and the asset:
- Equities and indices tend to show more reliable momentum on daily and weekly timeframes, where institutional flow is the dominant driver
- Forex momentum is often concentrated in specific sessions - the London and New York overlap being the most active - and fades quickly outside those windows
- Crypto momentum can be intense on short timeframes but exhausts faster than most other asset classes, making it more suitable for traders comfortable with rapid exits
Position duration matters here. Momentum traders who hold through the reversal often give back more than they made during the move.
Range Trading
Not every market is going somewhere. A significant portion of price action in most asset classes is lateral: price bouncing between a floor and a ceiling without committing to a direction. Range trading turns that stagnation into a workable setup.
Identifying Range-Bound Conditions
A range is defined by clear support and resistance levels that have been tested and held at least twice. The trader sells near resistance and buys near support, with stops placed outside the range boundaries. The trade thesis is that the boundary holds again.
Range conditions are most reliably identified by:
- Flat or declining ADX readings (below 25 is a common threshold)
- Price oscillating around a flat moving average
- Clear horizontal levels visible on the chart without needing to squint
If you need to adjust your criteria to make something look like a range, it probably isn't one.
Asset Classes Where Ranging Behaviour Is Common
- Forex is one of the better environments for range trading, particularly during the Asian session when major pairs often lack the institutional momentum to break out
- Commodities can exhibit long consolidation periods ahead of supply and demand catalysts (gold before a Federal Reserve meeting, for example)
- Indices during low-volatility, low-news periods sometimes oscillate in defined bands for days or weeks at a time
Crypto is generally a poor environment for range trading because of its tendency toward sudden, sharp moves that breach ranges without warning and don't look back.
How to Adapt Any Strategy When Switching Asset Classes
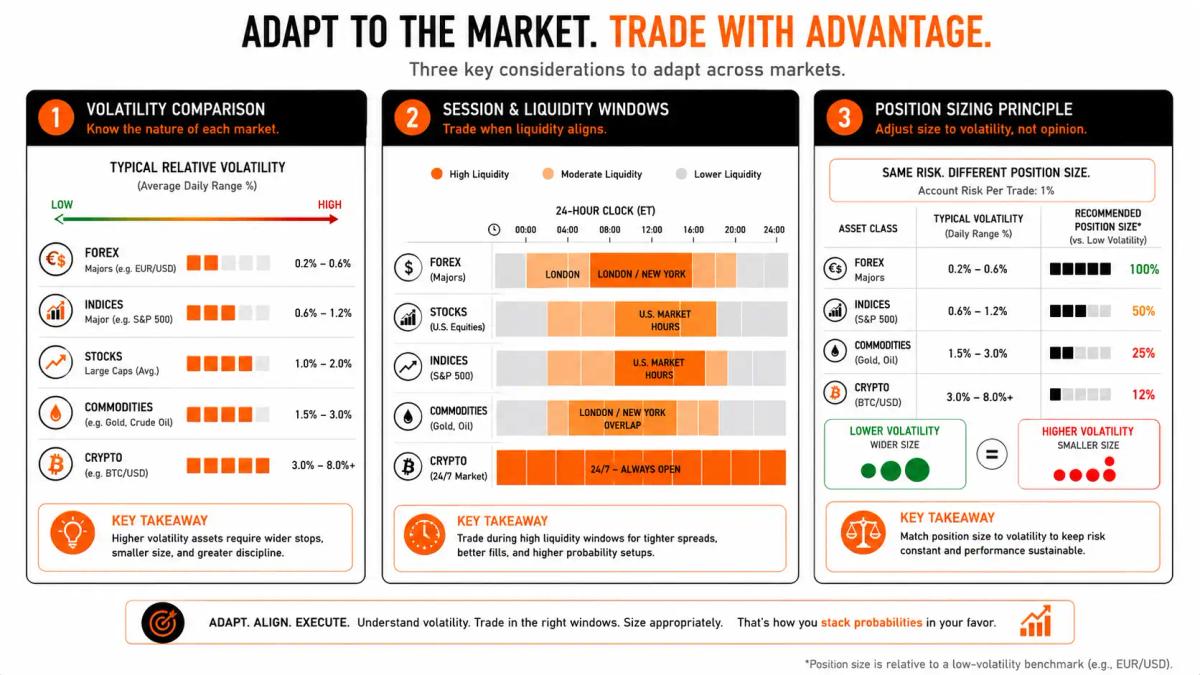
Moving a strategy from one asset class to another without adjusting for the new environment is one of the most reliable ways to lose money while doing everything else right.
Volatility Differences
Different asset classes carry very different volatility profiles. Crude oil and Bitcoin move dramatically more in a typical day than EUR/USD or the S&P 500. If your stop distance, position size, or profit target was calibrated for a low-volatility instrument, applying it unchanged to a high-volatility one exposes you to far greater risk per trade than you intended.
Average True Range (ATR) is a practical tool here. Measure the ATR of your familiar instrument, then measure the ATR of the new one. Scale your stops and targets proportionally.
Session and Liquidity Windows
Liquidity shapes how cleanly a strategy executes. Most technical analysis approaches assume adequate liquidity (enough market participants for price to respond predictably to levels). When liquidity is thin, levels break on low volume, spreads widen, and fills deteriorate.
Key session windows to understand:
- London session (8am-5pm GMT): Highest liquidity in forex; strong for breakout and trend strategies
- New York session (1pm-10pm GMT): Overlaps with London midday; excellent for indices and USD pairs
- Tokyo session (midnight-9am GMT): Lower volume in forex; better conditions for range strategies on JPY pairs
Commodities and crypto trade across sessions but have their own peak liquidity periods worth knowing before you execute.
Position Sizing Adjustments
When you cross asset classes, position sizing is mandatory. A fixed lot size or share count applied across instruments with different volatility and contract values will produce wildly inconsistent risk per trade.
Risk a fixed percentage of your account per trade (1-2% is a common starting point), and let that fixed risk amount determine your position size based on your stop distance. This keeps your risk per trade consistent regardless of what you're trading. Risk management principles for position sizing apply across all asset classes.
Choosing the Right Strategy for Your Setup
The right strategy is the one that fits how you actually trade, not the one that performed best in a backtest on someone else's setup.
A few practical questions worth working through:
- How much time do you have? Trend following and momentum strategies on daily charts require less screen time than range trading on 15-minute charts. Match the timeframe to your schedule.
- What's your tolerance for drawdown? Trend following involves accepting multiple small losses before a large winner. Mean reversion in the right conditions tends to produce more frequent, smaller wins. Your psychology matters as much as the math.
- Which asset class do you know best? Start there. Apply the strategy in your home market first, validate it works for you, then expand to a second asset class using the adaptation framework above.
- What does your broker or prop firm support? Multi-asset access varies significantly by platform. Before planning a cross-asset approach, confirm you have reliable execution and appropriate margin treatment across the instruments you intend to trade. Prop firm comparisons are worth reviewing if you're considering funded account structures for multi-asset strategies.
One final point to be clear about: none of the strategies covered here has a guaranteed outcome. These frameworks have shown consistent logic across multiple markets over time, but past behaviour doesn't tell you what next month will do. Apply any approach with position sizing that reflects your actual risk tolerance, not your optimism about a particular setup.
Frequently Asked Questions
Does a strategy need to be modified when moving from one asset class to another, or can it be applied identically?
The core logic of a strategy can transfer without modification. What must change is the calibration - your stop distances, position sizes, and timing need to reflect the volatility, liquidity, and session behaviour of the new market. Running identical parameters across different asset classes almost always produces inconsistent results.
Which of these five strategies is most suitable for a trader who is new to multi-asset trading?
Trend following is generally the most forgiving starting point. It's directionally clear, works on higher timeframes that reduce noise, and is well-documented across asset classes. It also tends to have natural risk management logic built in - you're with the move or you're out.
How do volatility differences between asset classes affect strategy performance and position sizing?
Higher volatility means larger average price moves, which requires wider stops to avoid premature exits and smaller position sizes to keep risk consistent. A fixed position size applied across instruments with different volatility profiles will expose you to very different actual risk levels per trade, even if the setup looks similar on the chart.
Do you need to trade multiple asset classes at the same time to benefit from a multi-asset approach?
No. Multi-asset awareness is useful even if you focus primarily on one market. Understanding how your chosen asset class relates to others - gold's relationship with USD strength, oil's influence on CAD pairs, for example - adds context that improves your read on the market you're already trading.
How should you backtest a strategy across multiple asset classes before trading it live?
Run the strategy on historical data for each asset class separately, using realistic spread and commission assumptions for each instrument. Look for consistency in the logic rather than optimised results in each market. If a strategy only works well in one asset class after parameter tweaking, it may not be genuinely portable - it may just be curve-fitted to that market's history.
What are the most common mistakes traders make when applying a familiar strategy to an unfamiliar asset class?
The biggest ones are: Keeping the same position size without adjusting for different volatilityIgnoring session and liquidity differencesAssuming that a setup which looked identical on the chart will behave identically in execution The second-biggest mistake is moving to a new asset class before the strategy is thoroughly validated in the original one.
Is correlation between asset classes something to factor into a multi-asset strategy approach?
Yes, and it's worth being aware of even if you don't trade it directly. Asset classes that move together - gold and silver, oil and the Canadian dollar, risk-on equity indices and high-yield currencies - can create hidden concentration in your portfolio if you hold positions across correlated instruments simultaneously. Diversifying across asset classes doesn't automatically diversify your risk if those assets are moving for the same macro reason.
Can these strategies be applied on any timeframe across asset classes?
The core logic holds across timeframes, but the optimal timeframe varies by market. Trend following on 15-minute charts in forex behaves very differently from trend following on daily charts in equities. Liquidity, news sensitivity, and the typical duration of a move all influence which timeframe makes sense for a given strategy in a given market. Start with a timeframe that suits your available trading time, then assess whether the strategy's signals are clean at that resolution in the specific instrument you're trading.
About the authors


Put this into practice
Brokers we have reviewed
Scored on the same five dimensions. Here are three of them — the full list is on the brokers page.



Related articles
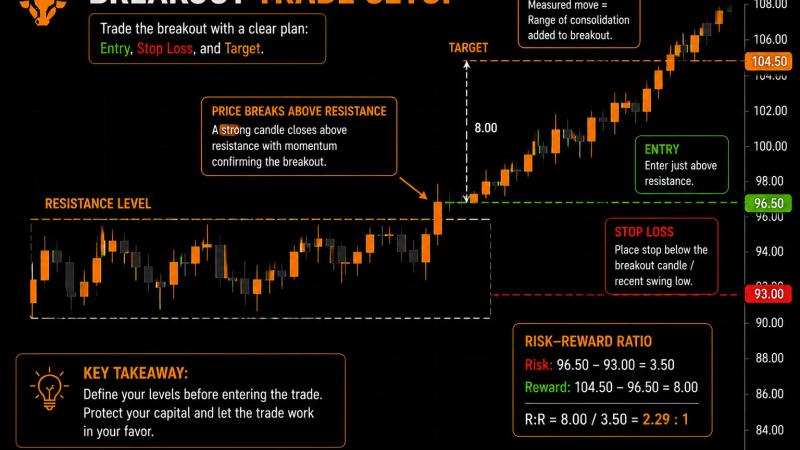
Breakout Trading Strategy: How to Identify Real Breaks From False Ones
Learn the breakout trading strategy and how to spot real breaks from false ones using volume, confirmation, and clean entry rules that protect your capital.
Algorithmic Trading Guide: Strategies, Software & How to Get Started
Learn in this algorithmic trading guide how it works, explore strategies, compare platforms, and follow a step-by-step framework to build your first algorithm.
Arbitrage Trading Guide: What It Is, How It Works, and Key Strategies
Arbitrage trading guide: Learn what it is, how it works, key strategies like crypto and merger arbitrage, and whether retail traders can realistically profit.
0 comments