



Technical Analysis · Beginner · 8 min read
Continuation vs. Reversal Patterns: How to Tell Them Apart and Trade Them
The core difference: momentum pause versus trend exhaustion
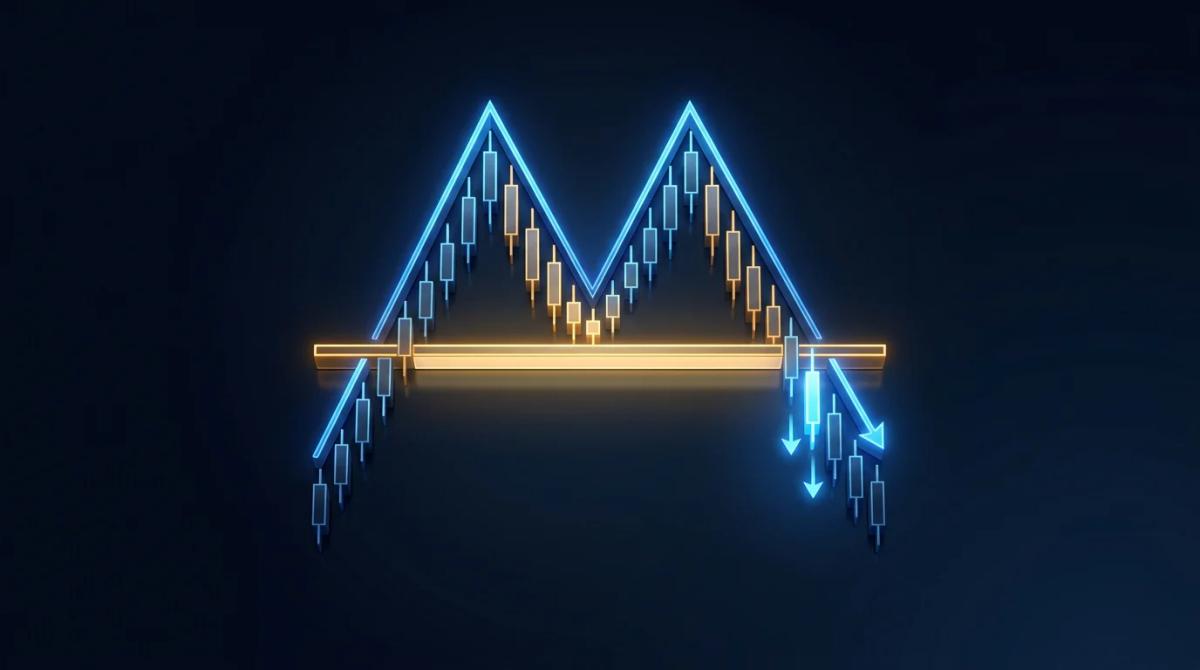
Continuation and reversal patterns split into two families based on what price does after the pattern completes.
- Continuation patterns signal a pause in an existing trend before it resumes in the same direction.
- Reversal patterns signal that the current trend has run out of buyers or sellers and is about to change direction.
The distinction is not visual, it is behavioural: same shape, different context.
Context is set by the trend that leads into the pattern. A flag that forms after a sharp rally is a continuation setup because the prior move is intact. A double top that forms at the end of that same rally is a reversal setup because the second peak fails to make a new high. Before you name any pattern, name the trend it sits inside. That single habit filters out most of the confusion between the two families and keeps your trade thesis honest.
If you still need a broker, our guide to the best forex brokers compares the regulated options side by side.
Continuation patterns: flags, pennants, and triangles

Continuation patterns form when price consolidates in a tight range after a strong directional move, then breaks out in the same direction. The consolidation represents traders taking profit and new participants positioning before the next leg. The three most common shapes are flags, pennants and symmetrical triangles.
- A flag is a small rectangular consolidation that slopes gently against the prior trend. After a strong up-move (called the flagpole), price drifts down between two parallel lines for a handful of bars before breaking upward.
- A pennant is similar but the lines converge, forming a small symmetrical triangle.
- A symmetrical triangle on a larger scale is a longer consolidation where highs get lower and lows get higher, and price coils until it breaks out.
A bullish continuation pattern shares three features you can check on any chart:
| Feature | Flag | Pennant | Symmetrical triangle |
|---|---|---|---|
| Prior trend | Strong, near vertical | Strong, near vertical | Clear directional move |
| Shape | Parallel channel | Converging lines, short | Converging lines, longer |
| Typical duration | 5 to 15 bars | 5 to 15 bars | 15 to 50 bars |
| Volume during pattern | Declining | Declining | Declining |
| Breakout direction | With prior trend | With prior trend | Usually with prior trend |
If volume rises on the breakout candle and the close is beyond the pattern boundary, the continuation thesis is intact. If the breakout happens on flat volume, treat it as unconfirmed.
Reversal patterns: head and shoulders, double tops, and double bottoms
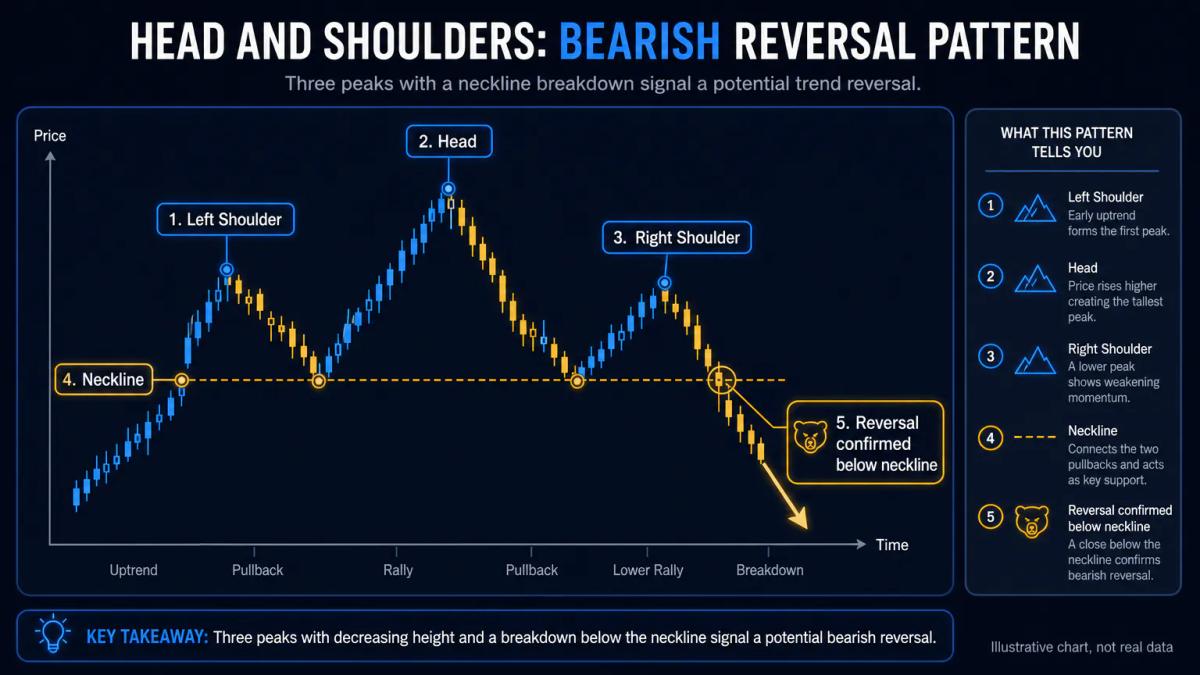
Reversal patterns emerge when price fails to sustain the current trend and starts to turn.
- A head and shoulders forms at the end of an uptrend: price makes a peak (left shoulder), pulls back, makes a higher peak (head), pulls back to a similar low, then makes a lower peak (right shoulder). The line connecting the two pullback lows is the neckline. When price closes below the neckline, the reversal is confirmed.
- A double top forms when price rallies to a resistance level (a price ceiling that has rejected buyers before), pulls back, rallies again to roughly the same level and fails. The pattern completes when price closes below the pullback low between the two peaks.
- A double bottom is the mirror image at the end of a downtrend, and it is the classic bullish reversal pattern: two tests of the same support level (a price floor that has rejected sellers before), followed by a close above the intervening high.
| Pattern | Trend before | Confirmation trigger | Implied direction |
|---|---|---|---|
| Head and shoulders | Uptrend | Close below neckline | Down |
| Inverse head and shoulders | Downtrend | Close above neckline | Up |
| Double top | Uptrend | Close below middle low | Down |
| Double bottom | Downtrend | Close above middle high | Up |
The common failure mode is calling a reversal early. Two peaks at the same level are not a double top until price closes below the pullback low that separates them. Until that close prints, the pattern is a candidate, not a signal.
Support, resistance, and breakout confirmation
Both families rely on support and resistance to define their boundaries. Support is a price where buyers have historically stepped in; resistance is where sellers have. A pattern's edges are almost always drawn between recent supports and resistances, which is why the breakout of that edge carries weight: it means one side of the balance has given up.
- A valid breakout has three ingredients: a candle close (not a wick) beyond the boundary, above-average volume on that candle, and no immediate reversal on the next one or two bars.
- A false breakout, sometimes called a fakeout, pierces the level intraday but closes back inside the pattern.
The simplest filter is to wait for the candle to close before acting, and to require the close to sit at least a fraction of the recent range beyond the level rather than exactly on it.
Stop loss and profit target placement for each pattern
Stop placement follows the pattern's own geometry. A stop loss is a resting order that closes your position at a defined loss if price moves against you.
For continuation patterns, place the stop just beyond the opposite boundary of the consolidation.
- Long a flag breakout to the upside: stop below the lower flag line.
- Short a bearish pennant breakout: stop above the upper pennant line.
For reversal patterns, place the stop beyond the extreme that failed.
- Short a head and shoulders: stop above the right shoulder.
- Long a double bottom: stop below the lower of the two lows.
Profit targets are usually measured from the pattern's height.
- For a flag or pennant, measure the flagpole and project the same distance from the breakout point.
- For a symmetrical triangle, measure the widest part of the triangle and project it from the breakout.
- For a head and shoulders, measure the vertical distance from the head to the neckline and project that distance down from the neckline break.
- Double tops and bottoms use the distance from the peaks (or troughs) to the middle pivot, projected from the confirmation point.
These are reference targets: many traders scale out at the measured objective and trail a stop for the remainder.
Timeframe selection and pattern reliability
Patterns form on every timeframe, from one-minute charts to weeklies, but longer timeframes carry more weight. A head and shoulders on a daily chart involves weeks of trading activity and thousands of participants; the same shape on a 5-minute chart may involve minutes of order flow driven by a single news release. More participants and more time equal a more meaningful consensus.
A practical approach is to identify the pattern on your trading timeframe and check the timeframe one step higher for context. If you trade the 1-hour chart, confirm the trend on the 4-hour. If the higher timeframe agrees with the pattern's implied direction, the setup is stronger. Short timeframes generate more patterns but also more false signals because intraday noise routinely breaks and rebuilds small formations. Reliability is not about picking the perfect timeframe, it is about matching your pattern to a timeframe where the noise is small relative to the pattern's size.
Combining patterns with technical indicators for confirmation
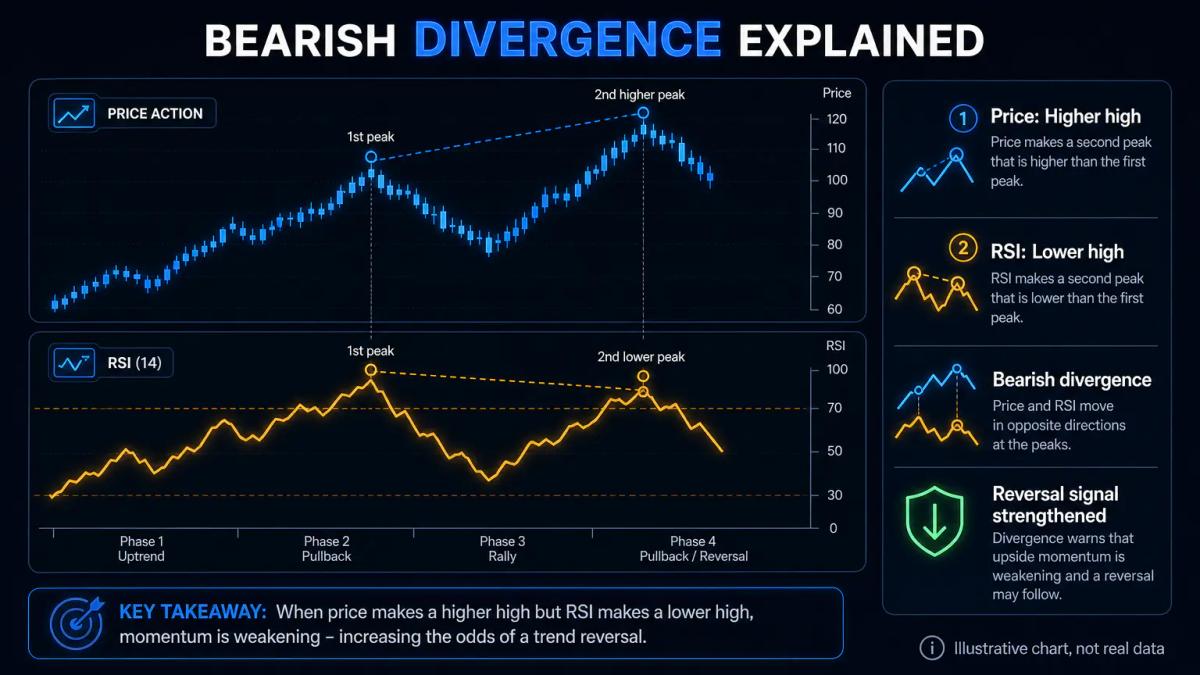
Patterns pair well with momentum and volume tools that describe the strength behind price.
The Relative Strength Index, or RSI, measures the speed of recent price changes on a 0 to 100 scale; readings above 70 suggest overbought conditions and below 30 suggest oversold. When price makes a higher high at a potential double top but RSI makes a lower high, that is a bearish divergence and it strengthens the reversal case.
The MACD (Moving Average Convergence Divergence) plots the difference between two moving averages and a signal line; a crossover in the direction of a continuation breakout supports momentum resumption. Volume is the most direct confirmation: a breakout on volume clearly above the recent average is more credible than one on flat volume.
FCA (Financial Conduct Authority): The majority of retail CFD accounts lose money when trading CFDs, and firms must display this risk warning prominently to retail clients.
Use indicators as a filter. The pattern defines the setup; the indicator votes yes or no on the strength behind it.
Frequently Asked Questions
What are continuation patterns, and what are some common examples?
Continuation patterns are consolidations that appear during a trend and typically break out in the same direction as the prior move. The most common examples are flags (rectangular pauses after a sharp move), pennants (small converging triangles) and symmetrical triangles (longer coils where highs get lower and lows get higher). Volume usually declines during the pattern and expands on the breakout.
What are reversal patterns, and how do they differ from continuation patterns?
Reversal patterns form at the end of a trend and signal a change of direction rather than a pause. The classics are head and shoulders (three peaks with a lower centre neckline break), double tops and double bottoms (two failed tests of the same level). The difference from continuations is behavioural: reversals require a failed new extreme and a close through a defined confirmation level in the opposite direction.
How do you identify a false breakout from a genuine pattern completion?
A genuine breakout closes a full candle beyond the pattern boundary, prints above-average volume on that candle and does not immediately return inside the pattern. A false breakout, or fakeout, pierces the level intraday, closes back inside and often reverses sharply on the next bar. Waiting for the candle to close and requiring the close to sit clearly beyond the level filters most fakeouts.
What is the best timeframe to trade continuation and reversal patterns?
There is no single best timeframe, but longer timeframes produce more reliable patterns. Daily and 4-hour charts filter out intraday noise, while 5-minute charts generate frequent signals with a higher false-positive rate. A common approach is to trade the pattern on your operating timeframe and confirm the trend one timeframe higher, so that both scales agree on direction.
How should you calculate profit targets based on chart pattern size?
The standard method is to measure the pattern's height and project it from the breakout point. For a flag or pennant, use the flagpole. For a symmetrical triangle, use the widest part of the triangle. For a head and shoulders, measure from the head to the neckline and project down from the neckline break. For double tops or bottoms, measure the distance from the extreme to the middle pivot.
About the authors


Put this into practice
Brokers we have reviewed
Scored on the same five dimensions. Here are three of them — the full list is on the brokers page.



Related articles

Demo to Live Trading Guide: How to Make the Switch Without Blowing Up
Learn how to move from demo to live trading without blowing up. Covers mindset, position sizing, and your first week live.

Does Technical Analysis Work? What the Evidence Actually Shows
Technical analysis is treated like gospel by traders and dismissed as astrology by academics. The honest answer sits somewhere in between, and it has real consequences for your money.

Double Top and Double Bottom Pattern: Identification, Entry Rules and Risk Management
A trader's guide to double top and double bottom patterns: neckline confirmation, volume rules, timeframe selection, stop placement and false-signal filters.
0 comments