



Technical Analysis · Beginner · 9 min read
Does Technical Analysis Work? What the Evidence Actually Shows
The honest answer: technical analysis works sometimes, but not how you think
Charts genuinely help some traders locate price patterns, support levels (a price where buyers have historically stepped in) and resistance levels (a price where sellers have historically capped rallies) that shape short-term trades. Most academic work, though, finds that the same tools fail to consistently forecast where prices go next, and they tend to underperform a simple buy-and-hold return for retail traders once spreads and commissions are subtracted.
That gap between what technical analysis promises in YouTube tutorials and what it delivers in audited trading accounts is where you lose money. The tool is real, the patterns exist, and skilled short-term traders extract genuine value from them. The complication is that the pattern-spotting brain that lets you see a head-and-shoulders formation is the same brain that sees faces in clouds, and without a way to tell those apart you end up trading noise and paying spreads to do it.
Where you trade shapes your results almost as much as how you trade; see the best forex brokers and their conditions.
What technical analysis actually claims to do
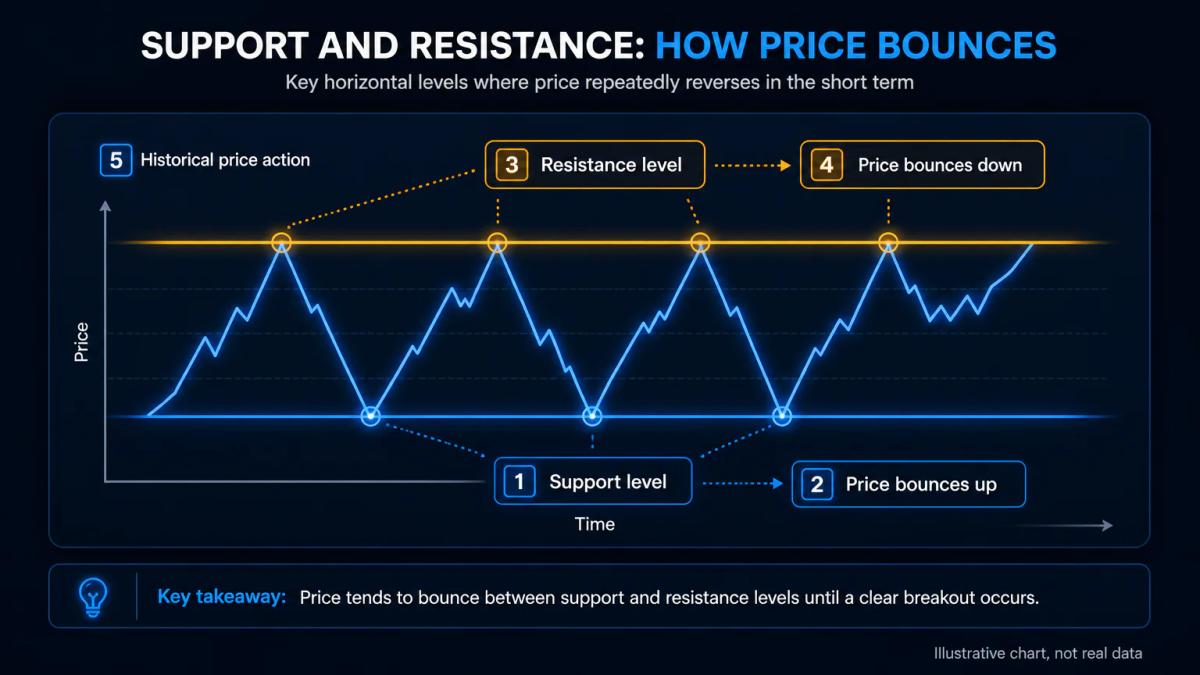
Technical analysis assumes that historical price movements, chart patterns and trading volume (the number of contracts or shares traded in a period) contain useful information about where price is heading next. Traders who use it look at charts to find entry and exit points, and they ignore company fundamentals, macro data and news except where price already reflects them.
The underlying claim is stronger than it might first sound. It says price alone contains enough information, because price already reflects every buyer's and seller's opinion, budget and fear. From that premise flow the familiar tools you have almost certainly come across:
- Moving averages, meaning an average of recent closing prices.
- The relative strength index or RSI, a momentum gauge from 0 to 100.
- MACD, which compares two moving averages to flag shifts in momentum.
- Fibonacci retracements, used to project possible pullback levels.
- Candlestick patterns, which read short sequences of open, high, low and close.
- Trendlines drawn to link successive highs or lows.
Each tool is essentially a rule for turning past prices into a signal, and whether those signals carry information or simply repackage the same random walk into a shape your brain recognises is the empirical question.
Why the research is mixed and what it actually proves
Academic studies on technical analysis produce genuinely conflicting results, and that inconsistency itself is the finding. Some papers document statistically significant returns from moving-average and momentum rules in specific markets and periods, particularly in foreign exchange and emerging markets during the 1980s and 1990s. Others, using stricter transaction-cost assumptions and out-of-sample tests, find that the same rules stop working, sometimes decades before they were published.
The pattern that emerges from the literature is one of fragility rather than fakery. Rules that worked in one decade, one market and one liquidity regime often stop working in the next, and when you subtract realistic spreads, commissions and slippage (the difference between the price you expected and the price you got), whatever edge remained frequently disappears altogether.
The honest summary runs roughly like this: in efficient, deep markets such as large-cap US equities, published tests generally find that mechanical technical rules fail to beat a passive index net of costs over long horizons. In less efficient corners, certain rules have shown some persistence, though nothing seems to survive publication forever. If you build your strategy on a paper you found online, it is safest to assume the edge is already gone or was never robust to begin with. The strongest regulator-published data on retail trading outcomes, from the FCA in the UK and ESMA in the EU, consistently shows that a large majority of retail CFD accounts lose money, whichever method those traders say they use.
The role of self-fulfilling prophecy and market psychology
One reason technical analysis appears to work in the short term has little to do with the future being encoded in past prices, and much more to do with the fact that millions of traders are watching the same lines. When enough participants place stop losses just below an obvious support level, price piercing that level triggers a cascade of selling, and the level becomes real precisely because everyone acted as if it already were.
The 200-day moving average is the clearest example of this dynamic. No law of physics makes 200 days special, yet because so many institutional and retail traders react to a break of that line, the break itself generates the follow-through it was supposed to predict. Round numbers behave in a similar way, as you can see with prices such as gold at $2,000, the S&P 500 at 5,000 or EUR/USD at 1.10.
This is a real effect and one you can trade, though it remains an unstable one. Self-fulfilling patterns keep working until the crowd changes its focus, until high-frequency algorithms front-run the retail reaction, or until a large news event overwhelms the technical setup entirely. Treating a self-fulfilling pattern as though it were a physical law is how traders get destroyed when the pattern eventually fails, because they sized the trade on the assumption that the signal was reliable.
Common mistakes that make technical analysis appear to work when it does not
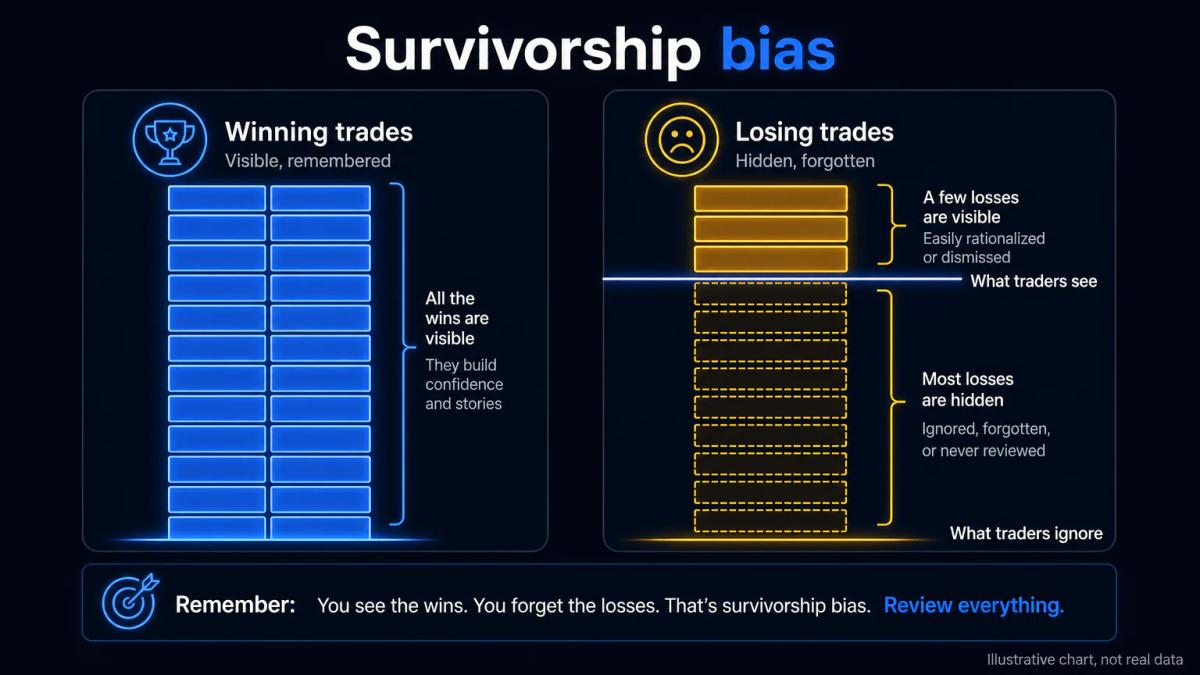
The reason so many traders believe technical analysis is a settled winning method is that human cognition is built to see winners and forget losers. Three specific biases do most of the damage, and recognising them in your own trading is more valuable than any indicator.
Survivorship bias means you see the trader on social media who called a top with a trendline, not the ten thousand who drew the same line and were wrong. Confirmation bias means you notice the flag pattern that broke out as predicted and forget the three that failed last week. Curve-fitting, sometimes called overfitting, is the technical form: you tune a strategy on historical data until it looks perfect on the past, then discover it makes nothing on new data because you fitted noise, not signal.
| Bias | What it looks like at the chart | What it costs you |
|---|---|---|
| Survivorship | You only see winning setups shared online | You overestimate win rates by a wide margin |
| Confirmation | You notice patterns that agreed with your view | You size positions on evidence you filtered |
| Curve-fitting | Backtest is stellar, live results are flat or negative | You trade a strategy that never had an edge |
| Recency | The last three trades feel like the base rate | You abandon a good system or double down on a bad one |
Distinguishing a genuine pattern from random noise requires out-of-sample testing (running your rules on data you did not use to design them) and a large enough sample of trades to be statistically meaningful. A strategy with twelve trades is a story, not evidence.
How to use technical analysis without fooling yourself
If you choose to use technical analysis, treat it as one input into a decision, not a prediction. The traders who extract value from charts do it inside a framework that assumes any single signal is wrong roughly half the time.
Start with a written plan. Define the setup in words: the pattern, the timeframe, the confirmation, the invalidation. Define the position size as a percentage of account equity, not a number of contracts. A common rule is to risk no more than 1% of your account on a single trade, so a $10,000 account risks $100 per trade, and the stop-loss distance in pips determines the position size, not the other way around. A pip is the smallest standard price move in a currency pair, typically 0.0001 for most majors.
Backtest on a long enough period to include a bear market and a range-bound market, and reserve at least a third of the data for out-of-sample testing. Track every trade in a journal with the entry, the stop, the target, the outcome and, honestly, the reason you took it. After 100 trades, compare your net return with what a passive buy-and-hold would have delivered over the same period. If you are behind, the indicators are not the problem; the strategy is.
Finally, respect leverage caps. As of the FCA's product intervention rules, UK retail clients can access maximum leverage of 1:30 on major forex pairs, 1:20 on major indices and 1:5 on individual equities, and CFDs on cryptoassets are prohibited for UK retail. Those caps exist because higher leverage magnifies both signal and noise.
Technical analysis versus fundamental analysis: which one matters more
Fundamental analysis examines company earnings, cash flow, balance sheets, industry position and macroeconomic data to estimate what an asset is worth. Technical analysis ignores all of that and studies price and volume. The two approaches answer different questions, and treating them as competitors is a category error.
Fundamentals dominate over long horizons. If a company grows earnings for a decade, the share price follows, regardless of chart patterns. Technicals dominate over short horizons because in a five-minute window, no fundamentals have changed, and price is moved by order flow, sentiment and positioning. A long-term investor who ignores fundamentals is guessing; a day trader who ignores technicals is trading without seeing the current price. Neither method guarantees profit, and neither is a substitute for position sizing and a stop-loss.
The bottom line: does technical analysis work for you
Technical analysis works as a tool for structuring entries, exits and risk on short-term trades. It does not work as a crystal ball, and no combination of indicators turns a losing trader into a winning one. The traders who profit from charts do so because they are disciplined about position size, honest about their track record and sceptical of their own conviction.
If you want to use technical analysis, learn it properly, test it out of sample, size your trades small and benchmark yourself against buy-and-hold. Your edge is behaviour, not the moving average.
Frequently Asked Questions
Can you make money using technical analysis alone?
Some traders do, particularly in short-term timeframes where fundamentals are effectively constant. The catch is that regulator-published data from bodies like the FCA and ESMA consistently shows a large majority of retail CFD accounts lose money, whichever method they use. Technical analysis alone, without disciplined position sizing and a stop-loss, is not an edge; it is a decision-making framework that still needs risk management on top.
Why do some traders swear by technical analysis if the research says it does not work?
Two reasons. First, self-fulfilling prophecy: obvious levels and patterns move price because a crowd trades them, so the shorter your timeframe, the more real that effect feels. Second, survivorship and confirmation bias: traders remember the setups that worked and forget the ones that failed, so their personal experience overstates the reliability of the method. Both can be true at once: the tool has some usefulness, and its users overestimate that usefulness.
What is the difference between technical analysis and gambling?
Gambling has a fixed, negative expected value set by the house edge. Technical trading has an unknown expected value that depends on your rules, your costs and your discipline. The overlap is behavioural: without position sizing, without a written plan and without honest record-keeping, technical trading behaves like gambling because the outcomes are driven by chance and emotion rather than a tested edge.
Should I learn technical analysis before I start trading?
Yes, but learn it alongside risk management, not before it. Understanding what a support level, a moving average or an RSI reading means will help you read the market and communicate with other traders. Learning to size a position at 1% of equity, place a stop-loss at a technical invalidation and journal your trades matters more for your survival than any specific indicator.
About the authors


Put this into practice
Related articles

Double Top and Double Bottom Pattern: Identification, Entry Rules and Risk Management
A trader's guide to double top and double bottom patterns: neckline confirmation, volume rules, timeframe selection, stop placement and false-signal filters.

Fibonacci Retracement Explained: Levels, Setup, and Trading Rules
A working guide to Fibonacci retracement: how to draw it, which levels matter, and how to combine it with risk rules and other indicators without over-relying on the tool.

Head and Shoulders Pattern Trading: Structure, Entry, and Risk Management
A structural guide to head and shoulders pattern trading: identification, neckline breakouts, false-break filters, inverted variant, and position sizing tied to pattern dimensions.
0 comments