Technical Analysis · Intermediate · 6 min read
Head and Shoulders Pattern Trading: Structure, Entry, and Risk Management
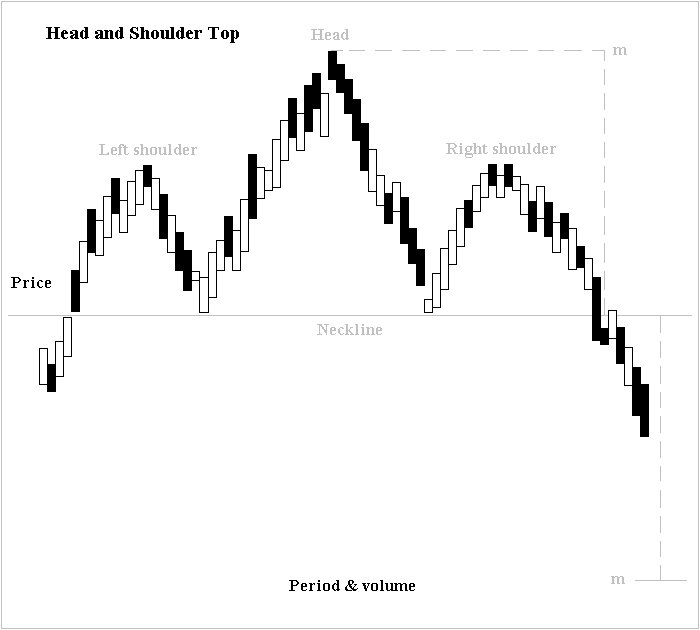
Head and shoulders pattern trading is a reversal strategy that shorts (or exits longs) when price breaks the neckline connecting the two troughs of a three-peak formation. The middle peak (the head) is highest; the left and right shoulders are lower and roughly symmetrical. A confirmed close below the neckline on rising volume signals a probable trend reversal from up to down.
What is the head and shoulders pattern and how do you trade it
The head and shoulders pattern is a bearish reversal formation with three peaks: a left shoulder, a taller head, and a right shoulder of similar height to the left. A neckline connects the two intermediate troughs. You enter short on a confirmed close below the neckline, place your stop loss above the right shoulder, and project a target equal to the head-to-neckline distance measured downward from the breakout.
The pattern works because it visualises a market where buyers made a lower high after an exhausted push (the head), and sellers then broke structural support. You use it to exit long positions before a larger move or to position short with a defined risk envelope.
Pattern structure: identifying shoulders, head, and neckline
Here's how to identify a head and shoulders pattern:
- The left shoulder forms when an existing uptrend rallies to a local peak and pulls back to a trough.
- The head is the next rally, which exceeds the left shoulder peak before retracing to a similar trough.
- The right shoulder is a third rally that fails to reach the head's high and stalls near the left shoulder's level.
- The neckline connects the two troughs and acts as the confirmation line.
A neckline can be horizontal or sloped: a downward-sloped neckline usually gives an earlier, more aggressive entry but a slightly weaker signal, while an upward-sloped neckline delays entry and demands a more decisive break.
Symmetry between the two shoulders in height and time width increases pattern reliability. Asymmetric shoulders, or a right shoulder that overlaps the head, weaken the setup. Understanding support and resistance trading helps you recognise how the neckline functions as a key structural level.
Entry signals: neckline breakout and confirmation rules
Entry occurs on a candle that closes below the neckline with volume above its 20-period average, a filter that separates conviction from noise.
Many traders split the entry into two tranches: half on the breakout close, half on a retest of the neckline from below that holds as resistance. The retest reduces exposure to whipsaws (fast reversals that trap breakout traders) but sacrifices roughly a third of trades that never retest and continue lower directly.
On daily charts, a full-body bearish candle closing at least 0.3 to 0.5% below the neckline is a common threshold; on 4-hour charts, use ATR-based filters (a close beyond one ATR-14 below the neckline) rather than fixed percentages.
This approach mirrors the discipline used in breakout trading strategy to distinguish real breaks from false ones.
Stop loss placement and price target calculation
Stop loss sits above the right shoulder peak, offset by 5 to 10 pips on major forex pairs or by 0.5 ATR on equities and indices to absorb normal noise. Price target is derived by measuring the vertical distance from the head peak to the neckline, then projecting that distance downward from the breakout point.
This produces a 1:2 or better risk-to-reward on most clean setups. Trades where the projection sits below a stronger structural level should have the target trimmed to the nearest support.
Filtering false breakouts and timeframe selection
False breakouts happen when price pierces the neckline intrabar but closes back inside the pattern.
Three filters cut most of them:
- Require a full candle close beyond the neckline.
- Demand volume above the 20-period average.
- Reject setups where the right shoulder overlaps the head.
Daily and 4-hour patterns reflect institutional positioning and show higher follow-through than 5-minute or 1-minute patterns, where noise dominates. Avoid the pattern on low-liquidity assets and during the Asian session on non-JPY forex pairs.
Combining head and shoulders with technical analysis tools such as moving averages or the RSI can help filter out low-probability setups.
Position sizing and risk management for head and shoulders trades
Position size is a function of stop distance, not pattern size. Fix your risk per trade at 1 to 2% of account equity, then compute lots from the pip distance between entry and stop. According to the FCA (2024), between 74 and 89% of retail CFD accounts lose money, and oversized positions on wide patterns are a recurring cause.
Wider patterns need smaller positions to keep risk constant. UK retail clients face FCA leverage caps of 1:30 on major forex, 1:20 on indices, and 1:5 on equities; CFDs on cryptocurrencies are prohibited for UK retail. Size to your stop, never to available leverage.
Learn more about position sizing in trading to master this critical skill.
Frequently Asked Questions
How do you distinguish a head and shoulders pattern from a triple top?
A triple top has three peaks at roughly the same price level, whereas a head and shoulders has a distinctly higher middle peak (the head) flanked by two lower, roughly symmetrical shoulders. Both are bearish reversals, but the head and shoulders projects a target from the head-to-neckline distance, while a triple top projects from the resistance level to the intervening low.
What volume pattern should you see during a valid head and shoulders formation?
Volume is typically highest on the left shoulder, lower on the head, and lowest on the right shoulder, reflecting fading buying conviction. On the neckline breakout, volume should spike above the 20-period average. Weak or declining volume on the break is a common precursor to a false breakout and warrants waiting for a retest before entering.
Can you trade head and shoulders patterns on cryptocurrency and stock indices, or only forex?
The pattern appears across all liquid markets: forex majors, indices, equities, futures, and cryptocurrencies. Note that UK retail clients cannot trade crypto CFDs (FCA prohibition), so crypto head and shoulders setups must be executed on the spot market via an authorised exchange, not through a CFD broker.
How often do head and shoulders patterns result in a successful breakout versus a false break?
Public reliability figures vary widely by source and are not standardised across timeframes, so treat any specific percentage with caution. In practice, filtering for volume confirmation, full-candle closes beyond the neckline, and daily or 4-hour timeframes materially reduces false-break exposure compared with intraday setups on low-liquidity assets.
Should you enter at the neckline break or wait for a retest before opening a position?
Both are valid. A break entry captures the full move but exposes you to whipsaws; a retest entry improves reliability but misses trades that never retest. A common compromise is to enter half the position on the breakout close and add the remainder on a confirmed retest that holds the neckline as resistance.
About the authors


Related articles
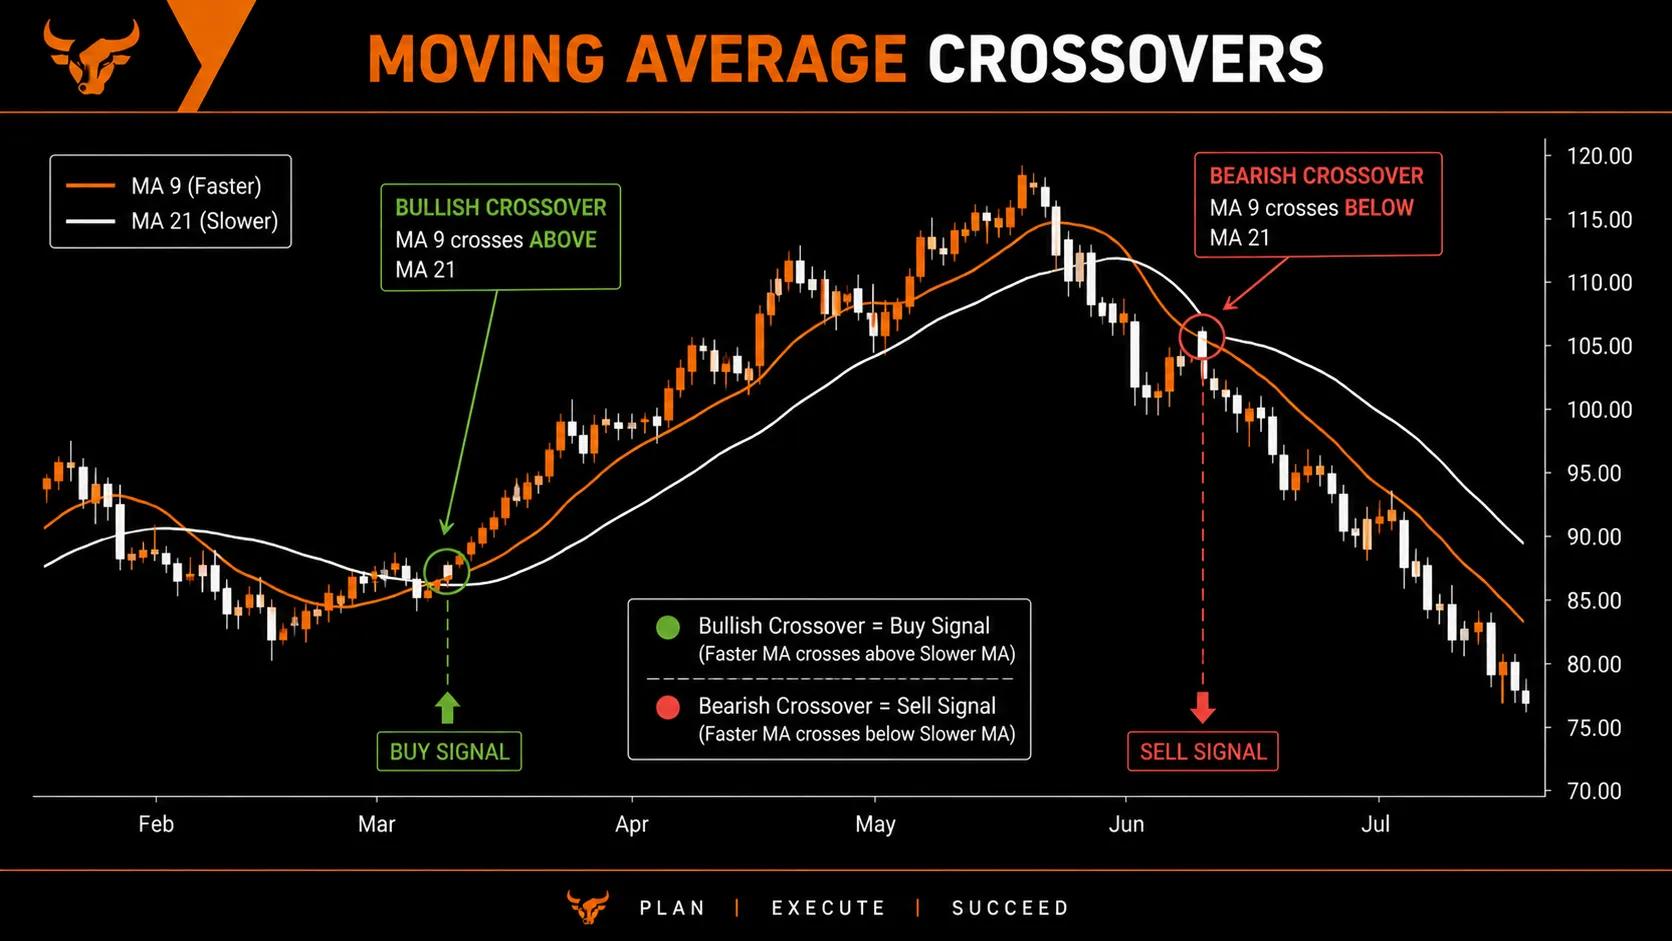
Moving Averages Explained: SMA, EMA, and How Traders Use Them
Moving average trading explained simply. Learn how SMA and EMA work, how to read crossovers, and how traders use them to spot trends and time entries.
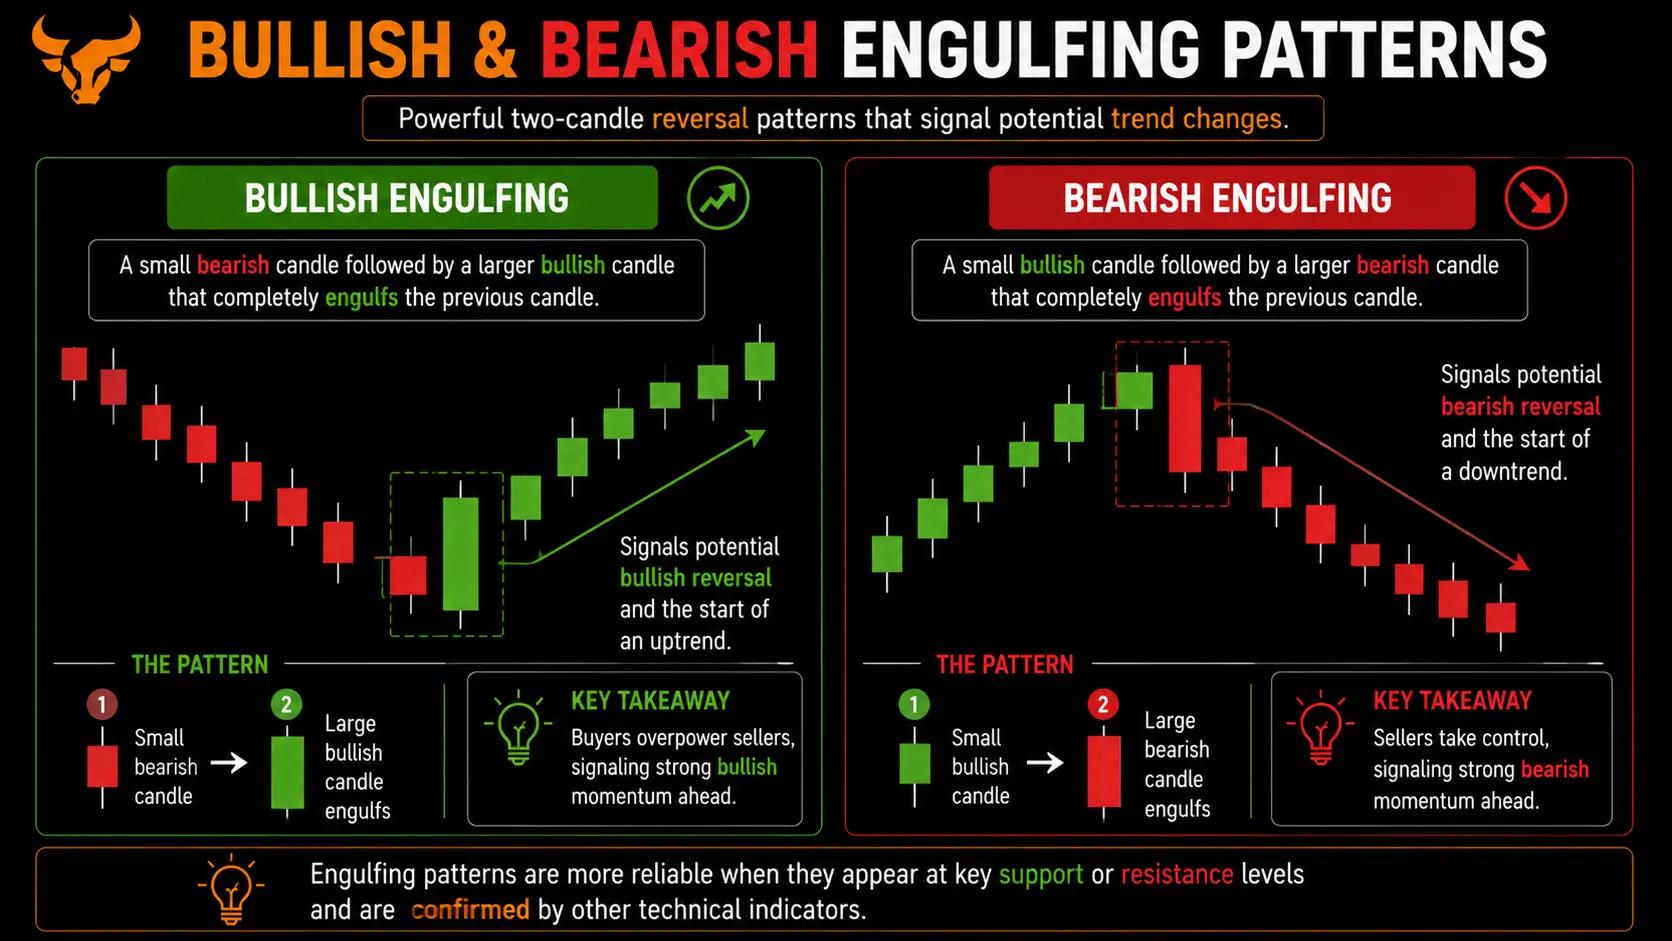
Candlestick Patterns Explained: A Practical Visual Guide
Candlestick patterns explained for new traders: read doji, hammer, and engulfing signals with clear visual chart examples.

Bollinger Bands explained: how to read and trade this volatility indicator
A trader-focused guide to Bollinger Bands: how the three lines are built, what band touches really mean, and how to avoid the mistakes that trap retail traders.
0 comments