



Technical Analysis · Intermediate · 7 min read
Fibonacci Retracement Explained: Levels, Setup, and Trading Rules
Fibonacci retracement is a technical analysis tool that draws horizontal lines at the 23.6%, 38.2%, 50%, 61.8% and 78.6% levels between a swing high and a swing low to mark potential support and resistance zones where price may pause or reverse during a pullback inside a trend.
What Is Fibonacci Retracement and How Does It Work in Trading?
Fibonacci retracement measures the depth of a pullback inside a trend. You anchor it between a significant swing low and swing high; the platform plots horizontal lines at fixed percentages of that range. A pullback (a temporary counter-trend move before the primary trend resumes) that stalls near one of those lines is your potential entry zone.
Large numbers of retail and institutional traders watch the same levels on the same charts, so orders cluster around them. That clustering is what makes a level act as support and resistance. Fibonacci retracement stripped of mysticism is simply a coordination device: a shared grid that concentrates liquidity at predictable prices during a corrective move.
Choose a broker with strong charts among the best forex & CFD brokers.
The Fibonacci Sequence and Golden Ratio in Markets
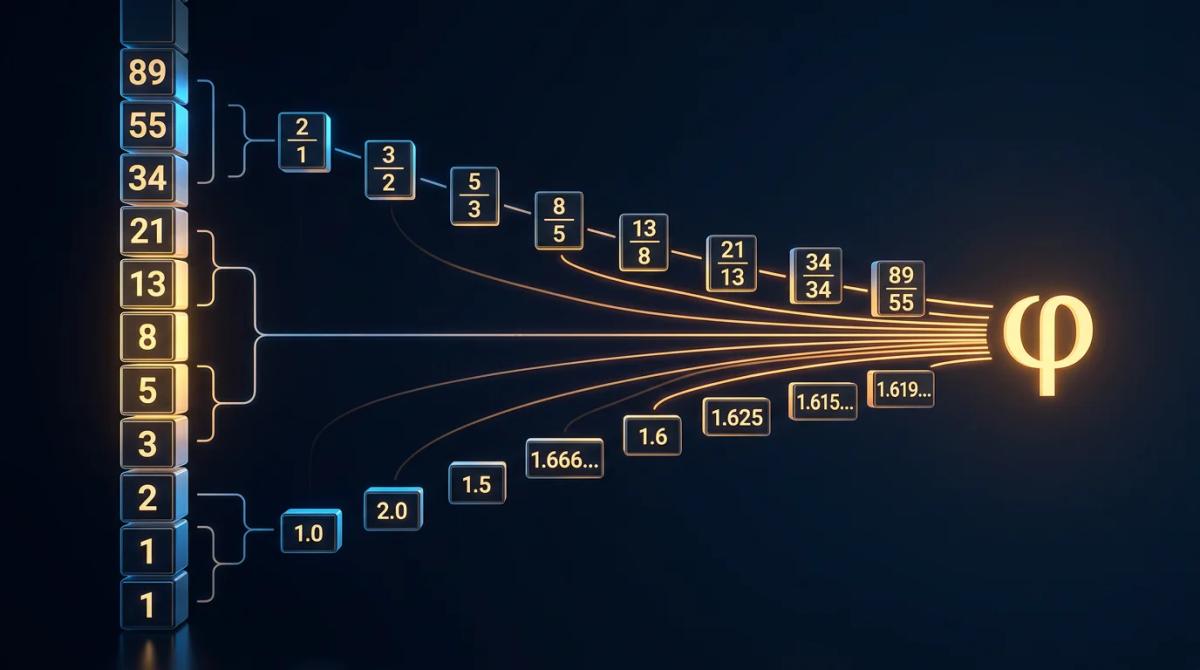
The Fibonacci sequence is a mathematical series in which each number is the sum of the two before it: 0, 1, 1, 2, 3, 5, 8, 13, 21, 34, 55, 89, 144.
Divide any number by the one that follows and the ratio converges to about 0.618; divide by the one two places on and you get roughly 0.382. The ratio of consecutive numbers in the other direction converges to approximately 1.618, called the golden ratio or phi.
Those ratios are what the retracement tool draws on your chart. The 61.8% line comes from 1/phi, the 38.2% line from 1/phi squared, and the 23.6% line from 1/phi cubed.
The 50% line is not a Fibonacci ratio at all, but it survives on the tool because pullbacks to the midpoint of a swing are a common statistical outcome and traders anchor decisions there.
Key Fibonacci Retracement Levels and Their Significance
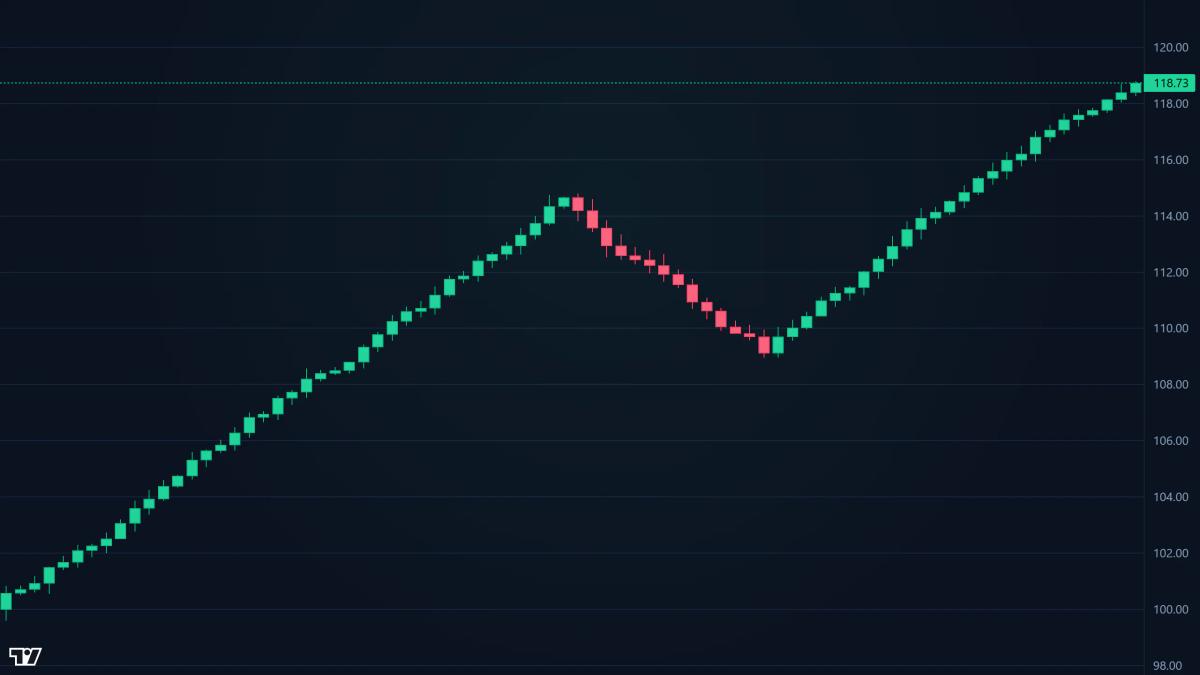
The five levels you will see on almost every platform have distinct personalities.
- Shallow pullbacks find support at 23.6% and 38.2%; these usually mark strong trends where the crowd is quick to buy dips.
- Deeper pullbacks to 50% or 61.8% are typical of healthy but slower trends.
- A retracement to 78.6% is close to a full reversal and often precedes trend failure.
| Level | Formula | Typical use |
|---|---|---|
| 23.6% | 1/phi^3 | Shallow pullback in a strong trend |
| 38.2% | 1/phi^2 | Early pullback entry |
| 50.0% | Midpoint (not Fibonacci) | Common continuation zone |
| 61.8% | 1/phi (golden ratio) | Deep pullback, high-conviction entry |
| 78.6% | Square root of 0.618 | Last defence before trend failure |
The 61.8% level attracts the most attention because it maps directly onto the golden ratio. Traders often treat it as the last clean pullback level: if price closes decisively beyond 61.8%, many discretionary systems downgrade the trend from intact to broken and stand aside until a new swing structure forms.
How to Apply Fibonacci Retracements to Your Charts
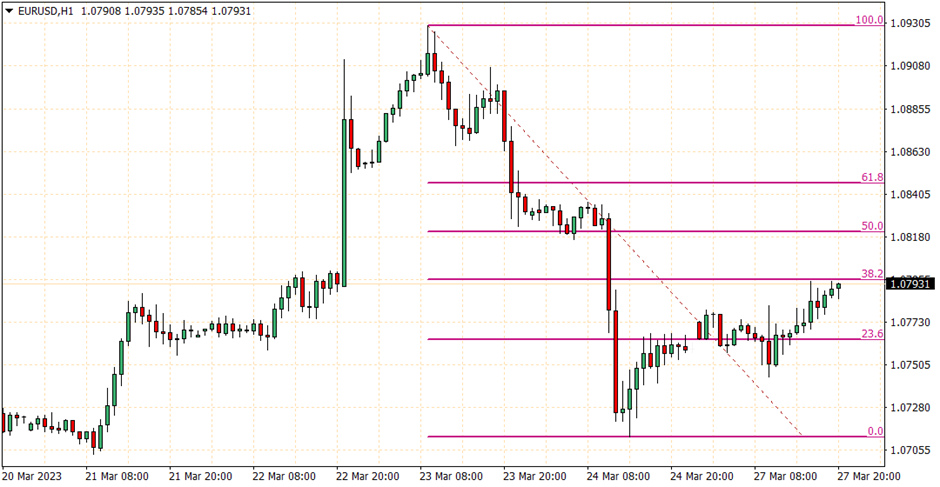
Applying the tool cleanly is a two-step process.
- First, identify the swing you want to measure: a clear low followed by a clear high (for an uptrend) or a clear high followed by a clear low (for a downtrend). A swing point is a candle whose high or low is not exceeded by the candles immediately either side. Anchor the tool from the origin of the move to its extreme, in the direction of the trend.
- Second, wait for price to pull back into the grid. Let a candle close near a level and add a confirmation trigger, for example a bullish engulfing bar at 61.8%. Adjust the anchors only when a new, higher-timeframe swing forms; constantly redrawing the tool to fit recent candles is a form of hindsight bias. The same chart with the same rules should give two traders the same levels.
Common Mistakes Traders Make With Fibonacci Retracements
The most frequent error is applying Fibonacci to a market that has no trend. In a sideways range the levels are noise: price crosses them without meaning because there is no directional move being retraced.
A second recurring mistake is picking swing points to justify a trade you already want, rather than the objectively highest high and lowest low of the last leg.
Over-reliance is the third pitfall. Without a trigger from price action, volume, or a second indicator, buying blindly at 61.8% converts a probabilistic edge into a coin flip.
The fourth mistake is stop placement: putting the stop exactly at the level guarantees you will be knocked out by the wicks that make Fibonacci levels visible in the first place.
Combining Fibonacci Retracements With Other Technical Indicators
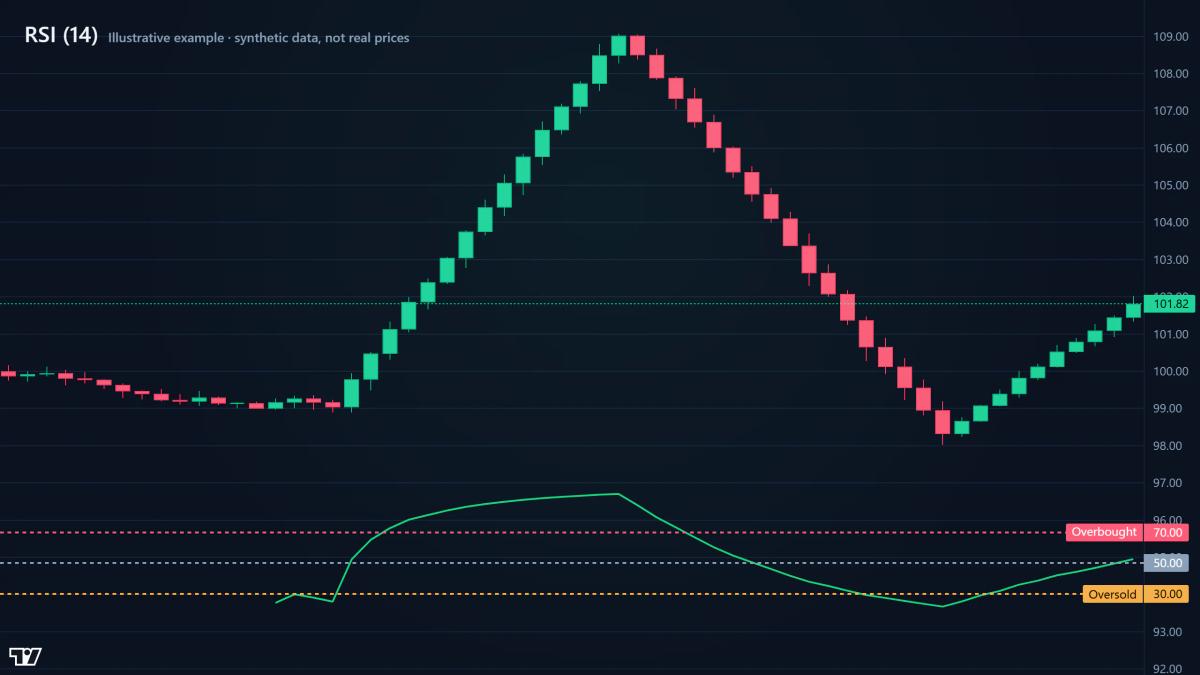
Fibonacci levels do their best work in confluence. When the 61.8% retracement sits on top of a rising 50-period moving average and a prior horizontal support, three unrelated methods point at the same price. That overlap is what practitioners call a high-probability zone. Any one of the tools alone is weaker than the intersection of all three.
| Companion tool | What it adds | Typical setup |
|---|---|---|
| RSI (14) | Momentum extremes | Divergence into 61.8% pullback |
| 50/200 EMA | Dynamic trend filter | Fib level meets rising EMA |
| Horizontal S/R | Historical memory | Prior swing sits on 38.2% or 50% |
| Volume profile | Real order flow | High-volume node aligns with 61.8% |
Here is the differentiated angle: rather than treating Fibonacci as a standalone system, use it as a filter on setups you would already consider valid, or as a target grid for setups triggered by another method.
Risk Management and Position Sizing With Fibonacci Levels
A Fibonacci trade only becomes tradable once you can define the invalidation point. In a pullback long, place the stop loss (an order that closes the position at a set loss) beyond the next Fibonacci level, or beyond the swing low that anchored the tool. That distance in pips or points is your risk per unit. Divide your permitted loss by that distance to get position size.
A standard retail rule is to risk 1% to 2% of the account per trade. On a £5,000 account risking 1%, the maximum loss is £50; if the stop distance is 25 pips on a major forex pair, your position size is calibrated to that £50 cap.
UK retail traders should note that FCA leverage caps (30:1 on majors, 20:1 on indices, 5:1 on equities) constrain how much notional exposure that £50 risk can carry.
Fibonacci Extensions for Profit Targets and Projections
Fibonacci extensions solve the opposite problem: not where a pullback ends, but where the next leg finishes. After price bounces from a retracement level and resumes the trend, extensions plotted at 127.2%, 161.8%, 261.8% and 423.6% of the original swing act as projected resistance in an uptrend or support in a downtrend. Many traders scale out of positions across these levels rather than exiting all at once.
Fibonacci Institute (public reference, 2023): the 161.8% extension is the modal profit target used by discretionary swing traders when combined with a 61.8% retracement entry, because the risk-to-reward ratio typically clears 2:1 without additional filters.
Extensions share the limitation of retracements: they are hypotheses. Combine them with a trailing stop or a structural exit (for example, close on a break of a rising trendline) so that a target which never fills does not turn a winning trade into a losing one.
Frequently Asked Questions
Why do traders use the 61.8% Fibonacci level more than other retracement levels?
The 61.8% level is the inverse of the golden ratio (1/phi) and is the deepest 'clean' pullback consistent with an intact trend. Because so many discretionary and algorithmic traders anchor decisions there, orders cluster at 61.8%, which turns the level into self-reinforcing support or resistance. A close decisively beyond 61.8% is widely interpreted as trend failure, prompting many traders to exit.
Can Fibonacci retracements be used in all market conditions, or only in trending markets?
Fibonacci retracements are designed for trending markets and are unreliable in sideways or choppy conditions. In a range, price crosses the levels without meaning because there is no directional move being retraced. Before drawing the tool, confirm the trend with structure (higher highs and higher lows, or lower highs and lower lows) or a trend filter such as a 200-period moving average.
What is the difference between Fibonacci retracements and Fibonacci extensions?
Retracements measure how far price pulls back inside an existing swing, using levels between 0% and 100% of that swing. Extensions project targets beyond the swing, using levels above 100%: typically 127.2%, 161.8%, 261.8% and 423.6%. Retracements answer 'where might I enter on a pullback', extensions answer 'where might I exit if the trend continues'.
How do you know which swing high and swing low to use when drawing Fibonacci retracements?
Use the most recent significant swing on the timeframe you trade. A significant swing point is one whose high or low is not exceeded by the candles either side, and which is visible without zooming in. If two chartists on the same timeframe would independently pick different anchors, the swing is not clean enough; step up to a higher timeframe until the structure is unambiguous.
Do Fibonacci levels work better on certain timeframes or asset classes?
Fibonacci is timeframe-agnostic in theory but behaves better where liquidity and participation are high: major forex pairs, large-cap equities, and liquid index futures on daily and 4-hour charts. On very low timeframes (1-minute, 5-minute) and thinly traded instruments, noise and slippage overwhelm the level, producing more false signals. Backtest on your specific instrument and timeframe before committing capital.
About the authors


Put this into practice
Brokers we have reviewed
Scored on the same five dimensions. Here are three of them — the full list is on the brokers page.



Related articles

Head and Shoulders Pattern Trading: Structure, Entry, and Risk Management
A structural guide to head and shoulders pattern trading: identification, neckline breakouts, false-break filters, inverted variant, and position sizing tied to pattern dimensions.

How to Identify Market Trends: A Practical Technical Analysis Guide
A structured guide to identifying uptrends, downtrends, and ranges using price action, indicators, and multi-timeframe analysis, with risk rules and reversal cues built in.

Leading Stock Indicators: How to Spot Trend Reversals Early
A plain-English guide to leading stock indicators: what they are, how RSI, Stochastic, MACD and volume tools work, and how to trade them without getting whipsawed.
0 comments