



Technical Analysis · Beginner · 8 min read
Pennant Pattern: Definition, Trading Strategy, and Breakout Signals
A pennant pattern is a short-term continuation chart pattern that appears after a sharp price move, called the flagpole, and is followed by a brief consolidation between two converging trend lines. In this article, you'll learn what they indicate, how to spot them, and the best way to trade them.
What is a pennant pattern and how does it form?
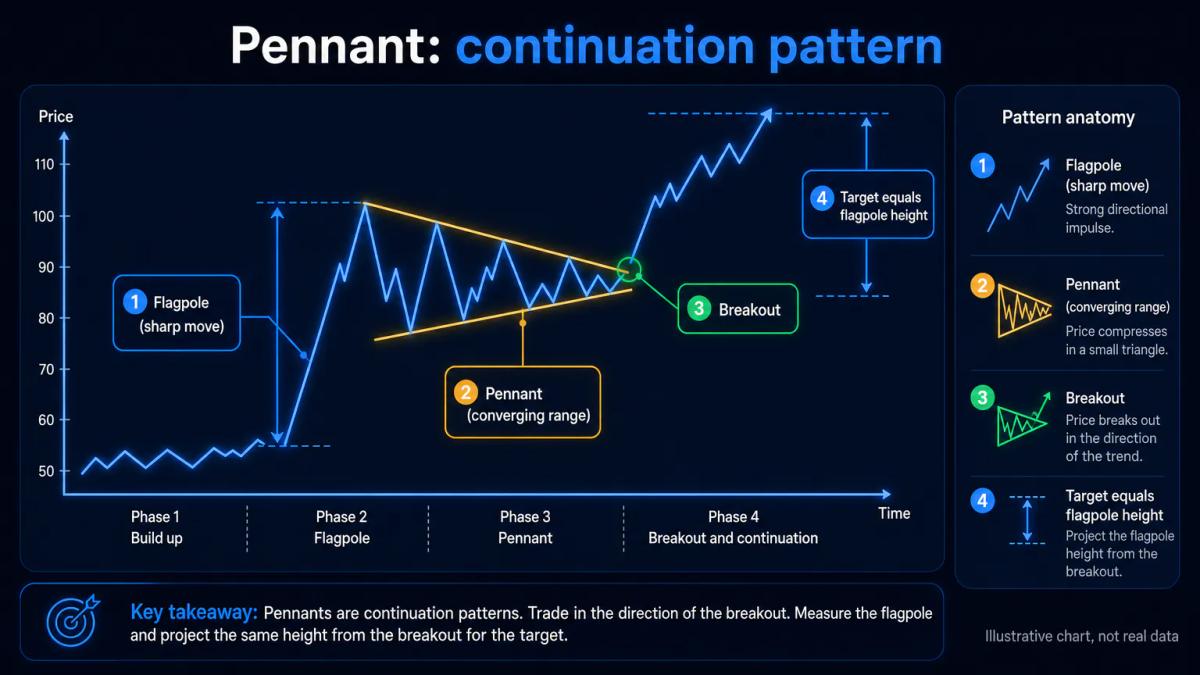
The pennant pattern has two parts: a sharp directional move (the flagpole) and a small symmetrical triangle of consolidation that follows it. During the flagpole, one side of the market dominates: buyers in an uptrend, sellers in a downtrend. Once that initial burst exhausts short-term energy, price starts to compress. Highs get lower, lows get higher, and the range narrows into a point.
This compression usually lasts between one and four weeks on a daily chart, though the same shape appears on any timeframe. A pennant is a pause, not a reversal. You missed the initial impulse and now get a second chance to join the move at a defined risk level.
To draw one, connect at least two lower highs with an upper trend line and two higher lows with a lower trend line. The apex where those lines meet is the point at which the pennant is no longer valid; the breakout should occur well before then.
Choose a broker with strong charts among the best forex & CFD brokers.
Bullish vs. Bearish Pennants: Structure and Breakout Direction
A bullish pennant follows an uptrend and resolves upward; a bearish pennant follows a downtrend and resolves downward. The consolidation shape is symmetrical in both, so direction comes entirely from the preceding flagpole.
That is the single most important distinction to internalise before you trade the pattern. Like other continuation patterns such as bull and bear flags, pennants rely on the direction of the prior move to signal the breakout direction.
The table below summarises the two variants side by side.
| Feature | Bullish pennant | Bearish pennant |
|---|---|---|
| Preceding move | Sharp rally (flagpole up) | Sharp decline (flagpole down) |
| Consolidation location | Just below the flagpole high | Just above the flagpole low |
| Breakout direction | Above the upper trend line | Below the lower trend line |
| Volume during consolidation | Declining | Declining |
| Volume at breakout | Spike above 20-period average | Spike above 20-period average |
| Typical duration | 1 to 4 weeks on daily charts | 1 to 4 weeks on daily charts |
| Invalidation | Close back inside the pennant after breakout | Close back inside the pennant after breakout |
Both variants share the same breakout logic: a decisive close beyond the relevant trend line, ideally with expanding volume. Without that volume expansion, the breakout has no conviction behind it, and the trade becomes a coin flip regardless of how textbook the shape looks on your screen.
Entry, stop loss, and price target rules for pennant trades
Entry is triggered when price closes beyond the pennant boundary, not merely when a wick pierces it.
- On a bullish pennant, that means a candle body closing above the upper trend line.
- On a bearish pennant, a candle body closing below the lower trend line.
Waiting for the close filters out intrabar spikes that reverse within minutes.
Stop loss sits just beyond the opposite trend line, plus a small buffer for market noise. If the pennant is tight, the stop may be only 1 to 2% away; on a wider pennant, 3 to 5% is more realistic. The buffer matters because price often retests the broken trend line before continuing.
Price target is projected by measuring the flagpole from its start to the point where consolidation began, then adding that distance to the breakout price (upward for bullish, downward for bearish). This gives you a defined risk-to-reward ratio before you commit capital.
Worked example: a stock rallies from $50 to $60 (flagpole of $10), consolidates between $58 and $60, then breaks out at $60. Your projected target is $70, with a stop near $57.50. That is $2.50 risk against a $10 target, roughly 1:4.
Volume and confirmation indicators for reliable pennant breakouts
Volume is the single most useful filter for pennant breakouts. During the consolidation phase, volume should contract steadily as the range narrows: fewer participants are willing to trade at the current levels. At the breakout, volume should expand sharply, ideally at least 1.5 times the 20-period average, signalling that fresh participants are entering the trade.
Breakouts on flat or declining volume are the most common source of false signals. Without new money pushing price beyond the pennant, the move tends to fade back inside within a few candles. Secondary confirmation strengthens the setup.
The Relative Strength Index (RSI, a momentum oscillator scaled from 0 to 100) should read above 50 on a bullish breakout and below 50 on a bearish one. The Moving Average Convergence Divergence (MACD, a trend and momentum indicator built from two moving averages) should cross in the direction of the breakout at or near the trigger candle.
A final filter is market structure: check that the breakout is not running directly into a major horizontal support or resistance level within one flagpole-length of your entry. If it is, the target is at risk before the trade has room to develop.
Pennant patterns across timeframes and asset classes
Pennants form on every timeframe, from one-minute intraday charts to weekly charts, and across every liquid asset class. What changes is the noise-to-signal ratio. Lower timeframes (1 to 15 minutes) produce many pennant-like shapes, but a large share are simply random consolidation inside a wider range. Daily and weekly pennants tend to be more reliable because each candle reflects a full session of aggregated flow.
Behaviour varies by market. In major forex pairs versus equities and indices, pennants often form after macro-driven impulses (central bank statements, inflation prints) and tend to be tight, with modest flagpoles. In equity indices, pennants frequently appear around earnings-driven moves in constituent stocks. In cryptocurrency, flagpoles are sharper and consolidations tighter because trading is continuous and liquidity thinner outside major venues; false breakouts are also more frequent for the same reason.
Common false breakouts and how to avoid them
A false breakout is a move that pierces the pennant boundary, triggers entries and stop losses, then reverses before reaching any reasonable target. Three filters cut the false-signal rate meaningfully.
- First, require a candle close beyond the trend line rather than an intrabar wick.
- Second, require breakout volume of at least 1.5 times the 20-period average during the consolidation phase.
- Third, check that the breakout is not occurring inside a broader range on the higher timeframe.
Understanding how to evaluate trading signals helps you distinguish genuine breakouts from noise.
Market context matters as much as pattern quality. Pennants that form in choppy, low-volatility sessions or ahead of major scheduled news events are more prone to whipsaws, because a single headline can invalidate the setup instantly.
A pragmatic adjustment is to place the stop loss just inside the opposite trend line rather than beyond it. This tightens risk on false breakouts, at the cost of occasionally being stopped out on legitimate retests. You prefer higher win rates and accept that trade-off; or you prefer larger average wins and keep the wider stop.
Position sizing and risk management for pennant trades
Position size on a pennant trade should be driven by the stop distance and a fixed per-trade risk, typically 1 to 2% of the account. The formula is simple: divide your risk amount by the stop distance in price to get the size in units. For example, on a $10,000 account risking 1% ($100), with an entry at $60 and a stop at $57.50, the stop distance is $2.50 and the position size is 40 shares.
Wider pennants require wider stops, which reduce position size at constant risk. Tighter pennants allow larger positions. This mechanical link between pennant geometry and position size is what keeps drawdown, the fall from a capital peak to the trough before a new peak, predictable across dozens of trades.
UK retail traders should also account for the FCA leverage caps and intraday margin rules: 30:1 on major forex, 20:1 on major indices, 5:1 on individual equities, with contracts for difference on cryptoassets prohibited for UK retail clients.
Frequently Asked Questions
How long does a pennant pattern typically take to form, and does duration affect reliability?
On a daily chart, most pennants complete within one to four weeks. Patterns that stretch beyond four weeks tend to lose their character and behave more like symmetrical triangles or broader ranges. Very short pennants (a few sessions) can still work but are more sensitive to volume confirmation, since there is less time for the consolidation to build a clean structure.
What is the difference between a pennant and a flag pattern?
Both follow a sharp flagpole and act as continuation patterns. The difference is in the consolidation shape. A pennant is bounded by two converging trend lines (a small symmetrical triangle). A flag is bounded by two parallel trend lines sloping against the prior trend (a small channel). The trading rules are similar: enter on the breakout, stop beyond the opposite boundary, target the flagpole length.
Can pennant patterns fail, and what percentage of breakouts result in false signals?
Pennants can and do fail. False breakout rates vary widely by asset, timeframe and volume conditions, and no single figure applies to all markets. The practical response is to filter setups by requiring a candle close beyond the trend line, breakout volume above 1.5 times the 20-period average, and a target that does not run directly into major support or resistance.
Should I trade pennants on lower timeframes like 5-minute or 15-minute charts?
You can, but the false-signal rate is higher because intraday noise produces many pennant-like shapes that do not reflect genuine supply-demand shifts. If you trade lower timeframes, tighten your filters: demand a clear volume spike on breakout, avoid the first and last 15 minutes of the session, and stay out around scheduled news releases.
How do I calculate my price target once a pennant breaks out?
Measure the flagpole from its start to the point where consolidation began. Add that distance to the breakout price for a bullish pennant, or subtract it for a bearish pennant. If the flagpole ran from $50 to $60 and the breakout occurs at $60, your projected target is $70. This assumes the continuation move will match the initial impulse, which is the empirical basis of the setup.
About the authors


Put this into practice
Related articles

RSI Buy and Sell Signals: How to Read Them Correctly
A practical guide to reading RSI buy and sell signals through crossovers, divergence, price structure and risk rules, so the indicator earns its place on your chart.

RSI Indicator Explained: How to Read and Trade the Relative Strength Index
A practical, citable guide to the RSI indicator: formula, thresholds, divergences, failure swings, false signals, and how to tune the period for your trading style.

Single Candlestick Patterns: How to Read and Trade Them
A practical guide to the six core single candlestick patterns, how they signal reversals or continuation, and the rules that separate real setups from noise.
0 comments