



How to Trade · Intermediate · 8 min read
What Are Trading Signals: How They Work and When to Use Them
Trading signals are automated or manual alerts that tell you when to buy or sell an asset based on technical analysis, price action, or algorithmic rules.
They compress market data into actionable entry and exit points, saving you time on chart analysis and helping you act on opportunities faster within a defined trading plan.
What are trading signals and why do traders use them
Trading signals are structured buy or sell alerts triggered by a defined set of market conditions. A signal usually specifies the instrument, the direction (long or short), an entry price, a stop loss (a preset order that closes a losing trade at a defined price), and a take profit (the corresponding order that locks in gains at a target level). The purpose is to convert raw chart data into a discrete decision.
You use signals to save screen time, enforce discipline, and standardise entries. If you work a day job, you cannot watch price action for eight hours, so a signal delivered by email, push notification, or platform alert compresses that monitoring into a single ping.
The signal does not replace your judgement: it prompts a decision that you still need to validate against your own risk rules, account size, and market context before clicking buy.
You’ll need a broker first: see the best forex brokers.
How trading signals are generated from technical indicators
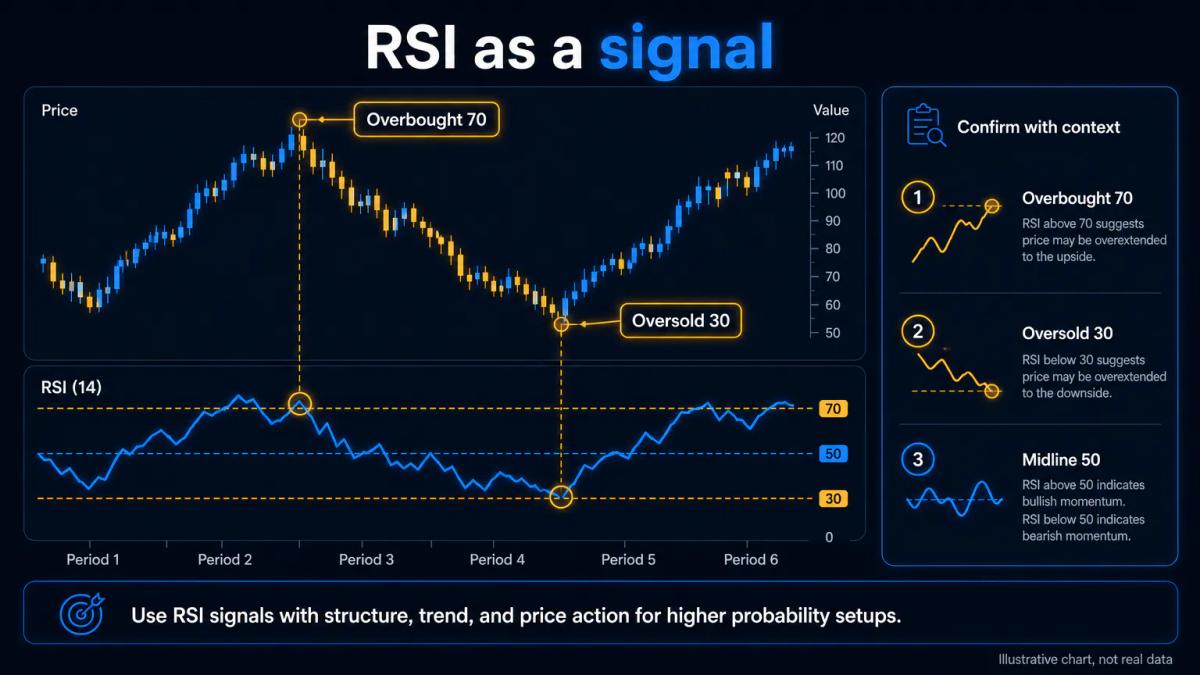
Most trading signals originate from technical indicators applied to price and volume data. The five workhorses are moving averages, RSI, MACD, Bollinger Bands, and stochastic oscillators.
- A moving average smooths price over a chosen period and defines trend direction.
- RSI, the Relative Strength Index, measures momentum on a 0 to 100 scale and flags overbought conditions above 70 or oversold below 30.
- MACD compares two moving averages to identify momentum shifts.
- Bollinger Bands wrap price in volatility envelopes, and stochastics compare closing price to a recent range.
A signal fires when one or more of these indicators cross a preset threshold or align with a price pattern. A classic example is the moving average crossover: when the 50-period average crosses above the 200-period average, an algorithm labels it a bullish signal (the golden cross) and generates a buy alert. Similar logic applies to RSI leaving oversold territory or MACD lines crossing zero.
More sophisticated systems layer multiple indicators plus filters such as volatility bands, session times, or economic calendar events. As signal that cannot be described in explicit rules cannot be tested, and a signal that cannot be tested is guesswork with a chart attached.
Types of trading signals: manual, automated, and timeframe variations
Trading signals fall into two main categories: manual signals generated by human analysts reviewing charts and news, and automated signals produced by algorithms or trading bots running on your platform or a third-party service.
Manual signals often include commentary explaining the setup; automated signals arrive as raw data feeds you can route to your terminal.
They also vary by timeframe, from scalping signals lasting minutes to swing or position signals spanning days or weeks. Each timeframe suits a different lifestyle and cost structure.
| Signal type | Typical holding period | Trade frequency | Best suited to |
|---|---|---|---|
| Scalping | Seconds to minutes | 20 to 100 per day | Full-time traders with tight spreads |
| Intraday | Minutes to hours | 3 to 10 per day | Active traders monitoring sessions |
| Swing | 1 to 10 days | 2 to 5 per week | Part-time traders with a plan |
| Position | Weeks to months | 1 to 4 per month | Trend followers with patience |
The delivery channel matters as much as the source. Signals can arrive via Telegram groups, email lists, proprietary dashboards, MT4 or MT5 copy services, cTrader chatrooms, or TradingView webhooks that fire directly into a broker API. Integration quality drives execution slippage: a signal delayed by three minutes on a five-minute scalping strategy is worthless, while a swing signal delivered by email overnight is fine.
How to use trading signals effectively in your trading plan
Effective signal use starts with defining your risk tolerance, position size, and stop loss before entering any trade. A signal tells you what to do; your plan tells you how much to risk. A common rule is to risk no more than 1 to 2% of account equity on a single trade. If your account is £5,000 and your stop loss sits 30 pips from entry on a major forex pair, position sizing dictates the lot size, not the signal provider.
Cross-reference signals from multiple sources or indicators to reduce false positives. If a subscription service flags a long on EUR/USD and your own trend filter confirms the same direction on a higher timeframe, the odds improve. If they disagree, skip the trade. This is cheaper than paying two providers to shout over each other.
Set clear profit targets aligned with your reward-to-risk ratio. A minimum of 1.5:1 (potential gain 1.5 times potential loss) gives you room to be wrong more than half the time and still break even.
Log every signal you follow, whether you took the trade or not, with entry, exit, stop, and outcome. After 50 to 100 logged trades you can see which providers or indicator combinations actually pay, and which drain your account through fees and slippage.
Risk management and combining signals for reliability
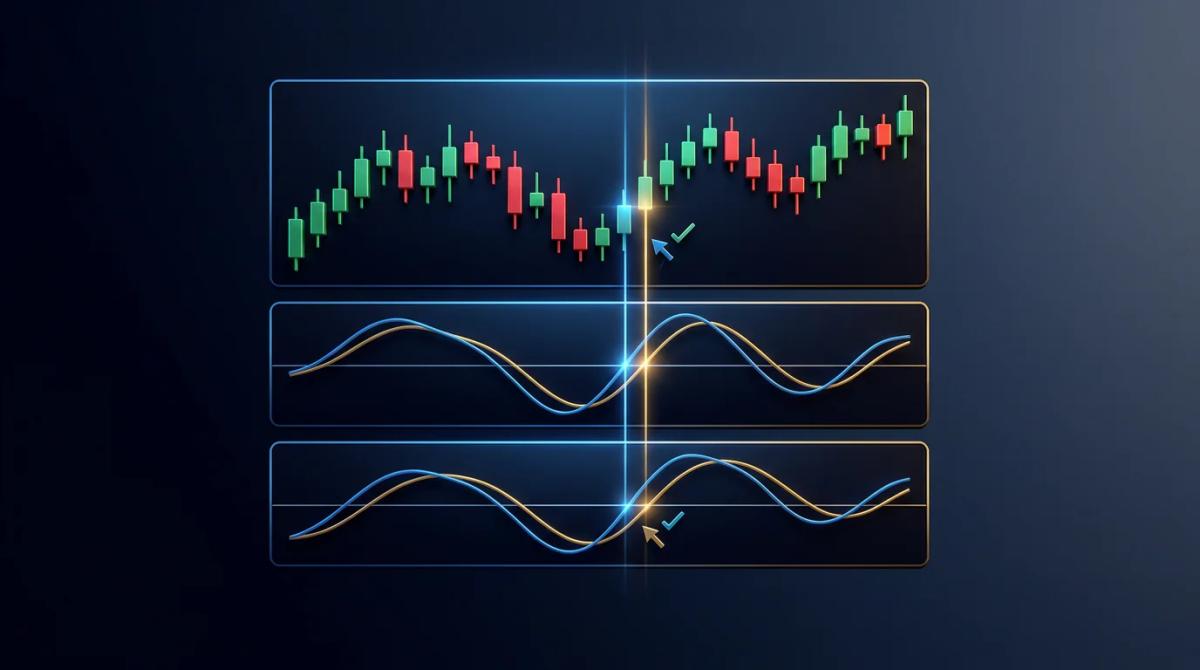
Relying on a single signal increases the chance of whipsaws (rapid reversals that trigger stop losses on both sides) and losses. Wait for confirmation from at least two independent indicators or price patterns before entering a trade. Independence matters: two momentum indicators calculated on the same price series are not independent, but a momentum indicator plus a volume filter or a support and resistance level are.
Always use a stop loss to cap your downside, and size your position so that one losing trade does not wipe out your account. According to the FCA, retail brokers regulated in the UK must apply leverage caps of 30:1 on major forex pairs, 20:1 on major indices, and 5:1 on individual equities, and CFDs on cryptoassets are prohibited for UK retail clients. These caps limit position size at the platform level, but they do not save you from taking 20 trades in a row without stops.
Advantages and limitations of trading signals
Trading signals save time and remove emotion from entry and exit decisions, making them valuable for busy traders or beginners still building pattern recognition. A structured alert with entry, stop, and target forces you to skip the internal debate about whether the setup is 'good enough' and act on the rules you agreed to follow.
However, signals are not infallible. Most indicator-based signals lag price action because they are calculated from historical bars. They perform poorly in choppy or ranging markets where breakouts fail repeatedly, and they can generate false signals during news events, thin overnight liquidity, or the daily rollover window. The 08:00 London open and 13:30 UK data releases regularly produce spike-and-reverse patterns that trigger stops on both sides. No signal system replaces context awareness: knowing when a payroll release, a central bank meeting, or an earnings call is scheduled is your job, not the algorithm's.
Regulatory oversight and cost of signal services
Signal providers marketing to UK and EU clients fall within the perimeter of the FCA and ESMA when the service constitutes investment advice or investment research. Providers must disclose past performance honestly, present risks fairly, and avoid misleading claims. As of 2025, an ESMA-aligned provider should not advertise 'guaranteed returns' or hide drawdown periods behind cherry-picked screenshots.
Pricing varies widely by asset class and signal frequency. The table below compares typical subscription bands you will see across the UK market.
| Signal service tier | Monthly cost | Typical asset focus | Signals per week |
|---|---|---|---|
| Entry (community) | £10 to £30 | Major forex | 5 to 15 |
| Mid-tier | £50 to £150 | Forex plus indices | 10 to 30 |
| Professional | £200 to £500 | Multi-asset, algorithmic | 20 to 100 |
Before paying, verify the provider's regulatory status on the FCA register, request a verified track record covering at least twelve months including losing periods, and confirm which broker feed they use for their published fills.
Common pitfalls and how to avoid them
Traders often chase signals blindly without understanding the underlying logic. If you cannot describe in one sentence why a signal fires, you cannot evaluate when it will fail. Over-optimisation is a second trap: a strategy tuned to look perfect on 2019 to 2022 data often collapses in live markets because it fitted noise, not structure. Walk-forward testing, where you optimise on one window and validate on the next unseen window, reduces this bias.
Unverified sources are the third pitfall. Screenshots from Telegram channels are not evidence; brokerage statements with the client name redacted are. Backtest signals on historical data using your intended timeframe and instrument, paper trade them on a demo account for at least four weeks, and only commit real capital once you see consistent performance over 50 or more trades. The £10 saved on due diligence is the cheapest £500 loss you will ever avoid.
Frequently Asked Questions
Are trading signals reliable for making consistent profits?
Signals are only as reliable as the rules and track record behind them. No signal service produces consistent profits without a matching risk plan, position sizing, and enough sample size to distinguish edge from luck. Expect drawdowns, verify a twelve-month verified performance record, and treat any provider promising fixed returns as a red flag.
Can I use trading signals on MT4, MT5, or cTrader platforms?
Yes. MT4 and MT5 support signals through the built-in MQL Signals marketplace and through expert advisors (EAs) that translate incoming alerts into orders. cTrader supports cBots and copy trading. TradingView alerts can be routed via webhooks to broker APIs. Check that your broker allows the specific integration and that latency stays under one second for short-term strategies.
What is the difference between a trading signal and a trading strategy?
A trading strategy is the full framework, including instrument selection, timeframe, entry logic, exit logic, position sizing, and risk rules. A trading signal is a single output of that framework: a discrete alert telling you to open or close a position. One strategy typically generates many signals over time.
How do I backtest a trading signal before using it with real money?
Load historical price data covering at least two years and multiple market regimes into your platform's strategy tester. Run the signal rules exactly as specified, record every trade with entry, exit, stop, and slippage assumption, then compute win rate, average reward-to-risk, and maximum drawdown. Follow that with a four to eight week demo run to validate live conditions.
Should I follow signals from multiple providers or stick to one source?
Multiple providers increase your data but also your costs and the risk of conflicting trades on the same instrument. A practical setup is one primary signal source combined with your own independent confirmation filter, such as a higher timeframe trend check or a volume threshold. Adding a second paid provider only makes sense if it covers a different asset class or timeframe.
About the authors


Put this into practice
Brokers we have reviewed
Scored on the same five dimensions. Here are three of them — the full list is on the brokers page.



Related articles

AI Agents for Stock Trading: How They Work and What to Expect
A practical look at AI agents for stock trading: how multi-agent LLM frameworks reason, what they cost to run, and where they break in live markets.

Best EMA for Finding Trends in Day Trading: 9, 21 and 50 Explained
How the 9, 21 and 50 EMAs work together to identify intraday trends, plus the 5, 8, 13 setup, stop placement, volume filters and common pitfalls.

Best Trading Platform for Beginners: Features, Costs and Safety
A practical guide to picking your first trading platform: what to check on costs, interface, regulation, education and risk tools before you deposit.
0 comments