



Technical Analysis · Beginner · 6 min read
Consolidation in Trading: What It Is and How to Trade It
The smallest price move that signals a big one
Consolidation in trading is a period when price moves sideways inside a defined range, showing that buyers and sellers have reached a temporary balance. The asset stops trending and bounces between a support level (a price floor where buying interest appears) and a resistance level (a price ceiling where selling pressure appears). Because a tight range often precedes a sharp breakout in either direction, consolidation stands out as one of the highest-value setups available to patient traders.
Consolidation shows up on every chart, across every timeframe and every asset class, so learning to read it well pays off in almost any market condition. The skill has less to do with predicting the precise moment of the break and more to do with being prepared for it when the range finally gives way.
Putting this into practice means opening an account: start with the best forex brokers our team reviewed.
Why consolidation happens: supply meets demand
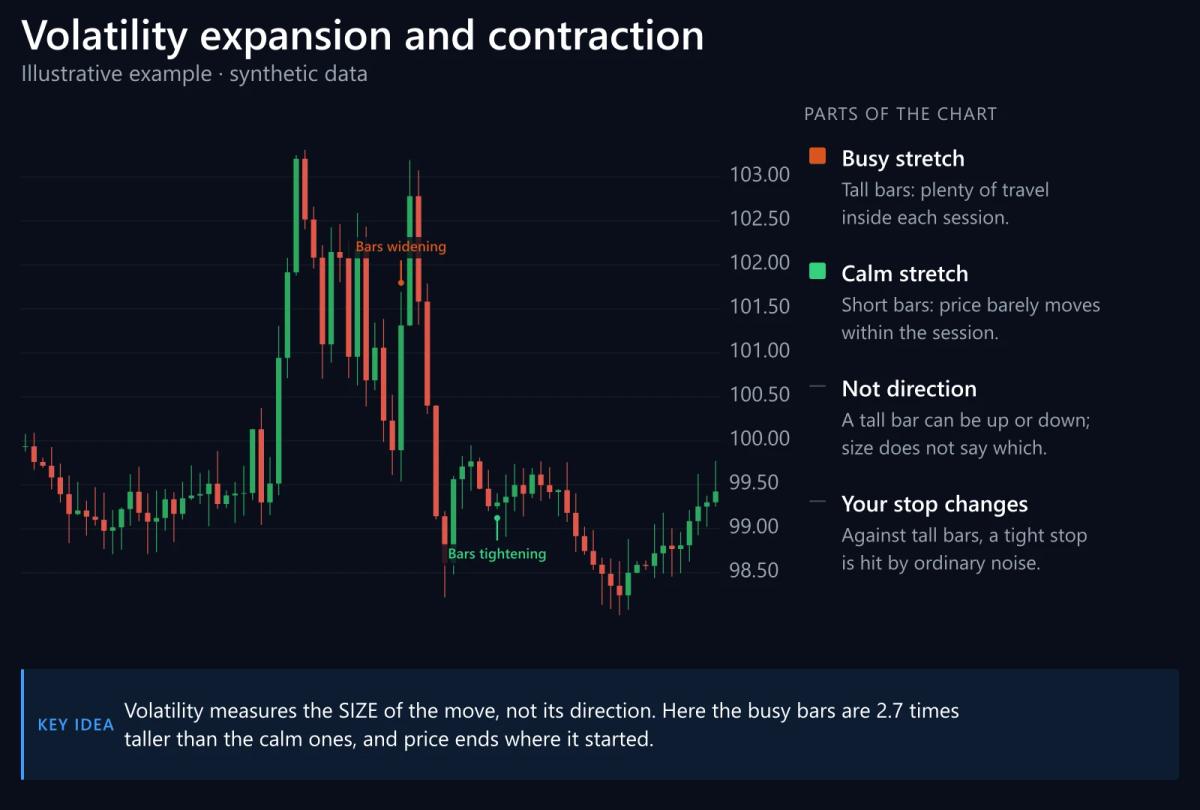
Sideways price action forms when the market reaches a short-term equilibrium between buyers and sellers.
After a strong trend runs its course, early participants take profits while new traders enter at different price levels, and no side carries enough conviction to push price decisively. Volatility, meaning the size of price swings over a given period, contracts as this tug-of-war plays out, and price begins to oscillate within a tight band.
Behind that quiet chart, positioning is quietly changing. Larger participants often use consolidation to accumulate or unload positions without moving price against themselves, which is why a sleepy range on the screen can hide a very active order book.
Recognising this balance helps you separate genuine consolidation, where volume dries up and the range is respected several times, from noise that never developed clear boundaries in the first place.
Common consolidation patterns you will see
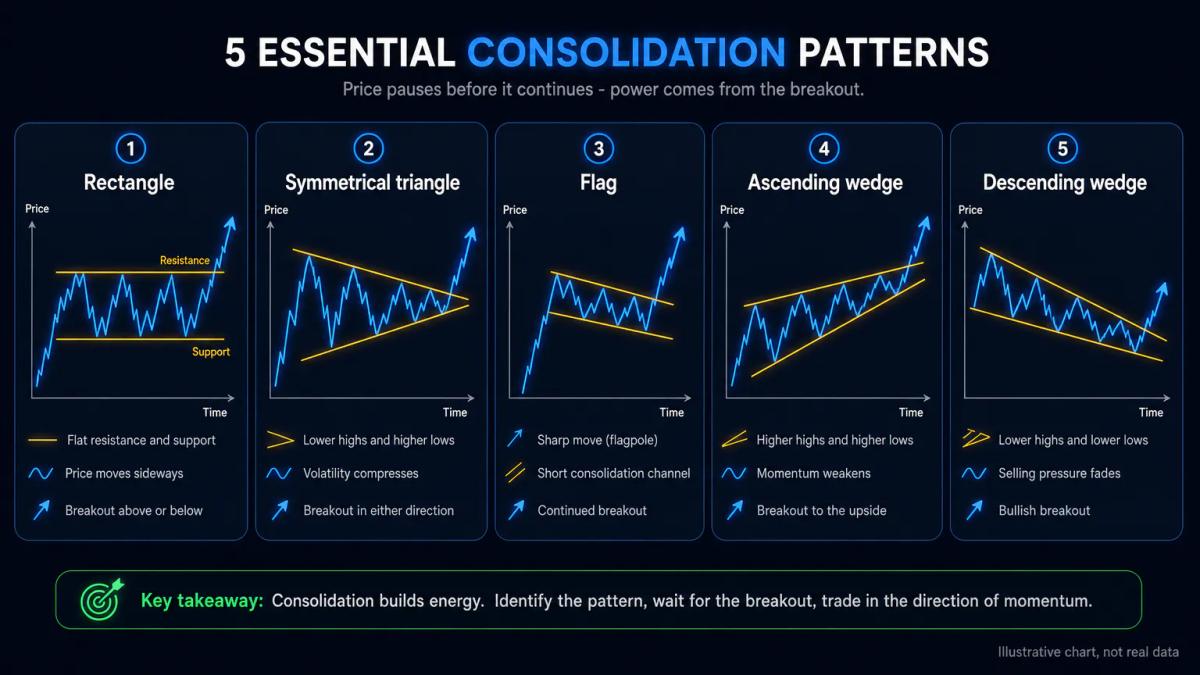
A consolidation pattern is a repeatable shape that price draws while it remains stuck sideways, and five of them cover most of what you will meet on real charts.
| Pattern | Shape | Typical break direction |
|---|---|---|
| Rectangle | Flat top and flat bottom | With the prior trend |
| Symmetrical triangle | Range narrows from both sides | Either way |
| Flag | Small parallel channel after a sharp move | With the prior trend |
| Wedge | Narrowing range sloping up or down | Against the slope |
| Pennant | Small triangle after a strong impulse | With the prior trend |
Rectangles, flags and pennants tend to break in the direction of the trend that preceded them, which is why traders lean on them as continuation setups. Triangles and wedges carry more ambiguity, and most traders wait for price to close decisively beyond one edge before committing capital.
Each shape also points you toward a natural home for your stop loss, the pre-set exit that limits how much you lose on a trade, which sits just on the other side of the boundary that was supposed to hold.
How to trade consolidation: three core approaches
Three strategies dominate consolidation trading, and picking one per setup is what keeps beginners out of trouble, since mixing them mid-trade is a common way that ranges cause losses. Getting familiar with the types of trading that apply to consolidation will help you settle on the right approach for your timeframe and your tolerance for risk.
- Range trading means buying near support and selling near resistance for as long as the range holds. It suits sideways markets with clear boundaries that price has tested repeatedly, and position size, the number of units you buy or sell, can run a little larger because your stop sits just beyond the boundary, which keeps the risk per trade tight.
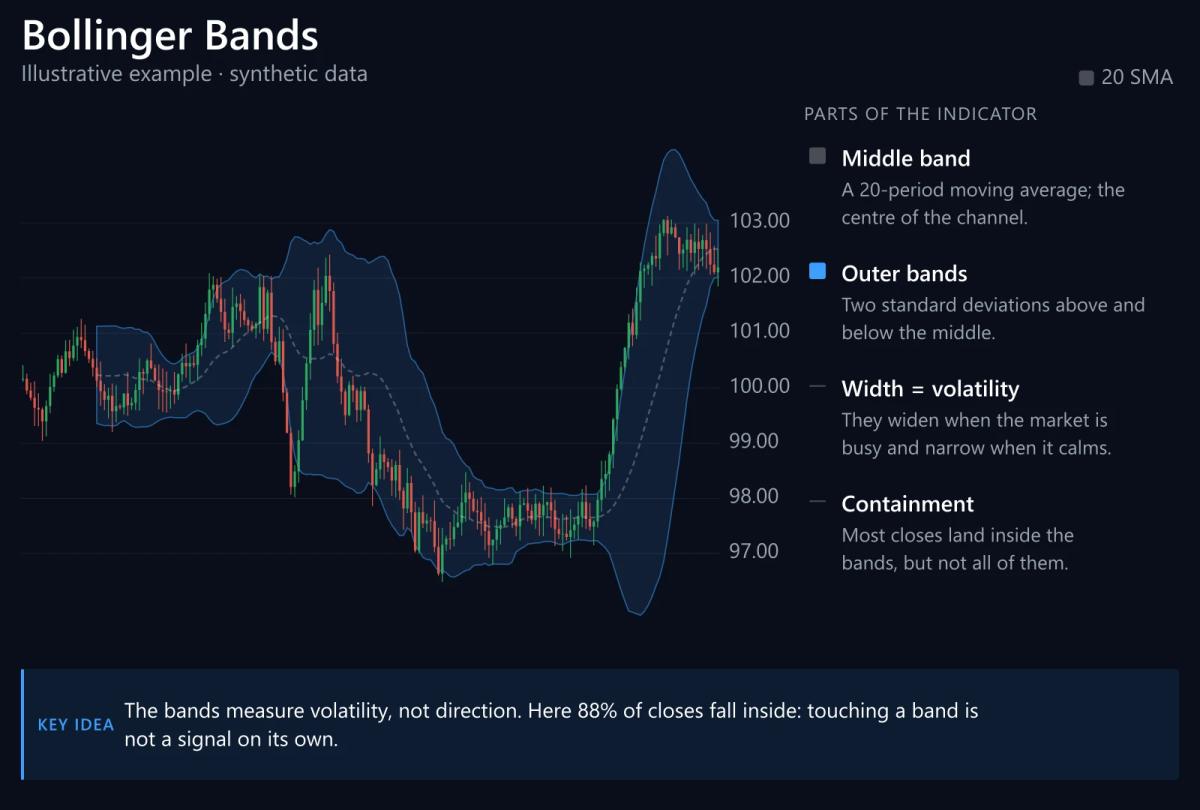
- Mean reversion is a bet that price will drift back toward the middle of the range after touching one of the extremes. It works best in narrow ranges with low volume and no fresh news pushing the asset around, and a Bollinger Band touch, from a volatility envelope drawn two standard deviations from a moving average, is one of the classic triggers traders use.
- Breakout trading waits for price to close beyond the range on rising volume before entering in the direction of the break, trading a worse entry price for the comfort of confirmation. Its most familiar hazard is the false breakout, where price pokes out of the range only to snap back inside within a few candles.
Range traders take their losses when the range breaks earlier than expected, breakout traders take theirs when a breakout fails to follow through, and mean reversion traders can suffer worst of all, because they tend to add into positions that are moving against them just as the real break arrives. Knowing which mode the market is in will do more for your results than memorising every pattern name.
Volume and accumulation: the hidden signal
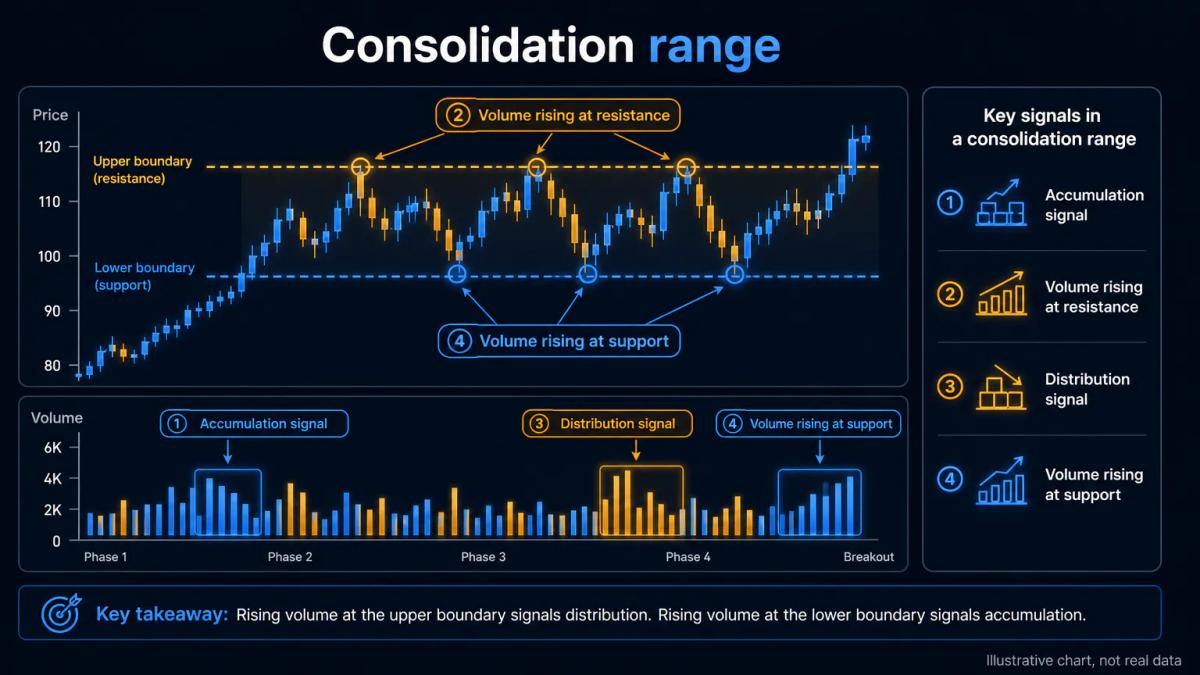
Volume is the number of units traded in a given period, and during consolidation it tells you things that price alone cannot. When volume falls throughout the range, traders are largely waiting, whereas a pickup in volume near one boundary is a hint that larger participants are quietly positioning for a break.
When volume expands as price presses the upper boundary, accumulation is the likely story and a bullish breakout becomes the higher-probability outcome, while an expansion in volume near the lower boundary points instead toward distribution and a bearish break.
Beyond raw volume, tools such as the Chaikin Volatility Indicator, Volume Profile, which plots how much volume traded at each price level, and Keltner Channels or Donchian Channels, which map volatility and range extremes, all help you separate consolidations with real conviction behind them from those built on thin trade.
Consolidation across timeframes: same pattern, different scales
A consolidation pattern often nests inside larger ones, so a tight range on a 5-minute chart may be little more than noise inside an hourly consolidation, which itself may sit inside a daily range. Multi-timeframe reading is how professionals sidestep the temptation to trade a break that the higher timeframe simply ignores.
A workable rule is to identify the consolidation on the timeframe you actually care about and then drop one timeframe lower to time your entries. If the daily chart is consolidating, an hourly breakout in the same direction offers a lower-risk entry than chasing the daily close, whereas trading a 5-minute break inside a daily range without any alignment is where most whipsaws, meaning fast reversals that stop you out on both sides, are collected.
Risk management in consolidation trading
Consolidation looks calm on the surface and can quietly lull traders into oversized positions, which is the real trap in these setups. Low volatility allows for tighter stops, yet risk per trade should still be capped at a fixed small percentage of your account, typically somewhere between 0.5% and 2%, no matter how quiet the chart happens to look.
Scale your position size to the width of the range, so a wider range calls for a wider stop and a smaller position rather than a larger one. For range trades, the stop belongs just beyond the level you are fading, while for breakout trades it works better placed just inside the range so a failed break exits you quickly. Boredom, impatience and the fear of missing the move are the real enemies inside a quiet chart, and a written plan for entry, stop and target, decided before you click the button, is what keeps those instincts out of the trade.
FCA: UK retail traders face leverage caps of 30:1 on major forex pairs, 20:1 on major indices and 5:1 on individual equities, and CFDs on cryptoassets are prohibited for UK retail clients.
Under these caps, position sizing during consolidation carries even more weight, because leverage is no longer available to paper over a poor entry inside the range.
Frequently Asked Questions
What is the difference between consolidation and a trading range?
A trading range is any period where price oscillates between two levels. Consolidation is a specific type of range: a pause inside a broader trend or after a strong move, where the market digests before the next leg. Every consolidation is a range, but not every range is a consolidation.
How long does consolidation typically last before a breakout occurs?
There is no fixed duration. Intraday consolidations can last minutes; daily and weekly consolidations can run for months. What matters more than time is the number of times each boundary is tested and whether volatility is contracting. Ranges that tighten with falling volume tend to resolve sooner than wide, choppy ones.
Can you trade consolidation on stocks, forex, crypto and commodities?
Yes, the pattern appears in every liquid market. Forex majors tend to form tight, symmetrical consolidations. Stocks often build rectangles after earnings. Commodities respect long horizontal ranges around supply-demand zones. Crypto ranges are wider and more prone to false breakouts because of thinner order books and 24/7 trading.
What indicators work for identifying consolidation besides Bollinger Bands?
Average True Range (ATR) shows contracting volatility. Keltner Channels and Donchian Channels highlight range extremes. Volume Profile shows where trade is concentrating inside the range, and a flat Average Directional Index (ADX) reading, typically below 20, confirms the absence of a trend.
How do you avoid false breakouts during consolidation?
Wait for a close beyond the boundary, not just a wick. Require expanding volume on the breakout candle. Check that the higher timeframe agrees with the break direction. If any of these are missing, treat the move as suspect and either skip the trade or use a smaller position size.
About the authors


Put this into practice
Brokers we have reviewed
Scored on the same five dimensions. Here are three of them — the full list is on the brokers page.



Related articles

Continuation vs. Reversal Patterns: How to Tell Them Apart and Trade Them
A beginner-friendly guide to continuation vs reversal patterns: definitions, worked examples, stop placement, profit targets, timeframes and indicator confirmation.

Demo to Live Trading Guide: How to Make the Switch Without Blowing Up
Learn how to move from demo to live trading without blowing up. Covers mindset, position sizing, and your first week live.

Does Technical Analysis Work? What the Evidence Actually Shows
Technical analysis is treated like gospel by traders and dismissed as astrology by academics. The honest answer sits somewhere in between, and it has real consequences for your money.
0 comments