



Technical Analysis · Beginner · 8 min read
Volume in Trading Explained: How to Read Market Activity
Volume in trading is the total number of shares, contracts or units of an asset traded during a specific time period, and it acts as a direct measure of market activity and liquidity. Higher volume signals stronger conviction behind a price move; low volume warns of weak interest or a fragile trend. For retail traders, volume is the tool that separates a genuine breakout from a false one.
What is volume in trading and why does it matter?
Volume in trading counts how many units of an asset changed hands in a given period, whether that period is a one-minute candle or a full trading day. It is plotted as a histogram beneath the price chart, and each bar corresponds to the candle above it. A pip (the smallest standard price increment in forex, typically 0.0001 on most pairs) tells you how far price moved; volume tells you how much force was behind the move.
Price alone is incomplete. A 2% rally on ten times the average volume is a very different event from the same rally on a quiet Friday afternoon. Institutional traders leave footprints in volume, and reading those footprints is how you infer where the smart money is positioned. Without volume, you are watching the score without knowing how many players are on the pitch.
Choose a broker with strong charts among the best forex & CFD brokers.
How is trading volume calculated and measured?
Trading volume is calculated by counting every executed transaction during a defined time window. When a buyer's order is matched with a seller's for 1,000 shares, that single transaction adds 1,000 to the volume total, not 2,000: the trade is counted once, from either side. On centralised exchanges such as the London Stock Exchange or CME, this figure is exact and published in real time.
On charts, volume appears as vertical bars below the candles, with bar height representing units traded in that candle's period. Colour coding is common: green bars for candles that closed up, red for candles that closed down. Some platforms show notional volume (units multiplied by price), which is more useful when comparing assets at very different price levels.
Volume as a liquidity and market activity indicator
Volume tells you how easily you can enter or exit a position without moving the market. Liquidity (the ease of converting a position into cash at a fair price) rises with volume: high-volume assets show tight spreads, deep order books and fast execution. Low-volume assets show wider bid-ask gaps and slippage, meaning your fill price drifts away from the quoted price.
Markets with steady volume attract institutional participation, which further tightens spreads and stabilises price discovery. If you trade the EUR/USD or SPY, you are unlikely to move the market with a retail-sized order; if you trade a small-cap stock or a low-cap altcoin, even a modest position can shift the price against you.
Understanding volume patterns also helps you pick timeframes. London and New York session overlaps show the highest forex volume; the first and last hours of the US equity session show the highest stock volume. Trading in those windows means better fills and cleaner price action.
Volume and price: confirming trends and spotting reversals
A price move backed by rising volume is more reliable than one on declining volume, because rising volume shows broad agreement among market participants. When price climbs on expanding volume, buyers are in control and the trend has fuel; when price falls on expanding volume, sellers dominate and the decline has weight. Traders call this healthy price action.
The opposite pattern, price advancing on shrinking volume, is a classic divergence and a warning that the move is running out of participants. This is where reversals often start. A common example: a stock makes a new high but volume is 30% below its 20-day average, suggesting the rally is being pushed by momentum traders rather than fresh committed buyers.
Volume also confirms breakouts. A break above a resistance level on double the average volume has a much higher probability of following through than a break on quiet trading. Retail traders who ignore volume often chase these low-volume breakouts and get trapped when price snaps back, which is why learning to identify real breaks from false ones is essential.
Common volume patterns and what they signal
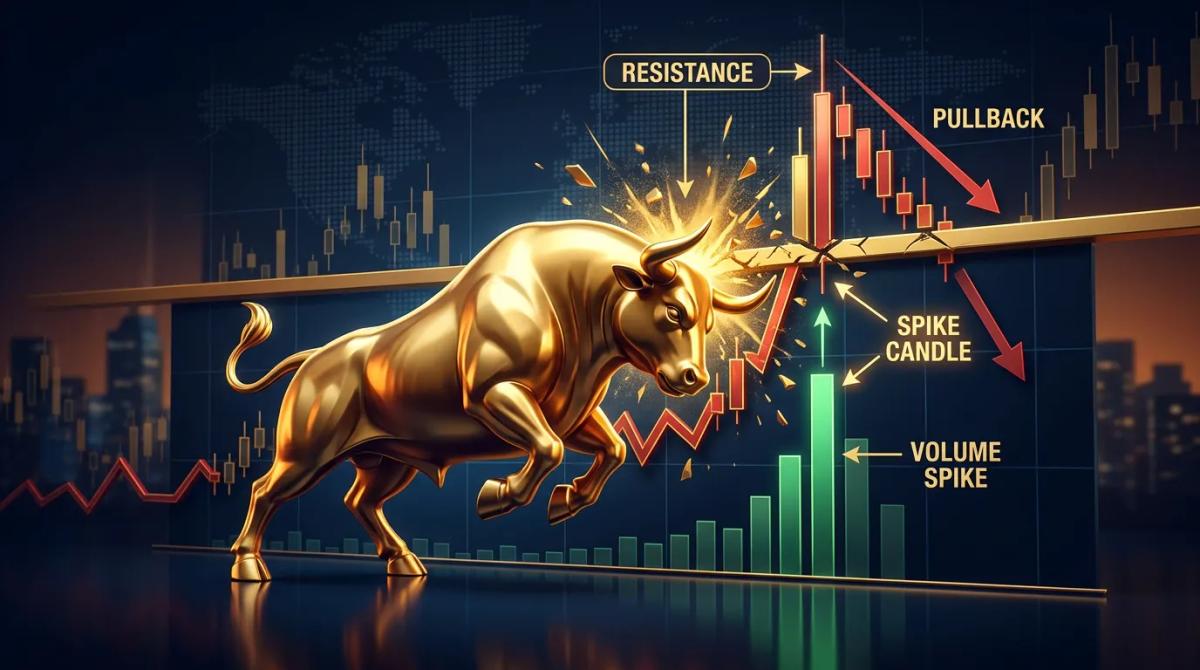
Volume spikes cluster around meaningful events: economic releases, earnings, tests of major support or resistance, and breakout attempts. A spike into resistance followed by a pullback often marks profit-taking or absorption by larger sellers. A spike on the breakout itself, closing at the high of the candle, usually indicates the move has legs.
Low volume during consolidation is normal and expected: the market is digesting a prior move. What matters is what happens when consolidation ends. Volume drying up inside an established uptrend, however, is a different signal: it suggests demand is exhausted and a pullback or reversal is closer than the price chart alone would suggest.
Climatic volume, an extreme spike after a long trend, often marks exhaustion rather than continuation. If a stock rallies for weeks and then prints its highest volume bar with a wide-range candle that closes off the highs, that is frequently the top.
Volume indicators: OBV, VWAP, and accumulation/distribution
On-Balance Volume (OBV) adds volume on up-candles and subtracts it on down-candles to produce a cumulative line. When OBV rises while price is flat, buyers are accumulating; when OBV falls while price is flat, distribution is under way. Divergences between OBV and price often precede reversals.
Volume-Weighted Average Price (VWAP) is the average traded price weighted by volume across the session. Institutional traders use VWAP as a benchmark: buying below VWAP is considered a good fill, selling above it is considered strong execution. Retail traders use VWAP as dynamic support and resistance, especially on intraday charts.
The Accumulation/Distribution line combines the position of the close within the candle's range with volume, producing a running score of money flow. Rising A/D with rising price confirms the trend; rising A/D with falling price is a bullish divergence.
| Indicator | What it shows | Best used for |
|---|---|---|
| OBV | Cumulative buying vs selling pressure | Spotting divergences with price |
| VWAP | Volume-weighted average price | Intraday entries and exits |
| A/D line | Money flow into or out of an asset | Confirming trends, finding reversals |
CME Group, 2024: VWAP is one of the most widely used execution benchmarks by institutional desks, appearing in the majority of algorithmic order types offered on the exchange.
Volume analysis across forex, crypto, and commodities
Forex is decentralised, so there is no single global volume figure. Retail platforms show tick volume (the number of price changes per period) as a proxy, which correlates well with actual transaction volume during liquid sessions but breaks down in thin markets. Some brokers report notional volume from their own order flow, useful but not market-wide.
Crypto exchanges publish volume, but figures vary enormously between platforms and wash trading has historically inflated numbers on smaller venues. Cross-checking volume across two or three reputable exchanges gives a more honest read. According to the FCA, CFDs on cryptoassets are prohibited for UK retail clients (policy in force since January 2021), so UK-based traders access crypto volume data through spot exchanges rather than CFD brokers.
Commodities futures traded on CME or ICE publish exact volume, and patterns tend to be cleanest during the US pit session hours. This makes futures volume the reference standard for volume analysis.
Practical volume trading strategies for retail traders
Use volume as a filter, not a signal on its own. A rule that has held up well: only take a breakout trade if the breakout candle prints volume at least 1.5 times the 20-period average. This single filter removes most of the false breakouts that punish trend-following retail traders.
Combine volume with structure. A bounce off a well-tested support level on rising volume is a higher-probability long than the same bounce on falling volume. A rejection at resistance with a volume spike and a long upper wick is a stronger short setup than a quiet rejection, which is why understanding support and resistance trading is crucial.
Size your positions to liquidity. If the asset you trade shows average volume that your position would consume in a single candle, you are the market for that asset and slippage will be brutal. Stick to instruments where your typical order is a rounding error in the order book, and volume analysis becomes a tool rather than a trap.
Frequently Asked Questions
What is the difference between volume and price action?
Price action is what the market did; volume is how many participants agreed with it. A price move without supporting volume is a suggestion, not a decision, and often reverses.
How do I know if volume is high or low on a chart?
Compare the current volume bar to a moving average of volume, typically 20 periods. Most charting platforms plot this average as a line across the volume histogram, making outliers visible at a glance.
Can I trade profitably using volume analysis alone?
No. Volume is a confirmation tool, not a standalone system. It works when combined with price structure, support and resistance, or a trend framework. On its own it tells you activity, not direction.
Why does volume matter more on some timeframes than others?
Longer timeframes aggregate more transactions, producing cleaner and more meaningful volume bars. On one-minute charts, single large orders can distort the picture; on daily charts, one bar reflects the full participation of the session.
How do volume spikes relate to support and resistance levels?
Volume spikes at support or resistance signal that both buyers and sellers view the level as important. A spike with a rejection candle strengthens the level; a spike with a clean break through it suggests the level has flipped and the move will continue.
About the authors


Put this into practice
Brokers we have reviewed
Scored on the same five dimensions. Here are three of them — the full list is on the brokers page.



Related articles

W Candlestick Form Explained: From Recognition to Execution
A working guide to the W candlestick form: how it builds, how to trade it, where to place your stop, and how to spot the failure modes that trap retail traders.

What Is a Break of Structure in Trading? BOS Price Action Explained
A plain-English guide to break of structure: how to spot bullish and bearish BOS, tell it apart from Change of Character, and avoid the classic mistakes.
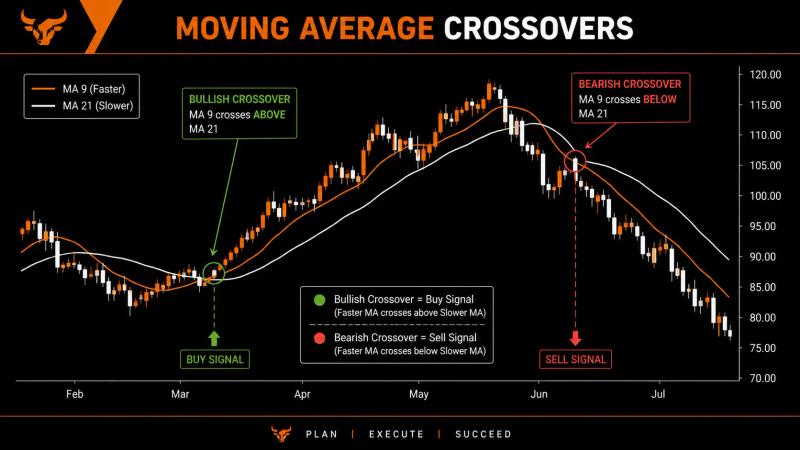
Moving Averages Explained: SMA, EMA, and How Traders Use Them
Moving average trading explained simply. Learn how SMA and EMA work, how to read crossovers, and how traders use them to spot trends and time entries.
0 comments