



Technical Analysis · Beginner · 12 min read
Bearish Candlestick Patterns: How to Identify and Trade Reversals
What bearish candlestick patterns tell you about price action
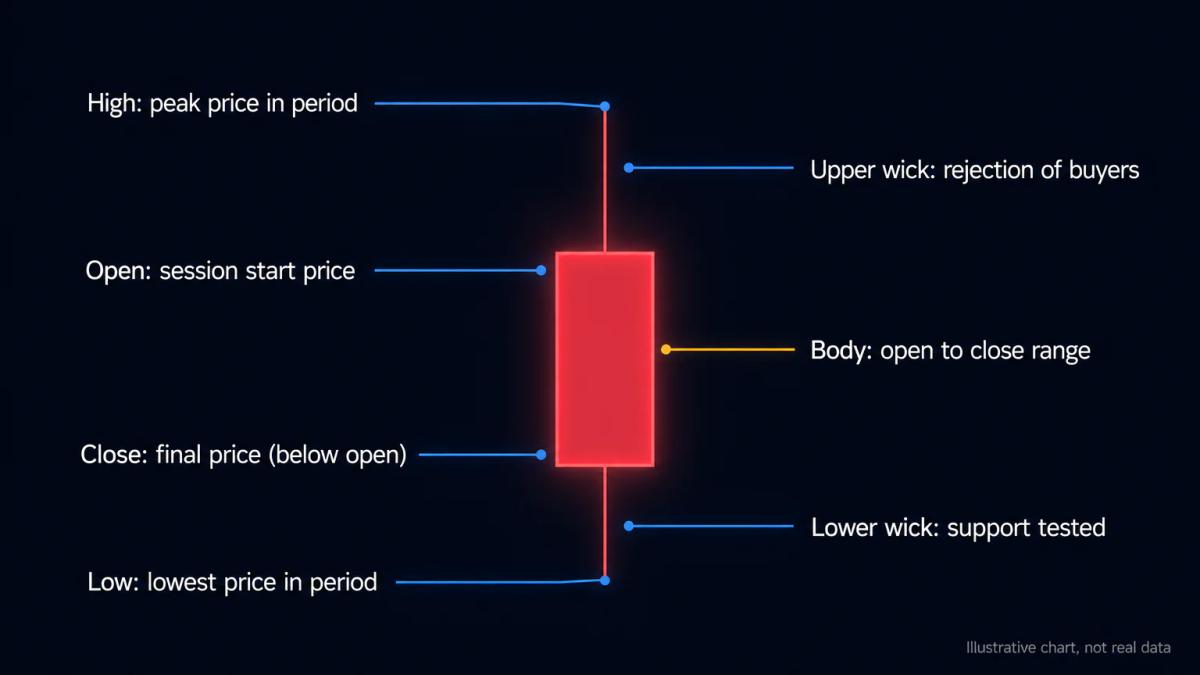
Bearish candlestick patterns are one or multi-candle formations that signal potential downward price movement or a trend reversal. They form when sellers wrest control from buyers, closing price near the session low and printing a recognisable shape on the chart. Reading them helps you spot weakness before a decline accelerates.
A candlestick shows four data points inside one time bar: the open, the high, the low and the close.
The rectangular body runs from open to close; the thin lines above and below (the wicks or shadows) mark the extremes reached during the bar. When the close sits below the open, the body is coloured red or black and the bar is bearish. A pattern is the arrangement of two or more of these bars into a shape that history associates with a specific outcome.
The patterns worth learning fall into three families: engulfing formations (a large red candle swallows the prior body), star formations (a small indecision candle sits between two directional bars), and rejection candles (long upper wicks that show buyers were pushed back).
Each family has a bullish counterpart; here you are looking at the sell side. Like other candlestick formations, treat every pattern as a hypothesis, not a prediction: the setup earns your capital only when price action, level and context agree.
Choosing where to trade matters as much as the strategy; see the best forex brokers and their conditions.
Engulfing and evening star: the two most common reversals
The bearish engulfing pattern and the evening star are the two setups most retail traders learn first, and both mark potential tops after an uptrend. The engulfing is a two-candle formation; the evening star is a three-candle formation.
Both work best when they appear at a prior resistance level (a price zone where sellers have historically capped rallies) and are followed by a candle that closes lower.
A bearish engulfing forms when a small green (up) candle is followed by a large red (down) candle whose body completely covers the prior body. The message is a violent handover: buyers ran out of demand and sellers not only reversed the day, they erased it. The pattern is stronger when the red candle also engulfs the wicks, and when volume on the red bar is above the recent average.
An evening star has three parts: a strong up candle, a small-bodied candle that gaps up or stalls at the highs (this middle bar can be a doji, a candle whose open and close are almost identical), and a red candle that closes deep into the body of the first bar. The middle candle marks the exhaustion; the third bar confirms sellers have taken over.
| Pattern | Candles | Where it appears | What confirms it |
|---|---|---|---|
| Bearish engulfing | 2 | Top of an uptrend, at resistance | Red body covers prior body; volume above average |
| Evening star | 3 | Top of an uptrend, at resistance | Third candle closes past midpoint of first candle |
| Evening doji star | 3 | Top of an uptrend | Middle candle is a doji; strong red confirmation |
Shooting star and hanging man: high-wick reversals
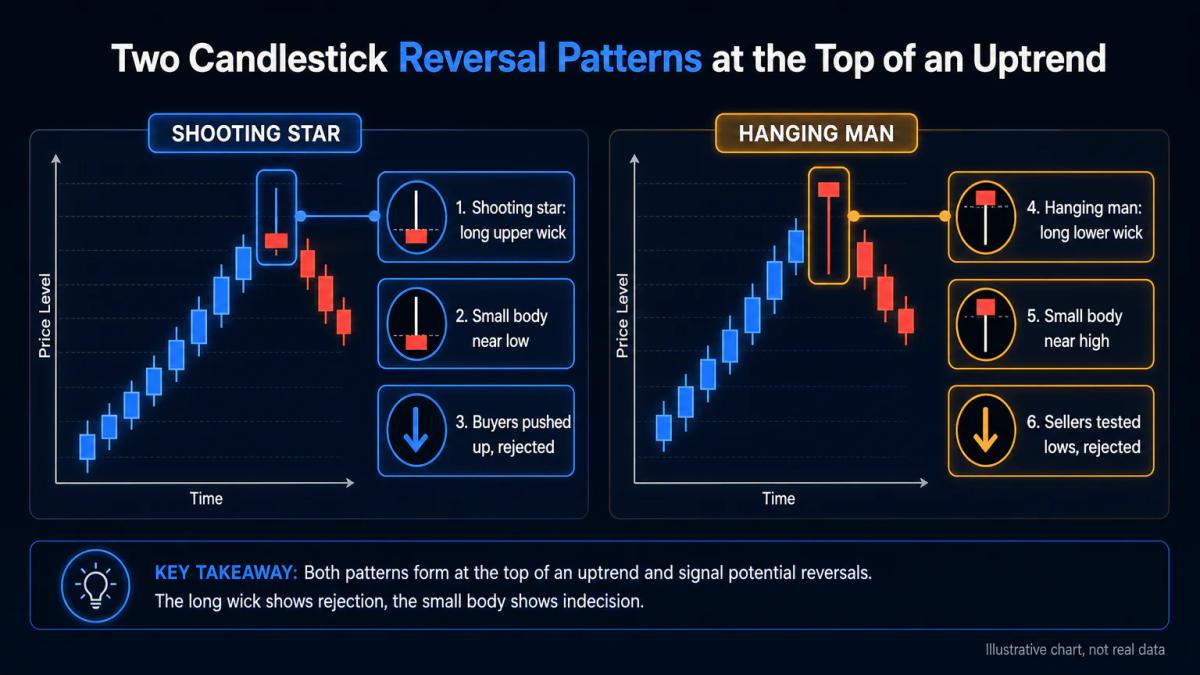
The shooting star and the hanging man are single-candle rejection patterns: they show buyers pushed price up during the bar and were shoved back before the close. Visually they are almost identical (a small body near the low, a long upper wick, little or no lower wick), but their meaning depends on where they appear on the chart.
A shooting star sits at the top of an uptrend. The long upper wick is at least twice the length of the body, and the close is near the open, near the low of the bar. It says buyers tried to extend the rally, sellers rejected the highs, and the session ended near where it started. The shooting star pattern is most reliable when it forms just above a known resistance or a round number, and is followed by a red candle.
A hanging man has the same shape but appears at the top of an uptrend with a long lower wick, not an upper one. Buyers rescued the session, but the fact that sellers were able to push price down that far after a sustained rally is the warning. The hanging man pattern needs confirmation more than most: a lower close on the next bar is the trigger. Without confirmation, both patterns are just wicks, and wicks alone lose money often enough to be treated with respect.
How to confirm bearish patterns and filter false signals
A bearish candlestick pattern is most reliable when three conditions line up:
- It forms at or just above a resistance level.
- It is followed by a candle that closes lower.
- Volume on the pattern bar is above the recent average.
Miss one of these and the pattern is a hypothesis; miss two and you are guessing.
Start with structure. Mark the highs and lows the market has respected in the recent past on your chart before you look for candles. A shooting star that prints inside a range is noise; the same shooting star that prints at the upper edge of a two-month range is a signal worth acting on. Support and resistance levels give the pattern a reason to work: they are where orders sit and where reversals actually happen.
Add a confirmation candle. Waiting for the next bar to close lower than the pattern low filters out the majority of false breaks, at the cost of a slightly worse entry. Then check volume: on stocks and crypto, above-average volume on the pattern bar confirms real participation, not a thin-market drift. In forex, tick volume from your platform is a reasonable proxy since true volume is decentralised.
Finally, use a second tool. An RSI reading above 70 that starts to roll over, or a bearish divergence (price making a higher high while RSI makes a lower high), stacks probability in your favour. Two independent signals agreeing is worth more than any single perfect-looking candle.
Risk management when trading bearish reversals
Every bearish pattern trade needs a defined stop loss, a defined position size, and a defined target before you click sell. Place the stop just above the pattern's high, size the position so a stop-out costs no more than 1 to 2% of your account, and know in advance where you will take profit or trail the stop.
A simple position size formula: divide your risk budget by the distance from entry to stop, in the instrument's price units. If your account is $10,000, you accept 1% risk ($100), and the stop sits $2 above your entry on a stock, you can trade 50 shares.
On forex, if the stop is 30 pips (a pip is the fourth decimal on most pairs, or the second on JPY pairs) away and you accept £50 of risk, position size is £50 divided by 30 pips of pip value.
For UK retail clients, the FCA caps leverage: 1:30 on major forex pairs, 1:20 on major indices and gold, 1:10 on minor commodities and non-major indices, 1:5 on individual equities, and 1:2 on non-major cryptocurrencies. CFDs and spread bets on cryptocurrencies are banned for UK retail clients by the FCA. Any broker onboarding you as a UK retail client under FCA authorisation must apply these caps; if the broker onboards you through an offshore entity, those protections do not apply.
Bearish patterns across forex, crypto, and stock markets
Bearish candlestick patterns work across every liquid market, but their reliability depends on the asset's microstructure and the timeframe you trade. The same shooting star means one thing on the daily EUR/USD chart and something quite different on a 5-minute chart of a mid-cap stock during lunchtime.
Forex is the cleanest environment for candlestick reading. The market runs 24 hours across sessions, spreads on majors are tight, and the four-hour and daily charts of pairs like EUR/USD, GBP/USD and USD/JPY produce well-formed patterns because participation is broad and deep. According to the Bank for International Settlements, average daily turnover in global foreign exchange markets reached $7.5 trillion in April 2022, and the majors dominate that flow. Understanding how forex trading works helps you see why liquidity is what makes candles honest.
Cryptocurrency is noisier. Weekend trading, thin order books on smaller coins and 24/7 sessions produce wicks that look like rejection patterns but are actually liquidity sweeps. Daily and weekly candles on the majors (BTC, ETH) are still readable; below the four-hour timeframe you are trading noise more than structure.
Remember that CFDs on crypto are prohibited for UK retail clients: to trade crypto reversals from the UK, you would need spot crypto through an FCA-registered firm.
Stocks demand volume confirmation. A bearish engulfing on a single-name equity without a spike in traded volume is often just the market maker adjusting inventory.
Look for the pattern to print on volume at least 50% above the twenty-day average, and be aware that individual equities have earnings dates, index rebalances and other catalysts that override any candlestick signal. When comparing stocks versus indices, patterns behave more like forex on indices because the underlying is a basket, not a single balance sheet.
Why backtesting and timeframe matter more than pattern names
A bearish engulfing on a 5-minute chart may reverse within an hour; the same pattern on a daily chart often leads to multi-day declines. Timeframe changes the meaning of every candlestick, which is why the only honest way to know whether a pattern works for you is to test it on the specific market, the specific timeframe and the specific rules you plan to trade.
Backtesting means walking through historical data bar by bar and recording what would have happened if you had traded each occurrence of the pattern with your defined entry, stop and target rules. A serious test needs at least one hundred occurrences to say anything, and it needs to include the losers as well as the winners.
Two numbers matter: the win rate (percentage of trades that hit target before stop) and the average risk to reward (average win divided by average loss). A 40% win rate at 2:1 reward-to-risk is profitable; a 60% win rate at 0.5:1 is not.
On higher timeframes, patterns are slower but cleaner. Daily and weekly candles filter out most intraday noise because each bar aggregates thousands of trades and every major session. On the 1-minute or 5-minute chart, the same shape appears far more often but with a much lower success rate, because individual bars are moved by single orders or algorithmic quotes. Beginners are best served on the four-hour and daily charts: fewer setups, more meaningful ones, more time to think between decisions.
Backtesting also reveals which patterns simply do not work for your market. You may find the evening star is reliable on daily forex charts but almost random on 15-minute crypto. That answer is more valuable than any generic pattern description.
Common mistakes when trading bearish candlestick patterns
The most expensive mistake is trading the pattern in isolation, without checking the broader trend, the position of resistance, or the volume behind the bar. A bearish engulfing in the middle of a strong uptrend, with no resistance overhead, is almost always a pullback that gets bought within days. The pattern is only a piece of the case; the level and the trend are the rest.
Entering too early is the second common error. Traders anticipate the pattern by entering before the pattern candle closes, then watch the candle close as a doji or a green bar and hold a losing short. Wait for the close. If you are on a daily chart, wait for the daily close. The extra hours cost nothing and remove most whipsaw trades.
Ignoring volume ruins otherwise good setups, particularly on stocks and crypto. A shooting star on light volume is often a single seller with no follow-through; on heavy volume the same shape signals institutional distribution. Check the volume bar on every candlestick trade.
Oversizing is the fastest way to blow an account. Retail traders who read that a pattern has a 60% win rate often size as if the next trade is guaranteed. The 40% of losing trades cluster: three or four losses in a row is normal on any strategy. Position size for the losing streak, not the winning trade. According to the FCA, 82% of retail investor accounts lose money when trading CFDs at authorised firms, and the underlying cause in most cases is poor sizing and no stop, not poor pattern selection.
Finally, no stop loss is not a strategy. Every bearish pattern trade must have a defined exit above the pattern high before you enter. If the level breaks, you were wrong; the trade closes; you move on.
Developing trading discipline and risk awareness is what separates traders who last from traders who don't.
Frequently Asked Questions
What is the difference between a bearish engulfing pattern and a bearish harami?
A bearish engulfing pattern is a large red candle whose body completely covers the prior green candle's body, signalling a strong takeover by sellers. A bearish harami is the opposite geometry: a small red candle sits inside the body of the prior larger green candle, signalling indecision after an uptrend rather than an aggressive reversal. The engulfing is a stronger, faster signal; the harami usually needs an extra confirmation bar before you act on it.
Can bearish candlestick patterns be used on 1-minute or 5-minute charts, or only on daily charts?
Bearish patterns appear on every timeframe, but reliability drops sharply on the lowest intraday charts. On 1-minute and 5-minute charts individual bars are moved by single orders and algorithms, so the same shape carries much less information than on a daily chart. Beginners typically get cleaner signals on the four-hour and daily charts, where each candle aggregates far more trading activity.
How do I know if a bearish pattern is a true reversal or just a temporary pullback?
You cannot know in advance, which is why confirmation matters. A true reversal usually forms at a clear resistance level, prints on above-average volume, and is followed by a candle that closes below the pattern low. A pullback typically forms mid-range, on ordinary volume, and is bought back within one or two bars. Waiting for the confirmation close filters out most of the temporary pullbacks.
Do bearish candlestick patterns work better in trending markets or ranging markets?
They work in both, but the setup is different. In an uptrend, a bearish pattern at a known resistance can mark a full reversal or the start of a deeper correction. In a range, bearish patterns at the top of the range are essentially mean-reversion trades back to the middle or the bottom. What does not work is trading bearish patterns against a strong ongoing downtrend, where the pattern is often a low-quality bounce top with limited follow-through.
Should I use bearish patterns alone or combine them with other technical indicators like moving averages or RSI?
Combine them. A candlestick pattern is a single piece of evidence; combining it with a second, independent tool (a moving average acting as resistance, an RSI reading above 70 rolling over, a bearish divergence between price and momentum) stacks probability in your favour. Two agreeing signals is worth much more than one perfect-looking candle. That said, avoid stacking five indicators: at that point you are curve-fitting rather than trading.
About the authors


Put this into practice
Related articles

Bollinger Bands explained: how to read and trade this volatility indicator
A trader-focused guide to Bollinger Bands: how the three lines are built, what band touches really mean, and how to avoid the mistakes that trap retail traders.

Building Custom Performance Indicators for Intraday Trading
A practical guide to designing, coding, testing and deploying custom performance indicators tuned to your intraday edge, across MT4, MT5, TradingView and cTrader.

Bull Flag vs Bear Flag: How to Spot and Trade Continuation Patterns
A practical guide to bull flags and bear flags: how to identify each pattern, confirm breakouts with volume, size positions and avoid common failure traps.
0 comments