



Technical Analysis · Advanced · 9 min read
Building Custom Performance Indicators for Intraday Trading
What custom performance indicators do and why intraday traders use them
Every intraday trader eventually runs into the same limit: the tools bundled with a charting platform were built for a generic audience and cannot see what actually works in your own trade log. A custom performance indicator is a small program you build to measure outcomes tied to your specific strategy, whether that is win rate, average profit per trade, drawdown recovery speed or any other pattern you have already spotted in your results. Since market conditions shift within hours, a metric designed for weekly swings often misses the nuance a day trader depends on.
In this context an indicator is a small program that reads price data (or your own trade history) and outputs a number, a signal or a plot on the chart. A standard one like the Relative Strength Index applies the same fixed formula to every asset and every trader who loads it. A custom version can be shaped around your own session, your instrument and your definition of a winning setup, which is where its usefulness begins.
The reason intraday traders bother to build their own is simple enough. Edges inside a single session tend to be narrow and time-boxed, so if you trade the first hour after the London open on GBP/USD a general oscillator built for daily charts will rarely tell you whether your specific pattern is still working this week. A custom metric, tuned to that window, gives you a straight answer. Writing the logic in code also forces you to define your edge precisely, which is often the quickest way to discover whether the edge is real or lives mostly in memory.
Where you trade shapes the outcome as much as the strategy itself; browse the best forex brokers and their conditions before committing.
How standard indicators compare with ones you build yourself
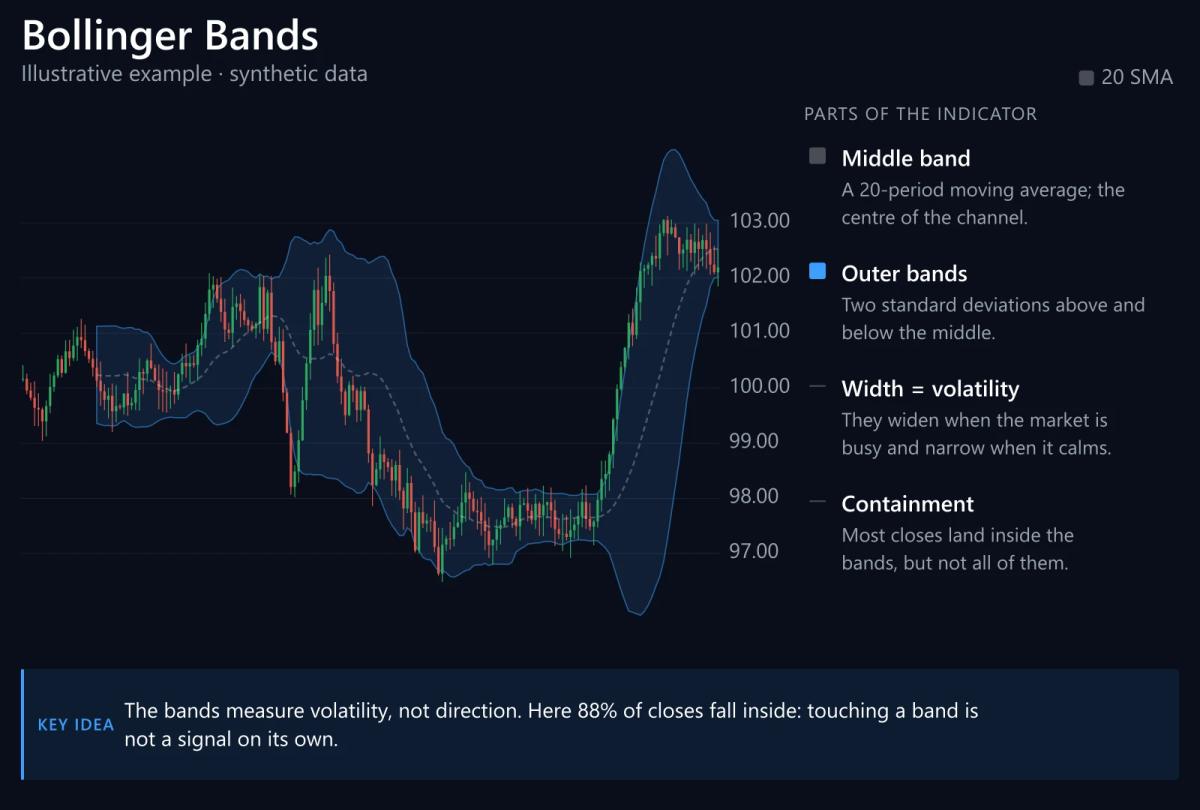
Standard indicators are pre-programmed formulas: RSI, MACD, moving averages, Bollinger Bands. They apply the same calculation to any asset and any timeframe, which is why they travel so easily between traders. A custom indicator lets you set the exact formula, the inputs, the output and the visual you want on the chart, so the reading maps onto your specific intraday rules.
The advantage this brings is control over what is being measured. A standard RSI reports when price is stretched by a fixed lookback, whereas a custom indicator can count how often your entry signal fires in the first 30 minutes of the London open on GBP/USD, track the ratio of winners to losers on a 5-minute chart, or flag only the setups that meet three conditions you have written down yourself.
| Aspect | Standard indicator | Custom indicator |
|---|---|---|
| Formula | Fixed by the platform | Defined by you |
| Inputs | Usually one or two parameters | Any variables you choose |
| Output | Generic signal (overbought, crossover) | Metric tied to your rules |
| Reuse | Same across all traders | Unique to your strategy |
| Debugging | Vendor documentation | Your own code and logs |
That level of control comes with a responsibility for the logic, the maintenance and the interpretation of the results, since no vendor will step in when the indicator behaves oddly. In return you gain a measurement that reflects how you actually trade at the screen, closer to reality than a textbook default.
How to build a custom performance indicator step by step

Building a custom indicator starts with defining what you want to measure, then writing or configuring the formula and testing it on historical data to confirm it captures your edge. Without a clear definition at the top, every downstream step becomes guesswork rather than analysis.
Begin with the metric itself. Write it as a plain-English sentence so the specification is unambiguous before any code is opened, for example: count the trades on the 5-minute EUR/USD chart between 08:00 and 10:00 London time that hit a 1:2 risk-reward before stopping out. Common measurements to choose from include:
- Win rate, filtered by session or setup.
- Profit factor, calculated as gross profit divided by gross loss.
- Average trade duration, useful when you want to see whether winners run and losers get cut.
- A composite score that combines several of the above into a single number.
With the specification in hand, choose the platform. Your options for retail intraday work sit across four ecosystems:
- MT4 and MT5 use MQL4 and MQL5, C-like scripting languages with strong tester support on MT5.
- TradingView uses Pine Script, which is simpler than MQL and runs directly in the browser.
- cTrader uses cAlgo, based on C#, and appeals to anyone who already writes .NET code.
As a starting point, a minimal Pine Script skeleton for a session win-rate counter looks something like this:
//@version=5
indicator("Session Win Rate", overlay=false)
inSession = time(timeframe.period, "0800-1000")
long = ta.crossover(close, ta.sma(close, 20)) and inSession
win = long and close[5] > close
plot(ta.cum(win ? 1 : 0) / ta.cum(long ? 1 : 0), "Win rate")
That block declares an indicator, restricts signals to a session window, defines a trivial entry (price crossing a 20-bar simple moving average), then plots a running ratio of winners over total signals. Keeping the code this compact at first makes each behaviour easy to verify, and any additional logic can be added later once the data actually calls for it.
Backtest the indicator against at least a few months of intraday bars, then forward-test it on a demo account for two weeks before you commit any capital. Refinements to the parameters are best introduced gradually, in line with what the accumulating evidence actually shows.
Platforms that support custom indicator creation for intraday trading
Most retail intraday work happens on one of four platforms: MT4, MT5, TradingView and cTrader. Each of them handles custom indicators, though the effort involved, the language you write in and the integration path towards live orders differ.
| Platform | Language | Learning curve | Automated orders | Best for |
|---|---|---|---|---|
| MT4 | MQL4 | Moderate | Yes, via Expert Advisors | Forex intraday, wide broker support |
| MT5 | MQL5 | Moderate to high | Yes, via Expert Advisors | Multi-asset, faster backtester |
| TradingView | Pine Script | Low | Via webhooks and broker bridges | Fast iteration, browser-based |
| cTrader | cAlgo (C#) | High | Yes, via cBots | Developers, ECN-style execution |
MT4 remains the most common platform offered by retail forex brokers, so an MQL4 indicator will usually run wherever you open an account, while MT5 brings a stronger tester and covers more asset classes. TradingView is the fastest way to prototype: you can write a Pine Script, see it drawn on the chart, and edit it without recompiling, which suits intraday iteration well. cTrader tends to appeal to traders who already know C# and want tighter control over how orders are routed.
Connecting a custom indicator to live orders takes a different form on each platform. On MT4 and MT5 the logic is wrapped inside an Expert Advisor that reads the indicator's values and sends trades, while cTrader uses cBots that reference the same C# code. TradingView, which does not execute orders itself, relies on alerts and webhooks routed to a broker bridge: the indicator fires an alert, the webhook posts to your broker's API and the order goes in. That extra hop adds latency compared with a native MT5 EA, which becomes a real concern when your edge lives inside a few seconds.
If your broker is UK-based, check which entity onboards you and under which licence before committing to a platform. An FCA-authorised entity, which sits at the top tier for UK retail clients, applies leverage caps of 1:30 on major forex pairs, 1:20 on indices and 1:5 on equities, while CFDs on cryptocurrencies are prohibited for UK retail by the FCA. Offshore group entities in the same broker family are flagged as such and typically offer very different terms.
Common metrics intraday traders build into custom indicators
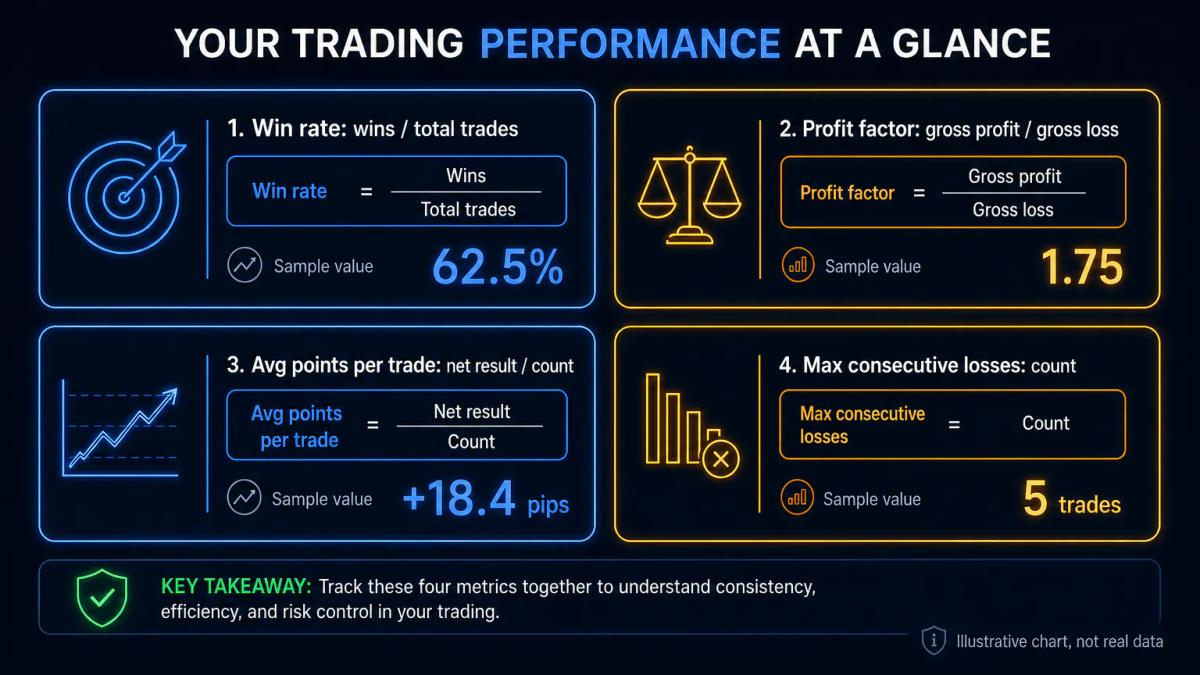
Most useful custom indicators track a small number of specific measurements rather than a broad dashboard. The metrics below are the ones that reappear in serious intraday work.
- Win rate: winning trades divided by total trades, filtered by session or setup.
- Profit factor: gross profit divided by gross loss; anything below 1.0 is a losing system before costs.
- Average points per trade: net result divided by trade count, in pips or ticks.
- Maximum consecutive losses: sizes your risk budget for a bad run.
- Time-of-day performance: results grouped into 30-minute or hourly buckets.
- Volatility filter: Average True Range at the session open, used to skip flat or wild conditions.
- Setup frequency: how often your entry pattern actually appears per session.
The most productive custom indicators tend to sit directly on top of your actual edge. If you trade breakouts in the first hour of the US open, for example, your indicator should measure breakout frequency and success rate inside that window rather than generic overbought conditions borrowed from a different regime. If your losing trades tend to cluster around lunchtime in London, a heat map of results by hour will tell you more than adding yet another oscillator to the chart.
You can also export the values to Excel or Python for deeper analysis: MT5 writes to CSV natively, and Pine Script data can be pulled from the strategy tester's list of trades.
Testing and refining your custom indicator with historical data
Once the indicator is coded, backtest it against at least 100 to 500 intraday trades to check that it reflects your edge and does not fire false signals. Use the platform's built-in tester, or export historical price data and your own trade log and compare what the indicator would have flagged against what actually happened.
Look for gaps in both directions: setups the indicator missed that you took manually and made money on, and setups it flagged that ended in losses. Either mismatch signals that the specification needs work. Adjust one parameter at a time and then retest, because changing several inputs together makes it impossible to attribute any improvement, so pick a single lever, whether that is the moving-average period, a threshold or a session filter.
Forward-test on a demo account for at least two weeks before committing real capital, and watch how the indicator behaves across different regimes: trending days, choppy consolidations and high-volatility news windows. A metric that behaves cleanly on calm days but breaks down when the ATR doubles is unlikely to hold up in intraday work. Common deployment errors include timezone mismatches (with the session filter running on server time rather than London time), incorrect handling of the first bar of the session and data feeds that differ between the tester and the live chart. Printing intermediate values to the terminal until each stage matches your expectation usually surfaces the culprit quickly.
Avoiding common pitfalls when building custom indicators
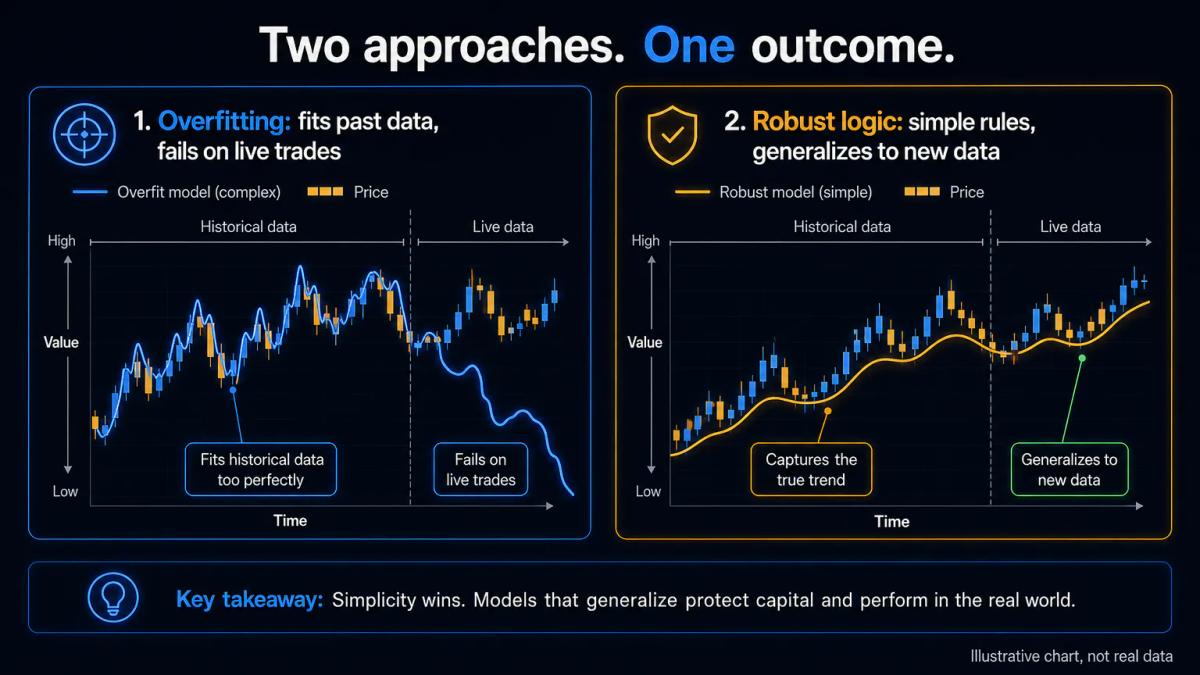
The most common mistake is overfitting: building an indicator that fits historical data perfectly and then fails on live trades because it was tuned too tightly to past prices. Guard against it by testing on data you did not use to design the indicator, and by keeping the logic simple enough to explain in two sentences.
A second pitfall is ignoring transaction costs. An indicator that shows a 2% profit factor on gross returns can slip into negative territory once spreads and commissions on 20 to 40 intraday trades per week are subtracted, so the cost per trade should be baked into the metric from the very first calculation.
A third pitfall is building something that still needs manual inputs or subjective judgement to interpret. A custom indicator should automate your edge rather than becoming an extra screen you have to read, and if the output is ever "maybe" then the logic is still incomplete. Complexity is a related trap: five moving averages, three oscillators and a proprietary composite score are harder to debug and rarely improve on one clean measurement, so it usually pays to start with a single metric, test it rigorously, and only add a second once the data actually justifies it.
To see these conditions applied by a regulated broker, read our FP Markets review.
Frequently Asked Questions
What are performance indicators and how do they help intraday traders?
Performance indicators are metrics that measure how a trading system behaves: win rate, profit factor, average trade result, time-of-day performance. Intraday traders use them to isolate where their edge actually works, so they can size positions correctly, skip poor sessions and refine entry rules based on evidence rather than memory of the last few trades.
Can I build a custom indicator without coding experience?
Yes. TradingView's Pine Script is the gentlest entry point: the syntax is compact, examples are abundant, and the code runs in the browser without compilation. Some platforms also offer visual strategy builders that let you drag conditions together. Expect to spend a few weekends learning the basics before your first useful indicator, not months.
How long does it take to build and test a reliable custom indicator?
For a simple metric like a session-filtered win rate, a first working version takes a few hours of coding. Proper testing takes longer: backtesting across a few months of data, then two to four weeks of forward-testing on a demo account. If you skip the forward test, you will discover the flaws with real money instead.
What is the difference between a custom indicator and a trading strategy?
An indicator measures or displays something on the chart. A strategy uses those measurements to place trades, manage risk and exit. On MT4 and MT5 the strategy lives inside an Expert Advisor that reads indicator values and sends orders. On TradingView, a Pine Script tagged as a strategy runs a full backtest with entries and exits, while one tagged as an indicator only plots.
Do all brokers support custom indicators on their platforms?
Most retail brokers that offer MT4, MT5 or cTrader let you load your own indicators and Expert Advisors directly. TradingView is supported through broker integrations that vary by firm. Web-based proprietary platforms often restrict custom code. Confirm platform availability and any coding restrictions with the broker's support before committing to a workflow.
About the authors


Put this into practice
Related articles

Bull Flag vs Bear Flag: How to Spot and Trade Continuation Patterns
A practical guide to bull flags and bear flags: how to identify each pattern, confirm breakouts with volume, size positions and avoid common failure traps.

Bullish Candlestick Patterns: A Trader's Reference to Reversal Signals
The hammer, bullish engulfing, morning star and piercing line explained: how they form, how to trade them, and how to filter out false signals.

Buy Side and Sell Side Liquidity: How to Read and Trade It
A beginner-friendly guide to buy side and sell side liquidity: where the pools sit, how to spot sweeps, and how to size trades around them.
0 comments