



Technical Analysis · Beginner · 6 min read
What Is a Break of Structure in Trading? BOS Price Action Explained
The core mechanism: how price breaks market structure
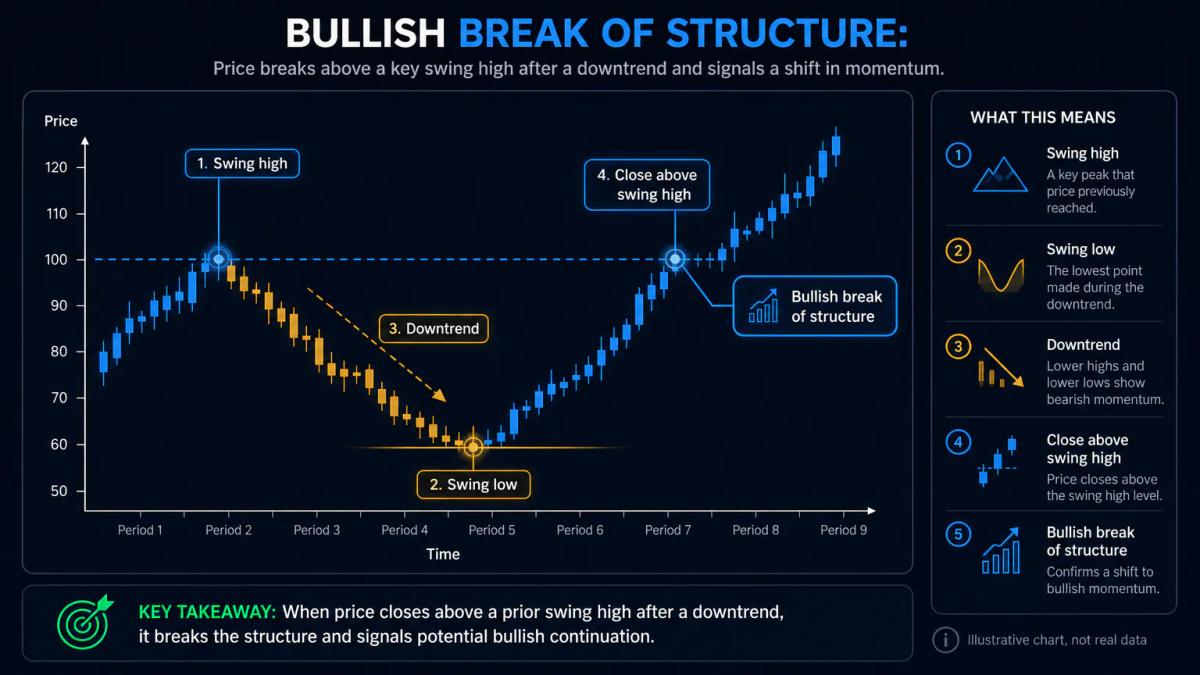
In price action, structure is the record of swing highs and swing lows that a market prints as it moves. A break of structure is the moment when a candle closes past one of those reference points, ending the previous sequence of higher highs and higher lows (or its bearish mirror) and opening the door to a new directional bias. Swing highs sit at the peaks that appear before price turns lower, and swing lows sit at the troughs that appear before price turns higher, so the level that gets broken is always a pivot the market has already respected at least once.
Reading a BOS is a description of what has already happened rather than a forecast of what will happen next. The concept sits inside Smart Money Concepts (SMC), a price-action framework focused on how liquidity and order flow shape market swings.
If you still need a broker, our guide to the best forex brokers compares the regulated options side by side.
Identifying bullish and bearish breaks
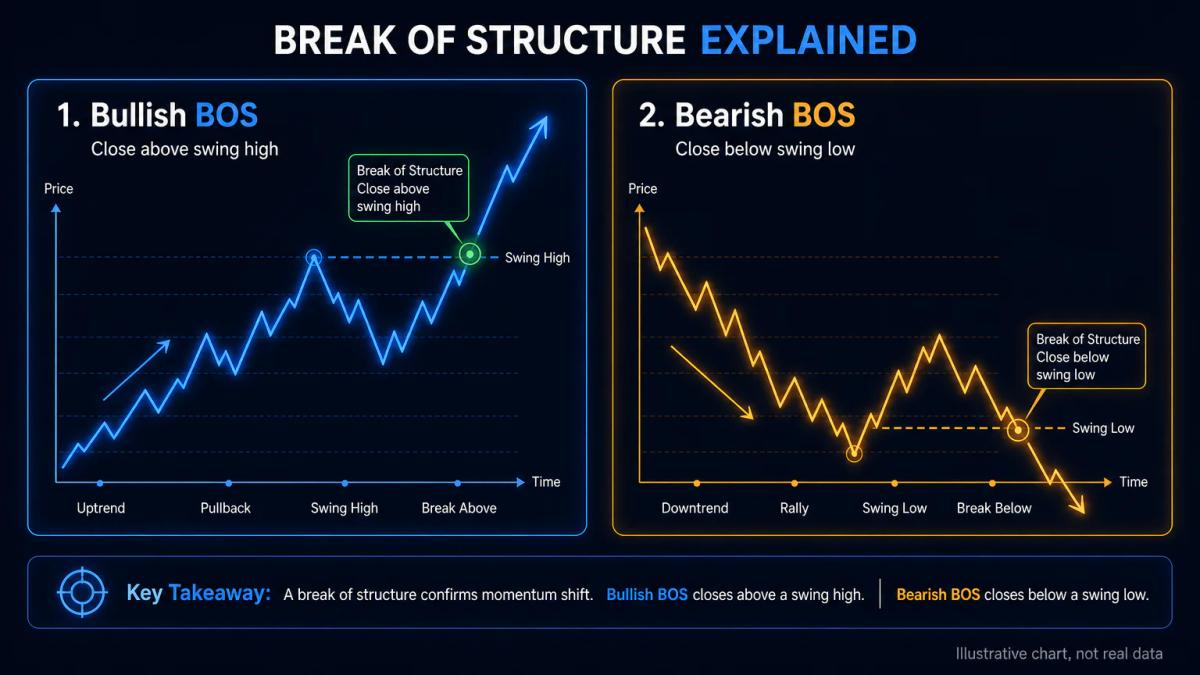
A bullish break of structure occurs when price closes above a prior swing high after a downtrend or a pullback, while a bearish break of structure occurs when price closes below a prior swing low after an uptrend or a rally. Confirmation hinges on the closing price of the candle: an intrabar wick that pierces the level and then retraces leaves the candle body inside the prior range, which fails the test for a valid BOS.
To mark the levels, scan left on the chart and identify the most recent significant swing high and swing low that define the current leg, then draw a horizontal line at each one. Confirmation only arrives once a full candle closes past the line on the timeframe you are trading, so patience during the wait is part of the method rather than an optional extra.
| Type | Prior context | Trigger | What it suggests |
|---|---|---|---|
| Bullish BOS | Downtrend or pullback | Close above prior swing high | Upside bias forming |
| Bearish BOS | Uptrend or rally | Close below prior swing low | Downside bias forming |
| Failed BOS | Either | Wick only, no body close | No confirmation |
Why BOS works as a trend confirmation tool
Break of structure works as a directional filter that ranks setups according to the side of the market currently in control. Trades aligned with the prevailing structure get priority in the plan, while trades against it are set aside until the read changes. Many BOS-based approaches lean heavily on this filtering step, so long positions are dropped once structure turns bearish and short positions are dropped once structure turns bullish.
A confirmed BOS also produces a defined invalidation level. If price closes back through the swing point that originally produced the break, the bias reading has failed and the position is flattened or the trader steps aside. Because the level that confirms the read is the same level that invalidates it, position sizing gets a clean stop reference to build around, which is one of the reasons BOS is popular with risk-focused traders.
Strong versus weak swing points in structure analysis
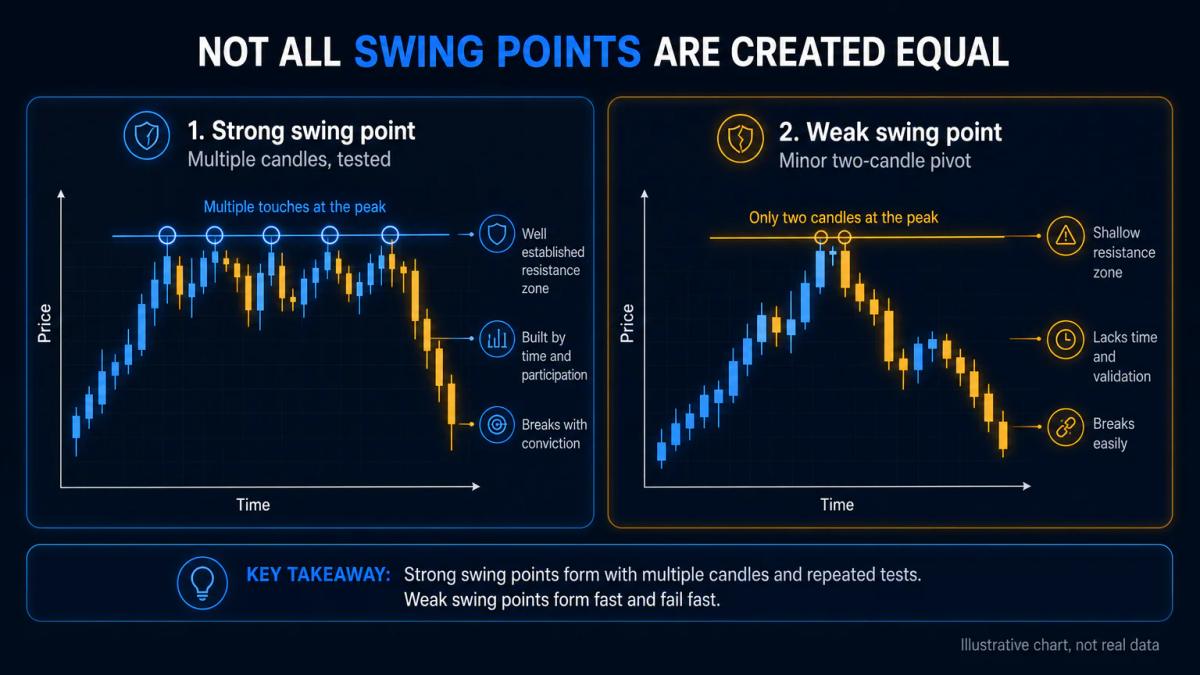
Swing points carry different weights depending on how they formed. A strong swing point developed over several candles, has been tested more than once, or sits on a higher-timeframe pivot, while a weak swing point is a minor pivot inside a larger move, often a quick two- or three-candle pattern that struggles under real pressure. When a strong swing point breaks, the read of the market genuinely changes; when a weak one breaks, the signal sits closer to noise and deserves less trust.
Before trusting a BOS, run a short checklist on the level being broken so weak pivots do not slip through unchallenged.
- How long did the level take to form?
- How many times has price reacted to it?
- Is it visible on a higher timeframe?
If the level fails all three tests, treat the break as provisional and demand extra confirmation before acting on it. Beginners who skip this test tend to collect false signals during fast, choppy sessions.
Combining BOS with Change of Character and multi-timeframe analysis
Change of Character (ChoCH) tends to trip up beginners more than any other piece of the BOS vocabulary. ChoCH describes the first shift in the size and speed of price moves that hints a trend is losing energy, such as a lower low forming inside an uptrend, or a higher high forming inside a downtrend, without the deeper structure having broken yet. ChoCH functions as an early warning that something is changing, while BOS provides confirmation that the change has taken place.
A clean sequence usually reads as ChoCH first, then BOS in the same direction, followed by continuation of the new move. Adding multi-timeframe alignment on top strengthens the read further. For example, if the four-hour chart prints a bullish BOS and the fifteen-minute chart also prints a bullish BOS after a pullback, the two timeframes agree and the setup carries more weight. When timeframes disagree, the lower one is usually noise inside the higher one, and the higher timeframe takes priority.
Common mistakes traders make with BOS setups
Several errors show up repeatedly when traders start using BOS in live markets, and each one is worth naming explicitly.
- Entering on the wick. A candle that pokes past the swing point and then closes back inside is not a valid break, and trading it produces the classic stop-out just before the real move begins, so waiting for the close on your working timeframe is essential.
- Trusting weak swing points, especially those formed inside a tight range. If a setup around one of them is unavoidable, size down to reflect the lower reliability of the level.
- Timeframe blindness, such as taking a five-minute BOS whilst the daily chart is trending firmly in the other direction.
- Treating BOS as an entry signal in its own right when it functions as a bias filter.
The link that follows covers the point about entries in more depth, since the actual entry usually comes from a retest of the broken level, a fair-value gap, or a lower-timeframe pattern that respects the new direction.
BOS in ranging markets versus trending markets
BOS is at its most reliable inside a market that is already trending. Every fresh break in the direction of the trend confirms continuation and gives a clean invalidation at the broken level. In a range, the same signal turns hostile: price prints repeated small BOS events at the edges of the range, each one reversing within a few candles, producing whipsaws that eat account balance.
The defence is to classify the environment before acting on any break. A rough classification checklist covers two questions worth answering before pulling the trigger.
- Is price making progressively higher highs and higher lows (or their bearish mirror)?
- Does the higher timeframe show a clear directional slope?
When the answers point to a trending environment, BOS can be traded as continuation. When price is instead oscillating between two horizontal levels on the higher timeframe, every BOS inside that box should be treated as suspect until price closes cleanly beyond the range itself. For instance, during a sideways session on a major FX pair, mean-reversion trades at the range edges tend to pay better than structure breaks taken in the middle of the box.
For a concrete example of costs and platform, the Axi review goes through them line by line.
Frequently Asked Questions
What is the difference between a break of structure and a simple support or resistance break?
A support or resistance break refers to price crossing a single horizontal level. A break of structure refers to price breaking a swing point that is part of a sequence, meaning the pattern of highs and lows that defined the trend has changed. Every BOS is a level break, but not every level break is a BOS, because many levels sit inside a range and their break does not alter trend structure.
Can you use break of structure as a standalone entry signal, or do you need other confirmation?
BOS on its own is not an entry. It defines directional bias and the invalidation point. Most traders wait for a retest of the broken level, a lower-timeframe pattern in the new direction, or a fair-value gap fill before entering. Trading the break itself, at market, tends to produce entries at extended prices with wide stops.
How do you apply break of structure across multiple timeframes in forex or stock trading?
Start with the higher timeframe (daily or four-hour) to establish structural bias. Drop to an intermediate chart (one-hour or fifteen-minute) to locate the swing points being tested. Use the lowest timeframe (five- or one-minute) for entry timing after the higher-timeframe BOS is confirmed. If the higher and lower timeframes disagree, the higher timeframe wins and the lower-timeframe signal is likely noise.
What makes a swing point strong enough to create a reliable break of structure signal?
Three properties: it took several candles to form (not a quick two- or three-candle pivot), price has reacted to it more than once, and it is visible on a higher timeframe. Swing points that pass all three tests are structurally significant, and their break is more likely to signal a genuine shift rather than a temporary spike.
About the authors


Put this into practice
Related articles
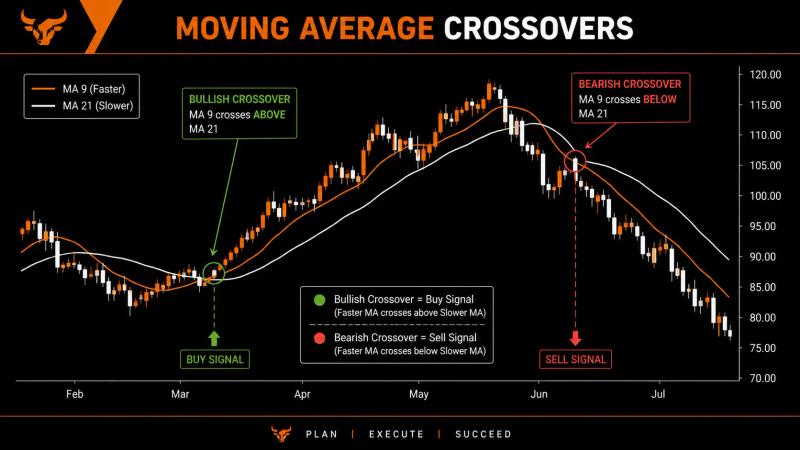
Moving Averages Explained: SMA, EMA, and How Traders Use Them
Moving average trading explained simply. Learn how SMA and EMA work, how to read crossovers, and how traders use them to spot trends and time entries.
Candlestick Patterns Explained: A Practical Visual Guide
Candlestick patterns explained for new traders: read doji, hammer, and engulfing signals with clear visual chart examples.

ATR indicator explained: measuring volatility and setting stops
A practical guide to the ATR indicator: calculation, stop loss placement, position sizing, limitations in ranging markets, and behaviour across asset classes.
0 comments