



Technical Analysis · Intermediate · 8 min read
W Candlestick Form Explained: From Recognition to Execution
The smallest reversal formation, explained
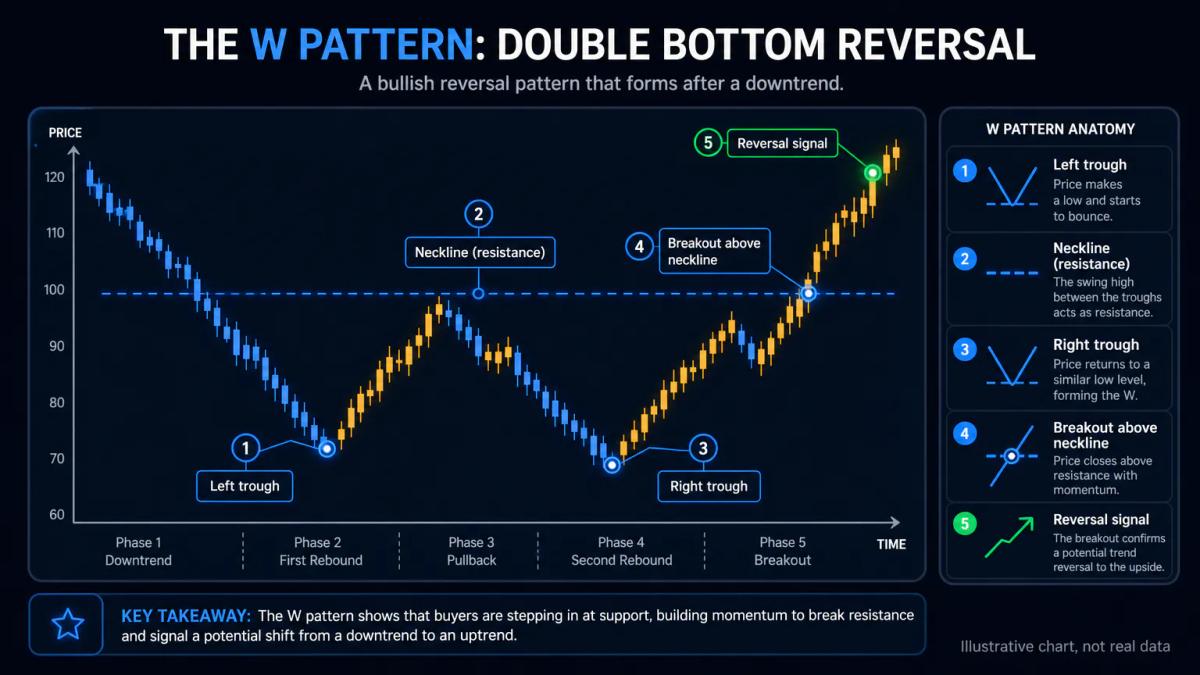
A W candlestick form is a technical reversal pattern that appears when price falls to a low, bounces, falls again to a similar level, then bounces once more, tracing two troughs that resemble the letter W on a chart.
The pattern flags a potential shift from downtrend to uptrend once price closes above the neckline, the horizontal resistance connecting the two peaks between the troughs. Retail traders use it to time entries before a sustained move higher.
The attraction of the pattern is its geometry: two clear lows, one obvious resistance line, one measurable target. That simplicity is also its risk. Because the shape is easy to draw after the fact, many traders force the pattern onto charts where sellers are still in control. Trading skills development and discipline are essential to avoid this trap.
The material below focuses on the parts most guides skim: validation rules, stop placement, target maths, failure modes, and the mental discipline the second trough demands.
Putting this into practice means opening an account: start with the best forex brokers our team reviewed.
How the W pattern forms and what each part does
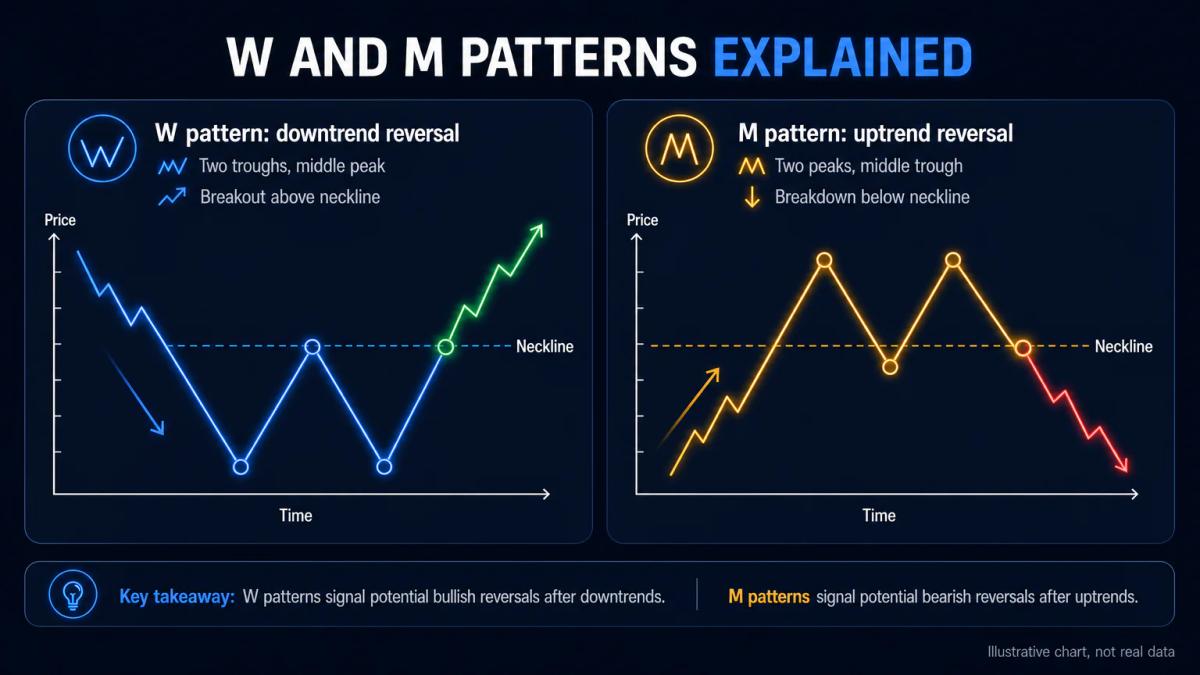
The W builds in four phases, and each phase carries information about who is winning the auction between buyers and sellers.
- Phase one is the left trough: price completes a downtrend and prints a swing low. Sellers exhaust themselves at this level, at least temporarily, and price bounces on short covering and opportunistic buying.
- Phase two is the pullback to the neckline. Price rallies to a resistance level, the neckline, then rolls over. This bounce is not the reversal; it is the market testing whether sellers still have conviction. A shallow, weak bounce that fails well below prior structure is a warning sign.
- Phase three is the right trough. Price falls back toward the first low. If sellers were still in control, price would break the first low with force. In a valid W, the second trough stalls at or near the first, and buyers step in with visible urgency. Slightly higher or slightly lower is acceptable; a decisive break lower is not.
- Phase four is the neckline break. Price rallies from the second trough and closes above the neckline, ideally on rising volume. That close is the market confirming that buyers have taken control of the range. Until that close prints, you have a hypothesis, not a signal. Traders who anticipate the break before the close often get stopped out during the noisy second-trough retest.
Reading the W pattern: what makes it valid
A valid W pattern requires three conditions: two troughs at roughly equal price levels, a clean neckline connecting the peak between them, and confirming volume on the final bounce through that neckline.
The troughs should sit within a tight band, commonly within 2% to 5% of each other on daily charts. A second trough materially below the first suggests continued distribution, not accumulation. A second trough materially above the first can still work, but it starts to blend into an ascending-base pattern and the classical target maths becomes less reliable.
The neckline must be identifiable without stretching. If you find yourself drawing three or four candidate lines, the level is not real resistance and the pattern loses meaning. The cleanest necklines are those that also line up with prior structure: a former support that flipped to resistance, a round number, or a moving average crossover that price has respected.
In a genuine reversal, volume typically contracts into the second trough and expands on the neckline break. A break on thin volume is the single most common precursor to a failed W.
Entry, stop loss, and profit targets
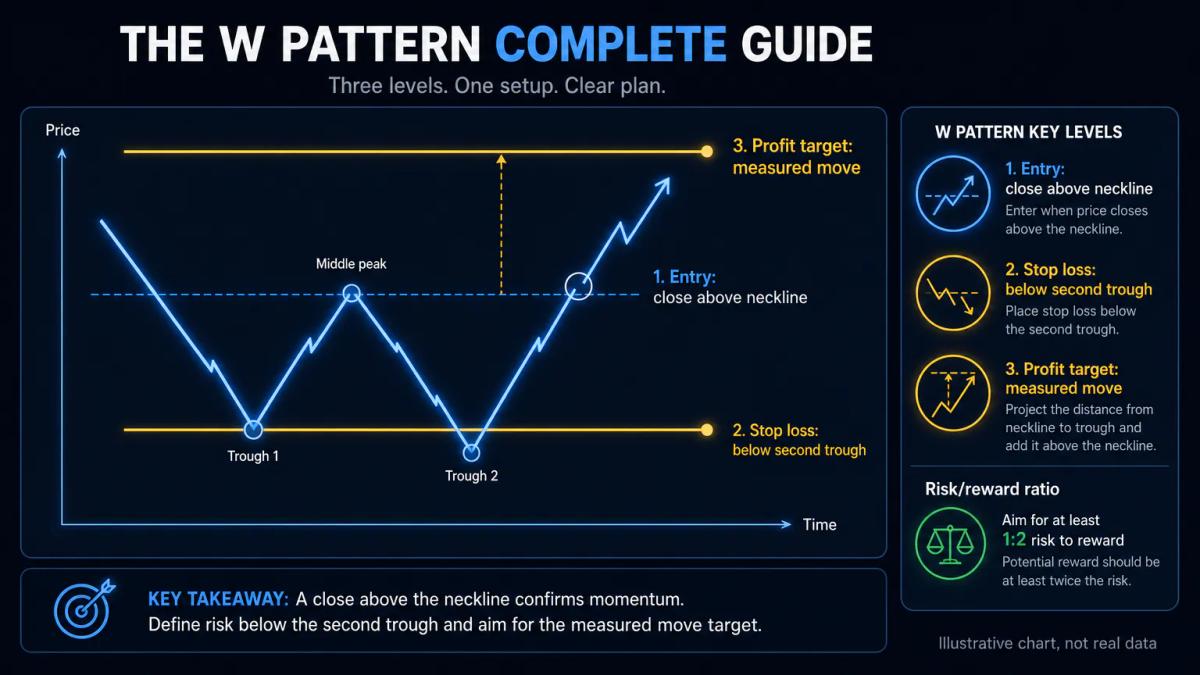
Entry is taken when price closes above the neckline, ideally on a candle that shows expanding range and rising volume. A close is the filter that removes most of the noise. Traders who prefer confirmation over price wait for a retest of the broken neckline as new support; this reduces false entries but sacrifices some of the initial move.
Stop loss sits just below the second trough, with a small buffer for spread and normal wick behaviour. Placing the stop at the exact low invites getting picked off by routine liquidity sweeps. If the second trough is at 1.0820 on EUR/USD, a stop at roughly 1.0805 to 1.0810 respects the pattern while allowing normal noise.
Profit target is calculated by measuring the vertical distance from the deepest trough to the neckline, then projecting that same distance above the neckline. If the neckline sits at $50 and the deepest trough at $44, the measured move projects to $56. This is the pattern's built-in target: a disciplined exit level.
Position size follows from stop distance, not from conviction. A retail trader risking 1% of a $10,000 account on a stop 2% away from entry sizes the position so that the 2% adverse move equals $100. That arithmetic is fixed before the trade opens, not adjusted mid-position.
W patterns versus M patterns and false signals
The M pattern is the W's inverse: two peaks instead of two troughs, forming after an uptrend and signalling a potential shift lower once price closes below the neckline that connects the trough between the peaks. The mechanics are mirrored, the psychology is mirrored, and the target maths is mirrored.
| Feature | W pattern | M pattern |
|---|---|---|
| Prior trend | Downtrend | Uptrend |
| Structure | Two troughs, one middle peak | Two peaks, one middle trough |
| Signal direction | Bullish reversal | Bearish reversal |
| Neckline role | Resistance to break | Support to break |
| Confirmation | Close above neckline | Close below neckline |
| Stop location | Below second trough | Above second peak |
| Target method | Height projected up from neckline | Height projected down from neckline |
False W signals share a small set of causes.
- The most frequent is a neckline break on declining volume: price pokes above the level, fails to attract follow-through buying, and rolls back into the range.
- The second is a second trough that is meaningfully lower than the first, which often precedes a continuation of the original downtrend.
- The third is a break that coincides with a higher-timeframe resistance, where the daily chart shows a W but the weekly chart still shows a clean downtrend.
Timeframe and asset class considerations
W patterns appear on every timeframe, but reliability scales with the chart.
- On daily and weekly charts, the pattern reflects genuine positioning by larger participants; the troughs align with visible support, and the neckline coincides with prior structure.
- On 1-minute and 5-minute charts, the same geometry appears constantly, but most of these micro-Ws are noise around the true trend.
Across asset classes, behaviour differs enough to matter. Forex vs stocks trading shows distinct characteristics: major forex pairs tend to produce clean Ws around session opens and around scheduled data, but breakouts often stall at the next liquidity pocket.
Stock indices such as the FTSE 100 or S&P 500 print reliable daily Ws around earnings clusters and central bank meetings. Individual equities produce the textbook version, especially at former support levels tied to earnings gaps.
Crypto markets show W patterns as well, but with two caveats. Volatility is higher, so stops need more room and position sizes have to be smaller to keep risk constant. The FCA has restricted the sale of crypto derivatives to UK retail clients, so UK traders access crypto Ws mainly through spot exchanges rather than CFDs.
Discipline and psychology when trading the W
The hardest part of trading the W is sitting through the second trough. Price is falling back toward the first low; every candle looks like the reversal was wrong; every headline sounds bearish. Traders who exit before the second trough completes convert what would have been a good trade into a small loss, then watch the neckline break without them.
The defence is procedural. Your entry rule (close above neckline), stop level (below second trough), and target (measured move) are decided before the pattern completes.
Once decided, they are not adjusted because a candle looks scary or a news headline appears. Volume at the neckline break is the objective filter: if it is present, you take the trade; if it is absent, you skip it, regardless of how attractive the shape looks.
Journaling each W setup, including the ones you skipped and why, turns a pattern into a repeatable process. Over a sample of trades, the edge, if there is one for your market and timeframe, becomes visible in the numbers rather than in the last trade you remember.
Frequently Asked Questions
What is the W pattern in trading and how does it differ from other reversal patterns?
The W pattern is a double-bottom reversal that forms after a downtrend, made of two troughs at similar prices and a middle peak that defines the neckline. It differs from a head-and-shoulders bottom, which has three troughs with a lower middle low, and from a rounded bottom, which lacks the clear neckline and defined troughs. The W is a specific two-touch structure with an explicit breakout trigger and a measurable target.
How do you confirm a W pattern is real and not a false signal?
Confirmation requires three checks: the two troughs sit at similar prices without a decisive break lower, the neckline is a clean level rather than a stretched line, and price closes above the neckline on rising volume. A break on declining volume, or a second trough materially below the first, is the classic false-signal profile.
What is the best stop loss placement for a W pattern trade?
Stop loss belongs just below the second trough, with a small buffer for spread and normal wick behaviour. Placing it exactly at the low invites liquidity sweeps. The stop distance, combined with your fixed risk per trade, sets the position size before the trade opens.
Can you trade W patterns on short timeframes like the 5-minute chart?
You can, but the pattern is far less reliable there. Most 5-minute Ws are noise around the prevailing higher-timeframe trend, and false breakouts are common because volume signals are noisier. Daily and weekly Ws align more closely with genuine positioning by larger participants and tend to produce cleaner outcomes.
How do you calculate profit targets using the W pattern height?
Measure the vertical distance from the deepest trough to the neckline. Add that distance to the neckline price, and the result is the measured-move target. If the neckline sits at $50 and the deepest trough at $44, the target projects to $56. It is a disciplined exit level, not a guarantee of price reaching it.
About the authors


Put this into practice
Related articles

What Is a Break of Structure in Trading? BOS Price Action Explained
A plain-English guide to break of structure: how to spot bullish and bearish BOS, tell it apart from Change of Character, and avoid the classic mistakes.
Moving Averages Explained: SMA, EMA, and How Traders Use Them
Moving average trading explained simply. Learn how SMA and EMA work, how to read crossovers, and how traders use them to spot trends and time entries.
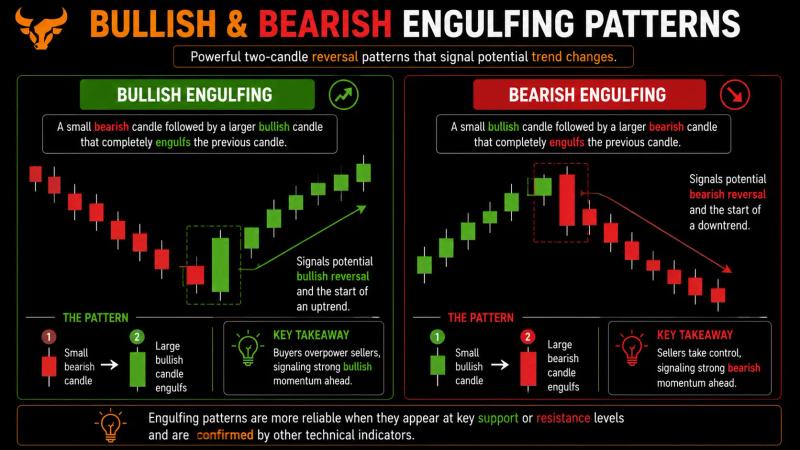
Candlestick Patterns Explained: A Practical Visual Guide
Candlestick patterns explained for new traders: read doji, hammer, and engulfing signals with clear visual chart examples.
0 comments