



CFD Trading · Intermediate · 6 min read
TradingView Hidden Features: Tools Worth Finding
What counts as a hidden feature on TradingView
Many of TradingView's most useful tools live one or two menu layers below the surface, quietly waiting for anyone curious enough to click through them. They ship with the platform on both free and paid tiers, which means unlocking them costs nothing beyond a little deliberate navigation. Once you know where to look, they can shave several minutes off every charting session and leave your workflow noticeably less cluttered.
They stay hidden because of a design tension between two audiences. TradingView wants newcomers to see a clean chart while also giving power users a full workshop to build in, so the second layer of controls sits one or two clicks below the surface. That second layer includes tools such as:
- the object tree
- the strategy tester
- the featureset toggles
- the webhook payload editor
The sections below walk through the tools that reward the click, starting with the shortcuts that pay back the fastest.
Putting this into practice means opening an account: start with the best forex brokers our team reviewed.
Keyboard shortcuts that speed up your charting
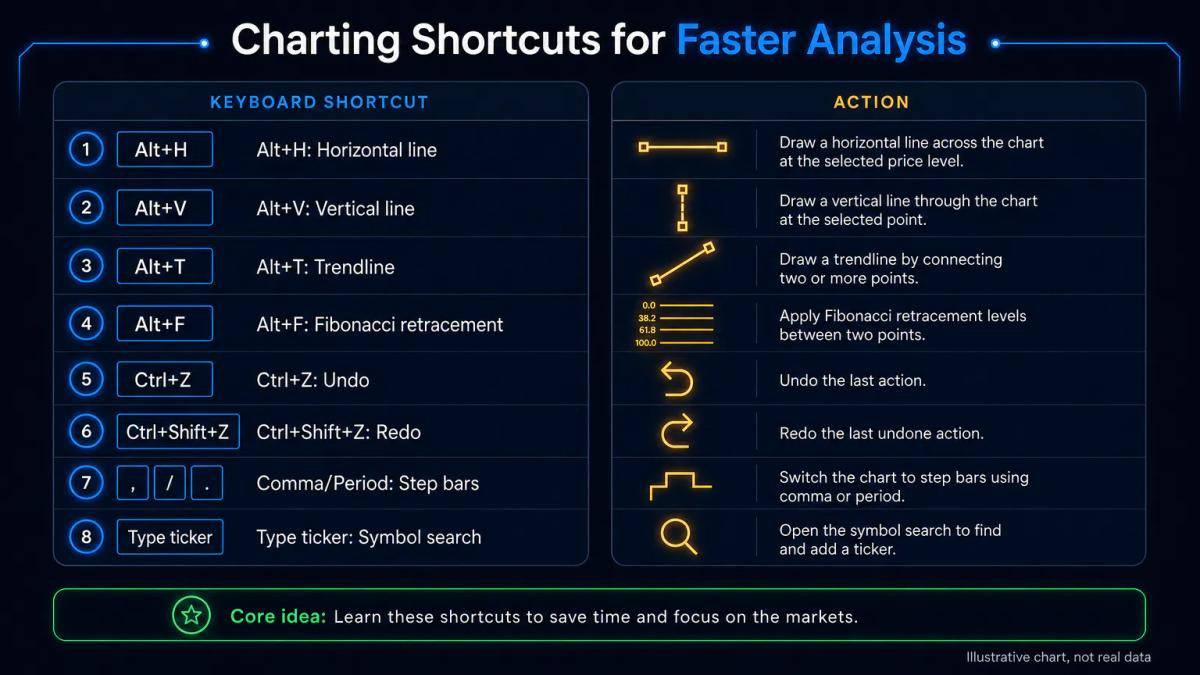
Keyboard shortcuts are the fastest single upgrade to your TradingView workflow. A handful of them cover most of what you draw or navigate every session:
- Alt+H draws a horizontal line at the cursor.
- Alt+V draws a vertical line.
- Alt+T draws a trendline.
- Alt+F draws a Fibonacci retracement, a tool that plots key percentage pullback levels between a swing high and low.
- Ctrl+Z undoes a drawing, and Ctrl+Shift+Z redoes it.
- The comma and full-stop keys step one bar back or forward on the replay bar.
A few more chart-level tricks are worth knowing:
- Typing a ticker symbol at any moment opens the symbol search without a click.
- The forward slash key opens the indicator dialog.
- Shift+click on a price axis draws a measurement rectangle that shows the pip distance, percentage move and bar count between two points, which becomes useful when you are sizing a stop loss (the price level where a losing trade is closed automatically) against recent volatility.
The full shortcut list lives inside the platform under the question-mark icon at the bottom right. If you print that list once and keep it near your keyboard, it will pay back the effort many times over compared with adding yet another indicator to your chart.
Advanced chart customization through featuresets
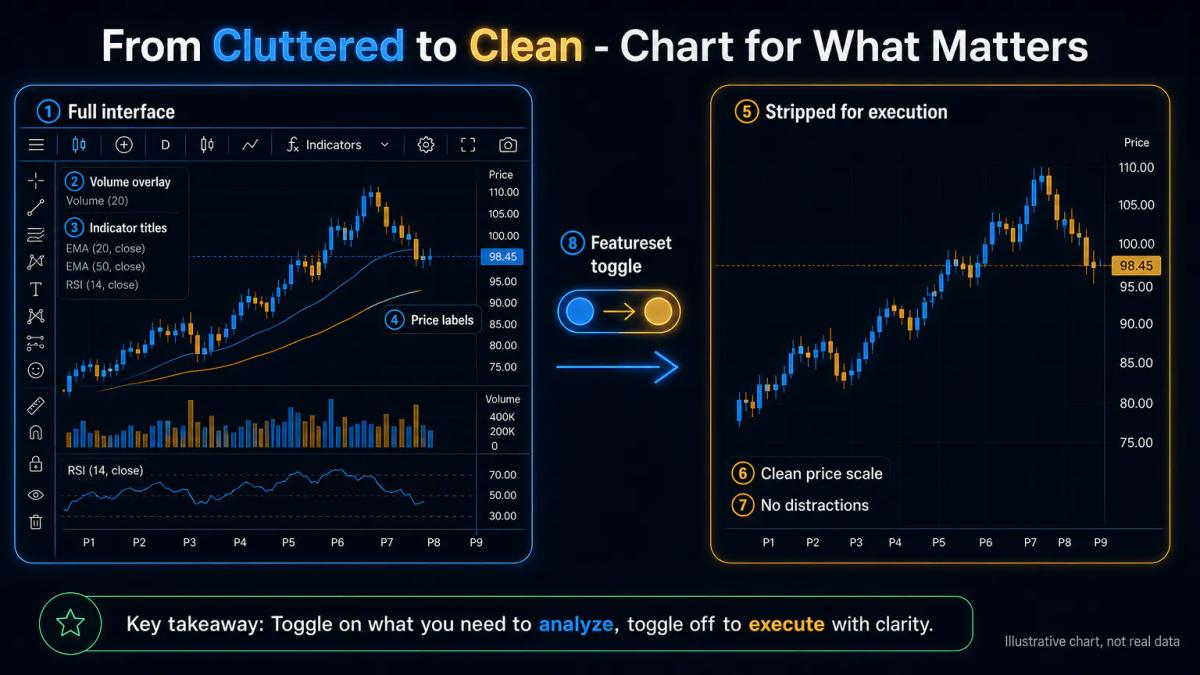
Featuresets are toggles that hide or show specific interface elements without touching your saved layout. Right-clicking the price scale, the time scale or an empty area of the chart opens context menus with options such as:
- Hide all indicator titles
- Hide last price label
- Scale price chart only
Each toggle survives across sessions and applies to the current chart template.
Two setups tend to emerge from featureset tweaking:
- A stripped chart for live execution, with no volume overlay, no watermark, no status line, and only price plus one or two indicators on screen.
- A dense chart for research and backtesting, with the data window pinned open through Ctrl+Alt+D, the object tree visible on the right, and multiple panes stacked below price for volume, oscillators and custom scripts.
Mobile app features that do not exist on desktop
The TradingView mobile app ships with its own gesture set, designed around touch from the ground up. A few interactions unlock most of its speed:
- A two-finger pinch scales price and time independently.
- A long press on a candle opens a bar replay for that specific bar.
- A swipe from the right edge reveals the watchlist without leaving the chart.
- Push notifications from server-side alerts fire even when the app is closed, which the browser version cannot replicate.
The app also handles alert acknowledgement differently, since tapping a notification opens the exact chart, timeframe and drawing that triggered it. Many traders who need to monitor positions while away from a desk keep alerts on mobile and analysis on desktop, using the two together without duplicating work.
One caveat is worth flagging. Pine Script editing and the full strategy tester remain desktop-only, so the mobile app works best as a monitoring and reaction surface while strategy building stays on the larger screen.
Community scripts and open-source indicators
The Public Library holds tens of thousands of Pine Script indicators and strategies written by other users, and most are open source. To surface the scripts that have been read, forked and improved by the largest number of traders, which is a rough proxy for reliability, follow these steps:
- Click the Indicators button on the chart toolbar.
- Switch to the Community Scripts tab.
- Filter by open-source and sort by most liked.
Opening a script's page shows the full source code, which you can then use in several ways:
- Copy it into the Pine Editor.
- Adjust the inputs to your own preferences.
- Add an alert condition on top of it.
- Combine it with another script into a single indicator.
This is where the platform quietly outperforms closed charting suites. Consider an unusual instrument such as the VIX term structure ratio, or a niche pattern such as a volume-weighted Heikin Ashi (a candle type that smooths price using averages of open, high, low and close): both almost always exist as a community script long before they exist as a built-in study.
Reading the code before trading a signal is a habit worth keeping. Picture this: a three-line moving-average crossover dressed up with a colourful plot is still just a three-line moving-average crossover once you strip the styling away.
Backtesting and strategy automation workflows
The Strategy Tester panel stays hidden at the bottom of the chart until you load a Pine Script strategy. Once open, it runs your rules against historical bars and reports several performance figures:
- Net profit
- Maximum drawdown, the fall from an equity peak to the trough before a new peak
- Win rate
- Profit factor
- A full trade list
Changing an input reruns the test in seconds, which lets you sweep parameter ranges before committing capital.
Once a strategy behaves acceptably in backtest, alerts can turn it into a live signal. Any strategy condition, and any indicator plot, can be wrapped in an alertcondition() call and delivered as a webhook: a small JSON payload posted to a URL you choose. That URL can then point at:
- A broker that exposes an order API.
- An intermediary service that translates the payload into an order ticket for MT4, MT5 or a crypto exchange.
Automation is only as good as the strategy behind it, and several factors can quietly erode a backtest's edge once real money is on the line: slippage, commissions, spread widening around news, and the reality that historical results give no guarantee about future performance. Paper trading the webhook chain for several weeks before going live is standard practice for that reason.
Performance optimization for large datasets
Charts slow down when you stack too many studies, load too many bars, or run heavy Pine Script on low timeframes. A useful first step is to remove indicators you are no longer reading, because each open study consumes memory. Imagine a chart carrying fifteen overlays on a one-minute view: it will lag on any machine, no matter how much RAM you throw at it.
Beyond pruning indicators, a few more steps keep large-data charts responsive:
- Lower the bar count in the chart settings, since keeping five years of one-minute data in memory is rarely justified.
- Prefer built-in indicators over community scripts for standard tools, because native code runs faster than interpreted Pine.
- If a script uses security() calls across multiple timeframes, expect a further slowdown, and consider replacing it with a lighter equivalent.
For a concrete example of costs and platform, the FP Markets review goes through them line by line.
Frequently Asked Questions
How do I access keyboard shortcuts on TradingView?
Click the question-mark icon at the bottom-right of any chart to open the full shortcut reference. The most used shortcuts, Alt+H for a horizontal line, Alt+V for a vertical line, Alt+T for a trendline, Alt+F for a Fibonacci retracement, and Ctrl+Z to undo, work on both Windows and macOS with the corresponding modifier key.
Can I automate trades using TradingView alerts and webhooks?
Yes. Any alert on a paid plan can send a webhook, a JSON message posted to a URL, when it triggers. Point that URL at a broker that accepts API orders or at an intermediary that translates the payload into an order ticket for platforms like MT4 or MT5. Test the full chain on a demo account before routing live capital through it.
What is the difference between TradingView's free and paid plans in terms of hidden features?
The free plan gives you keyboard shortcuts, featuresets, community scripts and the Strategy Tester. Paid plans add more indicators per chart, more saved layouts, second-based intraday resolutions, server-side alerts that survive after you close the browser, and webhook alerts. If you rely on webhook automation, a paid tier is required.
How do I find and use community-created Pine Script indicators?
Open the Indicators dialog, switch to the Community Scripts tab, filter by 'open-source' and sort by likes. Click into a script to read its code, add it to your chart, and adjust the inputs. If you need a change, copy the code into the Pine Editor and modify it there before saving your own version.
Why is my TradingView chart running slowly with multiple indicators?
Charts slow down when many studies are active, when the loaded bar count is high, or when Pine scripts make repeated security() calls across timeframes. Remove indicators you no longer need, lower the bar count in chart settings, and prefer built-in studies for standard tools. Heavy multi-timeframe community scripts are the most common cause.
About the authors


Put this into practice
Related articles
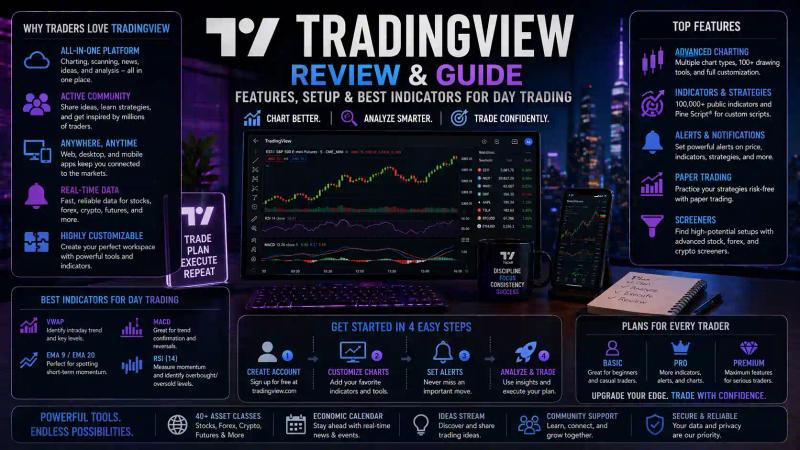
TradingView Review and Guide: Features, Setup & Best Indicators for Day Trading
Honest TradingView review and guide covering features, plan pricing, setup, and the best indicators for day trading. Practical guide for new and active traders.
What Are CFDs and How Do They Work?
Learn what CFDs are, how profit and loss works, the types you can trade, and the risks involved. A plain-language beginner's guide to Contracts for Difference.

Who Is Considered an Insider: Legal Definition and Trading Rules
A plain-English guide to who counts as an insider under US and UK securities law, what they must disclose, when they may trade, and the penalties for breaches.
0 comments