


Technical Analysis · Advanced · 9 min read
Fair value gap explained: how to spot and trade FVGs with discipline
The smallest price imbalance, and why it matters
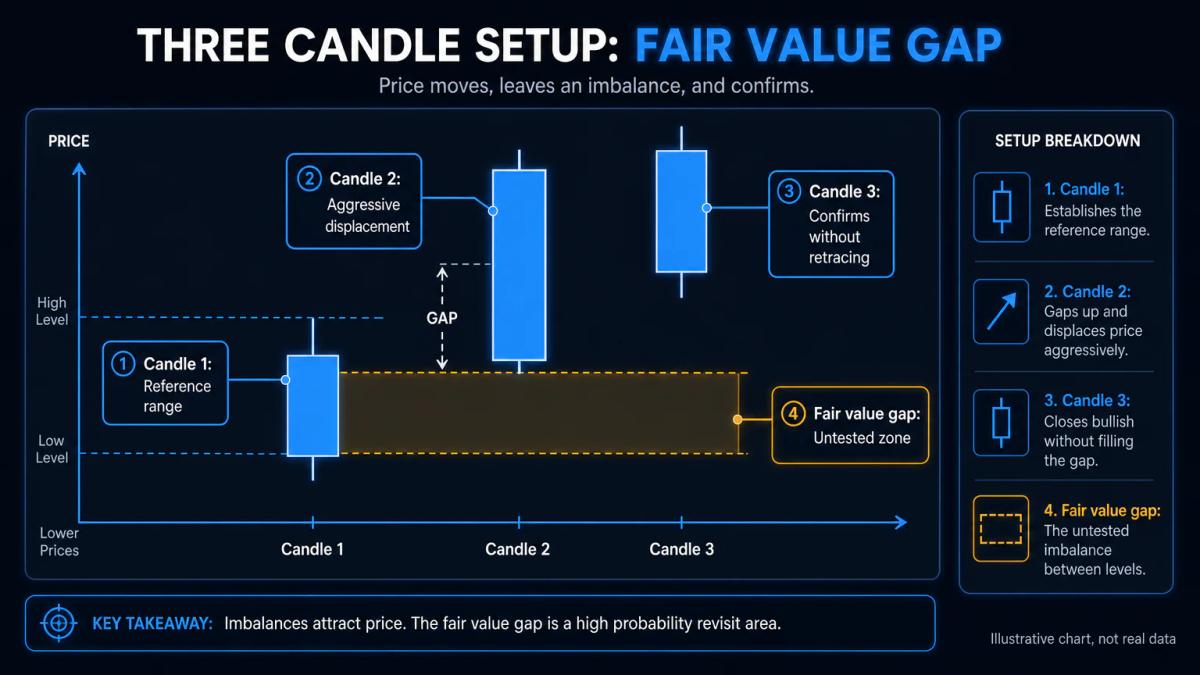
A fair value gap is a three-candle imbalance where the second candle's range extends so aggressively that the wicks of the first and third candles fail to overlap, leaving an untraded zone of price. Retail desks treat that zone as a magnet: it becomes a reference level for continuation entries, mean-reversion exits, or structural invalidation, because order flow tends to revisit prices that were skipped on the initial impulse.
The FVG appeals because it gives you a mechanical, repeatable zone drawn from three candles alone, with no indicator lag and no subjective trendline fitting. The trade-off is that an FVG in isolation tells you nothing about direction, context or whether the imbalance will be respected; the rest of this article covers the filters, sizing and timeframe choices that turn a visual pattern into a tradable edge.
If you still need a broker, our guide to the best forex brokers compares the regulated options side by side.
How the three-candle pattern forms
An FVG requires three consecutive candles. The first candle sets a reference range. The second candle extends with momentum so strongly that its body (and often most of its range) prints past the opposing wick of candle one. The third candle confirms by closing without retracing into the imbalance left by the second. The untouched space between the wick of candle one and the wick of candle three is the gap.
The practical identification rule is the wick test. For a bullish imbalance, the low of candle three must sit strictly above the high of candle one. For a bearish imbalance, the high of candle three must sit strictly below the low of candle one. If the wicks touch, there is no gap, there is a tight range.
Two nuances shift the count at the advanced level:
- Body versus wick definition: body-only FVGs (measured candle-close to candle-close) are stricter and tend to produce cleaner reactions, while full-range FVGs catch more setups but include noise from stop runs.
- Midpoint reactions: the midpoint of the gap (sometimes called the consequent encroachment) often reacts before the full fill, so you draw three levels:
Bullish and bearish FVG recognition
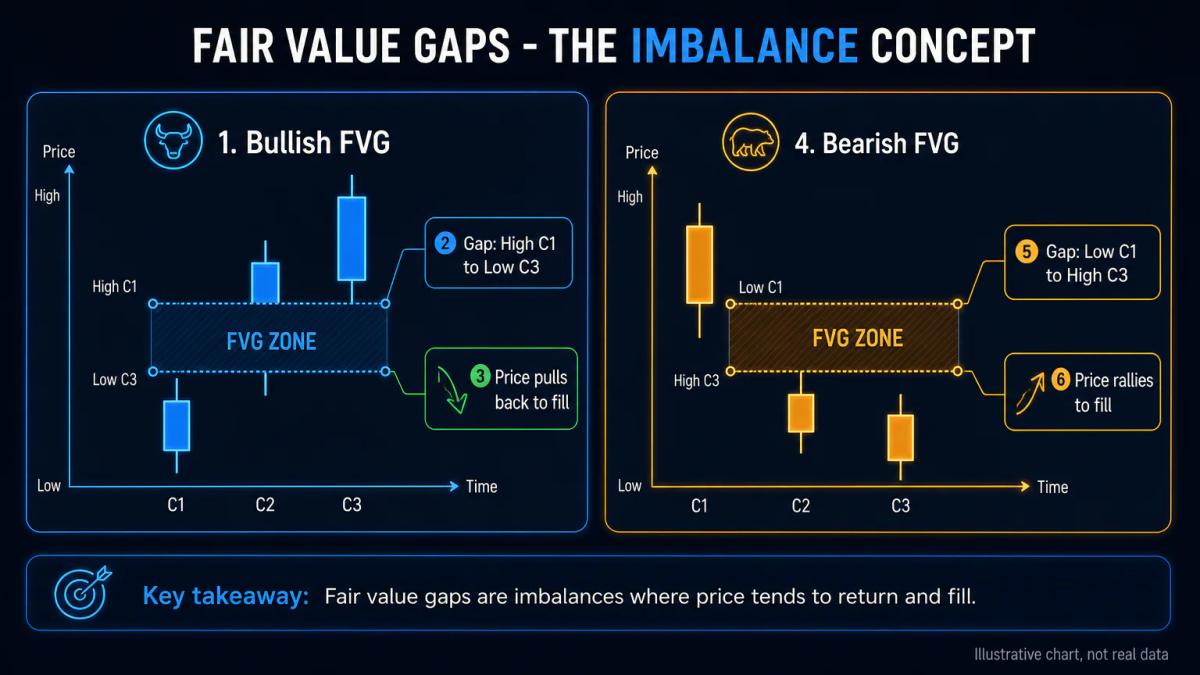
A bullish FVG forms during an upward displacement: the gap sits between the high of candle one and the low of candle three, and price has to pull back down to interact with it. A bearish FVG forms during a downward displacement: the gap sits between the low of candle one and the high of candle three, and price has to rally up to tag it.
Recognition is not just geometry, it is context. A valid bullish FVG printed after a break of structure to the upside, with the displacement candle closing near its high and on expanded range, has materially different follow-through than a bullish FVG printed inside a tight consolidation. The second one is a noise pattern dressed as a signal.
Two recognition filters sharpen the read:
- Displacement quality: the middle candle's range should visibly exceed the average true range of the prior session; small-body middle candles produce weak gaps that fail on the first retest.
- Structural alignment: a bullish FVG is only tradable long when the higher-timeframe trend and the local market structure (higher highs and higher lows) agree. A bullish FVG inside a dominant downtrend is a retracement level for shorts, not a long entry.
Why price returns to fill the gap
Price revisits FVGs because the imbalance encodes unfinished business in the order book. The displacement candle prints because resting liquidity on one side is swept quickly: stop orders, breakout orders and liquidation triggers all fire together, and the market jumps through a thin band of resting limit orders. Participants who missed that move, and makers who were run over, bring liquidity back to the untraded zone to rebalance inventory.
A second, more mechanical reason follows: volume-at-price distributions build around areas where trading actually occurred; the FVG is, by definition, a low-volume node. Low-volume nodes tend to be traversed quickly on the way out and attract probing on the way back, because neither side has a defended position there.
The advanced caveat is that fill does not mean reaction. A gap can be fully traded through without producing a tradable bounce if the context has changed between the formation and the retest:
- a news release
- a session change
- a shift in correlated assets
The fill rate as a geometric event is high on liquid instruments and higher timeframes; the fill rate with a usable reaction is substantially lower, which is why you do not trade every retest blind.
Using FVGs as entry and exit zones
FVGs are reference zones, not signals. The entry logic splits into two archetypes, and mixing them is where most execution errors come from.
Continuation entry: after a break of structure in your direction, you wait for price to retrace into the FVG left by the displacement candle, confirm with a lower-timeframe reaction (a shift in order flow, a reversal candle, a micro break of structure), and enter with the stop beyond the far edge of the gap. The gap is your entry zone, the prior swing is your target.
Exit or take-profit zone: if you are already in a position, an opposing FVG in the path of price is a logical partial-take level, because reactions there are frequent enough to justify locking in risk even if the full target is further.
The parameters you set before the trade:
| Parameter | Continuation entry | Mean-reversion fade |
|---|---|---|
| Where to enter | Midpoint or far edge of the FVG | On rejection wick out of the FVG |
| Where the stop goes | Beyond the opposite edge of the gap plus a buffer | Beyond the structural swing that created the gap |
| Primary target | Prior liquidity pool or swing high/low | Opposite side of the local range |
| Minimum reward-to-risk | 2R before fees | 1.5R before fees |
| Required confluence | Higher-timeframe trend alignment, displacement quality | Exhaustion signal, divergence, session timing |
Suppose you spotted a bullish FVG on EUR/USD between 1.0820 and 1.0840 after a daily break of structure. If you entered at the midpoint of 1.0830 with a stop at 1.0815 (15 pips of risk) and the prior swing high sat at 1.0890, your reward-to-risk would be roughly 4:1 before costs, which is the kind of asymmetry that justifies the setup.
Risk management and position sizing with FVGs
Position sizing for FVG trades follows the same arithmetic as any structural trade, with one specific rule: the stop goes beyond the gap, never inside it. A stop inside the imbalance gets hit on the completion of the fill, which is a geometric certainty if price interacts at all.
The sizing formula:
- Risk per trade = account equity × fixed percentage (typical advanced range: 0.25% to 1%).
- Stop distance = price distance from entry to the structural invalidation beyond the far edge of the FVG, including a buffer for spread and slippage.
- Position size = risk per trade ÷ (stop distance × value per pip or per point for the instrument).
Asset class drives how you size the trade:
- Major forex pairs under FCA retail leverage caps of 1:30: the stop distance drives sizing cleanly.
- Indices (1:20 retail cap): gap zones often sit wider because of overnight prints, and sizing contracts accordingly.
- Single-name equities (1:5 retail cap): FVGs form around earnings and corporate actions and should be sized smaller than the formula suggests to absorb event risk.
- Crypto: CFDs on crypto are prohibited for UK retail clients by the FCA, so FVG strategies on crypto are not available through FCA-authorised entities for retail accounts.
Monkeytrade's broker reviews flag which group entity onboards UK clients and under which licence, because the same brand often routes retail flow to an offshore entity with different leverage and protections.
Common FVG mistakes and how to avoid them
The recurring errors are predictable and nearly all involve ignoring context:
- Chasing a late retest: entering after price has already traded through the midpoint eliminates the asymmetry; the invalidation stop is now too close relative to the remaining target.
- Trading every FVG regardless of trend: a bullish FVG printed against a dominant higher-timeframe downtrend is a sell zone for the trend, not a buy signal.
- Operating on illiquid timeframes: 1-minute and sub-minute FVGs during low-volume sessions fill chaotically because spread, latency and single large orders dominate.
- Ignoring the news calendar: a gap formed on a scheduled release has a different structural meaning than one formed in a continuous auction; the retest can be instant and brutal.
- Stacking FVGs without confluence: three overlapping FVGs on three timeframes without a supporting level (prior high or low, session open, volume node, moving average) is still only one piece of evidence.
The filter that removes most of these mistakes is cheap: before entering, write down the higher-timeframe trend, the nearest structural level above and below, and the next scheduled high-impact release. If any of the three disqualifies the trade, skip it.
Timeframe selection and FVG reliability
FVG behaviour is timeframe-dependent in a way that cannot be averaged away. Higher-timeframe gaps (4-hour, daily, weekly) represent larger displacements, attract flow from desks that operate on those horizons, and tend to produce reactions worth trading. Lower-timeframe gaps (1-minute, 5-minute) are frequent but noisy; they fill often as geometry and rarely as a tradable reaction.
A workable advanced routine:
- Context timeframe (daily or 4-hour): identify the dominant trend and the FVG zones that align with it. These are the pools you want price to deliver into.
- Setup timeframe (1-hour or 15-minute): wait for price to approach the higher-timeframe FVG and confirm structural intent (break of structure, change of character).
- Entry timeframe (5-minute or 1-minute): refine the entry with a lower-timeframe reaction inside the higher-timeframe gap, placing the stop beyond the higher-timeframe boundary, not the lower-timeframe one.
Volatility regime overlays this, so in high-volatility conditions, gaps print more often and are wider, which means you tighten the displacement filter and demand stronger confluence. In low-volatility consolidation, FVGs cluster and overlap; prioritise those sitting at range extremes, discard the ones inside the range. The instrument also changes how you filter setups:
- Indices and major forex pairs: produce the most reliable FVGs.
- Commodities: add session-driven noise.
- Single-name equities: need an earnings and corporate-action filter before any FVG is considered.
To see these conditions applied by a regulated broker, read our BlackBull Markets review.
Frequently Asked Questions
What is the difference between a fair value gap and a regular price gap?
A regular price gap is a discontinuity between one session's close and the next session's open, visible as empty space between two candles on daily or weekly charts. A fair value gap is an intrabar imbalance across three consecutive candles whose wicks fail to overlap, and it can appear on any timeframe during continuous trading, not only at session boundaries.
How long does it typically take for price to fill a fair value gap?
Fill time varies with timeframe and volatility. Lower-timeframe gaps often fill within the same session; higher-timeframe gaps can take days or weeks. There is no fixed interval, and some gaps are never filled when the market regime shifts before price returns. Treating fill time as a target rather than a deadline avoids forced entries.
Can you trade fair value gaps on all currency pairs and timeframes?
You can identify FVGs on any instrument and any timeframe, but reliability drops on illiquid pairs, exotic crosses and sub-minute charts. Major forex pairs, large-cap indices and liquid commodity futures produce the cleanest FVG reactions. On single-name equities, filter out gaps formed around earnings or corporate actions, which behave as event-driven jumps rather than structural imbalances.
What is the connection between fair value gaps and ICT methodology?
The FVG concept was popularised through the Inner Circle Trader framework, which groups it with imbalances, breakers and order blocks under a liquidity-based reading of price. The pattern itself is independent of any single author: it is a geometric description of a three-candle displacement, and it works alongside volume profile, market structure and session analysis without requiring the full ICT taxonomy.
How do you confirm an FVG before entering a trade?
Confirmation combines three checks. First, the displacement candle must have expanded range relative to the recent average true range. Second, the higher-timeframe trend and the local market structure must support the direction. Third, on the retest, a lower-timeframe reaction such as a reversal candle, a micro break of structure or an order-flow shift signals that participants are defending the zone before you commit size.
About the authors


Put this into practice
Brokers we have reviewed
Scored on the same five dimensions. Here are three of them — the full list is on the brokers page.



Related articles

Fibonacci Retracement Explained: Levels, Setup, and Trading Rules
A working guide to Fibonacci retracement: how to draw it, which levels matter, and how to combine it with risk rules and other indicators without over-relying on the tool.

Head and Shoulders Pattern Trading: Structure, Entry, and Risk Management
A structural guide to head and shoulders pattern trading: identification, neckline breakouts, false-break filters, inverted variant, and position sizing tied to pattern dimensions.

How to Identify Market Trends: A Practical Technical Analysis Guide
A structured guide to identifying uptrends, downtrends, and ranges using price action, indicators, and multi-timeframe analysis, with risk rules and reversal cues built in.
0 comments