



Technical Analysis · Advanced · 7 min read
Technical Analysis vs Quantitative Analysis: Key Differences and When to Use Each
The core difference: timing versus prediction
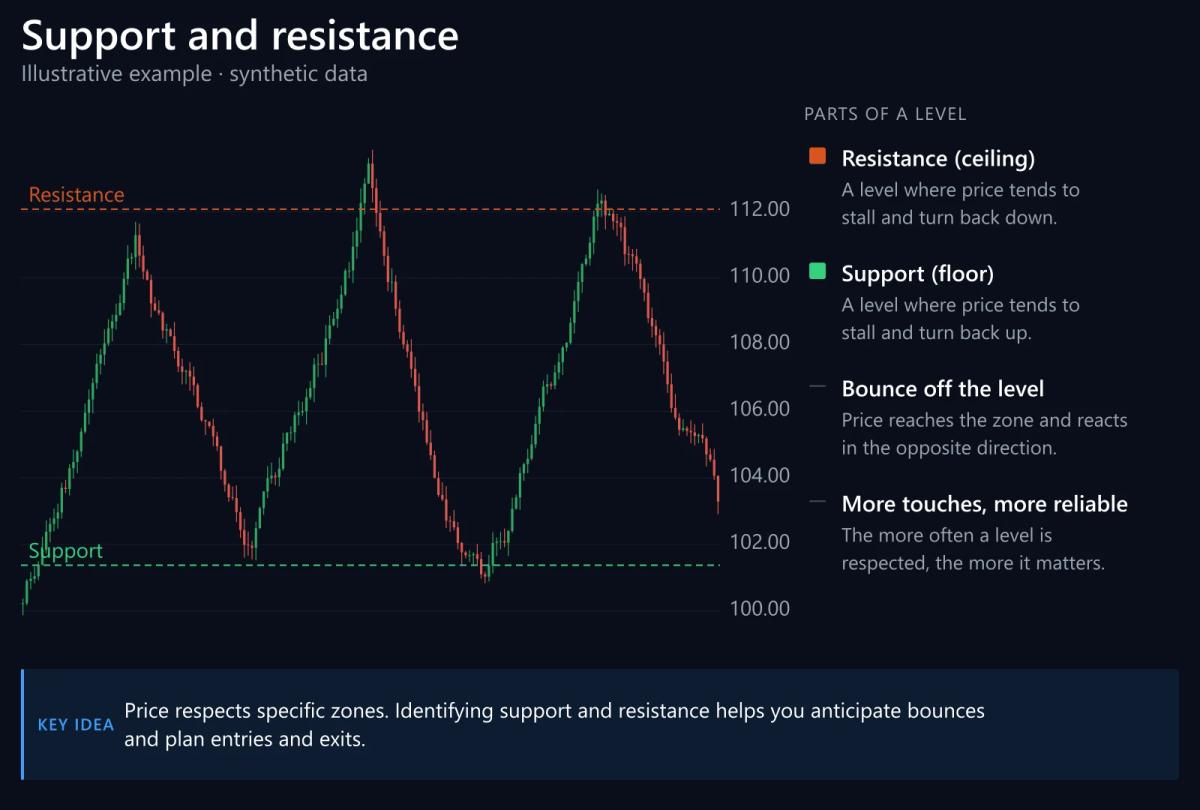
The comparison between technical analysis and quantitative analysis is fundamentally about intent rather than asset class. Chart-based technical work reads price action to time entries and exits, drawing on patterns, support and resistance, and momentum signals to decide when to act on a specific trade.
Quantitative work sits at a different altitude, building statistical models on historical price, volume and fundamental data to estimate returns, exploit mispricings and size risk across many trades at once. Each answers a different question about the market: one asks when to act on a single position, while the other asks how often an edge repeats and how much to allocate to it.
The practical consequence shows up in where your working hours go. A chart-based trader spends most of the day reading structure and managing open risk in live markets. A quant, by contrast, spends those same hours cleaning data, coding hypotheses and validating them on out-of-sample windows before any capital moves.
Failure modes also diverge in an important way: a technical setup breaks down one trade at a time, whereas a quantitative model tends to break down across an entire regime once conditions shift. Working out which failure mode you can absorb, operationally and psychologically, is more useful than debating which approach is intellectually superior. Both survive in professional books because each addresses a distinct question, with technical work answering when to act and quantitative work answering how often and how much.
If you still need a broker, our guide to the best forex brokers compares the regulated options side by side.
How technical analysis works in practice
Chart-based trading assumes price already discounts known information and that recurring behaviour gives you a probabilistic edge on timing. The patterns you rely on include:
- Breakouts from consolidation zones.
- Failed retests of prior levels.
- Momentum divergences between price and oscillators.
The mental model is that of a tape reader rather than a modeller: the drivers behind price stay outside the analysis, and only liquidity behaviour comes into play.
Consider a typical intraday setup on EUR/USD. Suppose price consolidates in a 15-pip range under the prior day high, breaks with a wide-range candle on rising volume, and then holds a retest of the range top. The playbook here would look like this:
- Entry on the retest of the range top.
- Stop below the range low, roughly 12 pips away.
- First target at the measured move, around 15 pips.
- Trail the runner beyond the initial target.
Everything about the read stays structural, with no earnings model or factor exposure sitting behind it, only observed liquidity behaviour on the tape.
Speed of decision and adaptability are what this style offers when conditions change quickly. Should the ECB deliver a surprise and send the pair running, a discretionary trader can flatten and reverse within seconds. Sample size and discipline pull in the other direction, since a pattern with a 55% win rate needs dozens of trades before the edge actually shows up in the equity curve, and many retail traders walk away from it after a losing cluster. Chart-based reads also degrade quietly when microstructure changes, whether that means:
- Wider spreads around session rollover.
- Thinner order books during the Asian hours.
None of these shifts will show up in a standard backtest, which is where discretionary reads tend to compound their drawdowns.
How quantitative analysis works in practice
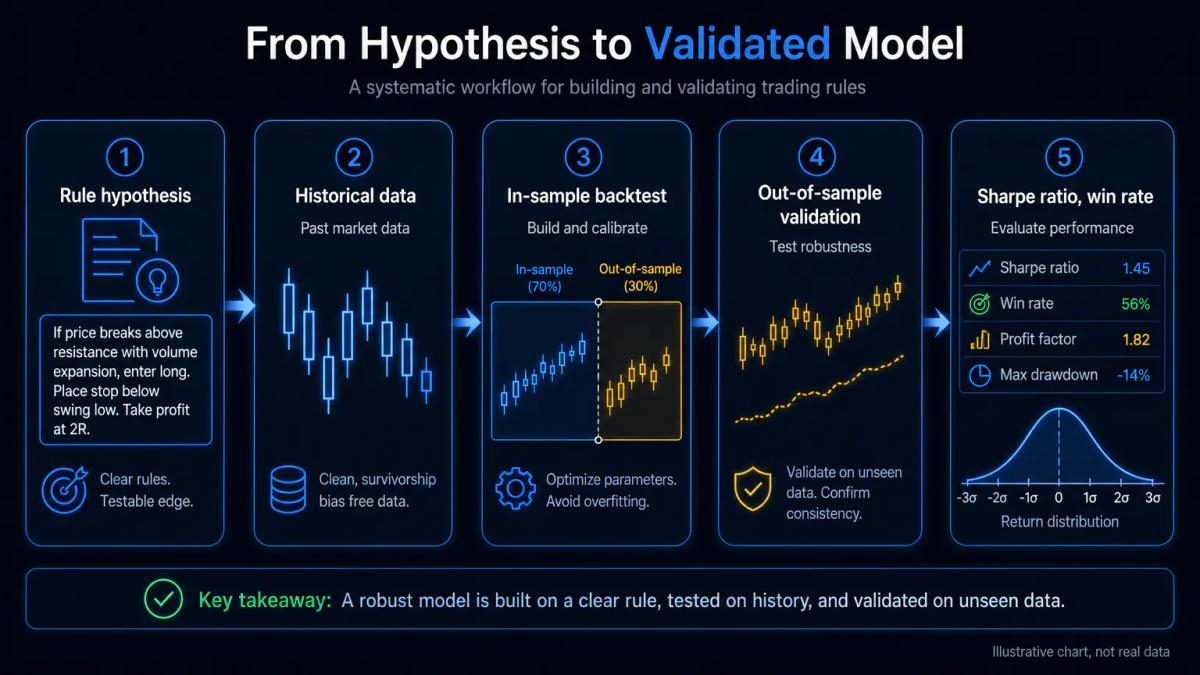
Imagine a quant workflow that begins with a hypothesis expressed as a rule set: buy the S&P 500 whenever the 20-day return is negative and realised volatility sits below the trailing 3-month median, hold five sessions, then exit. From that starting point, the workflow typically runs as follows:
- Pull twenty years of daily bars for the target instrument.
- Code the rule inside a backtesting framework.
- Run it on in-sample data and tune parameters sparingly.
- Validate on a held-out out-of-sample window before touching live capital.
The outputs of that process live as distributions rather than as single trades. The metrics you actually track include:
- The Sharpe ratio, defined as mean excess return divided by standard deviation.
- The maximum drawdown, from peak equity to trough.
- The win rate and the average trade in currency or R terms.
- How each of these behaves under walk-forward testing, where the model is refit on rolling windows.
A strategy that prints a Sharpe of 1.8 in-sample and collapses to 0.3 walk-forward is overfitted rather than tradable, and no amount of parameter polishing will rescue it.
The honest cost of this workflow is infrastructure, and it stacks up across several fronts:
- Data licensing fees for reliable feeds.
- Survivorship-bias-free equities history.
- Corporate actions applied cleanly.
- Point-in-time fundamentals rather than restated figures.
Retail quants usually substitute with adjusted Yahoo Finance or Stooq data and accept the extra noise as the cost of doing business. In essence, this is what quant trading analysis is: the process of turning a market intuition into a testable rule and letting the sample decide whether that intuition actually survives.
Tools and platforms: what each approach requires
The toolchain gap is wider than it looks and drives most of the learning curve.
| Layer | Technical setup | Quantitative setup |
|---|---|---|
| Charting | TradingView, MT4, MT5, cTrader | Matplotlib, Plotly (post-hoc) |
| Execution | Broker terminal, one-click trading | API (FIX, REST), IB TWS, MT5 Python bridge |
| Data | Live feed from broker | Adjusted OHLCV, tick data, fundamentals (Quandl, EOD, Polygon) |
| Backtesting | Strategy Tester in MT5, Pine Script replay | Backtrader, QuantConnect, vectorbt, zipline-reloaded |
| Language | Pine Script, MQL4/5 (optional) | Python, R, C++ for latency-sensitive |
| Cost floor | Free tier viable | £20 to £200 monthly for clean data |
MT5 sits between the two: MQL5 lets you code an EA (Expert Advisor, an automated strategy running inside the terminal) and run a genetic optimisation on the built-in tester, which is enough for simple rule-based systems on FX and CFDs. Python plus Backtrader or QuantConnect scales further because you can model portfolios, cross-asset signals and custom risk overlays that MT5 cannot express cleanly.
For UK retail clients trading with an FCA-authorised broker, note that CFDs on crypto are prohibited for retail, so any quantitative crypto model has to run on a spot venue outside the CFD wrapper.
Speed, emotion, and consistency: where each excels
The debate between data-driven and chart-based trading really turns on who executes better under stress, a rules engine or the human sitting in front of the screen. On the consistency side, systematic execution has a clear advantage in day-to-day operation. A model will not skip the ninth losing trade because the previous eight hurt, nor will it double down on the tenth after a win, and it can run 24/5 across dozens of symbols in a way that no human comfortably replicates.
On regime shifts and one-off events, discretionary technical reads keep an edge that is hard to systematise. When correlations break during a central bank surprise, or a stock gaps 20% on a takeover bid, a trained eye can reprice context in seconds, while a model trained on the prior regime keeps sizing positions as though nothing had changed until someone intervenes. The cleanest split in professional shops is to let the quant book run the base allocation and reserve discretionary capacity for tail events. Retail traders who try to do both at once often end up overriding their system after two losses, and that behaviour destroys the statistical edge that justified building the system in the first place.
Choosing a single execution mode per book of capital is usually the more sustainable arrangement.
Risk management and position sizing in each framework
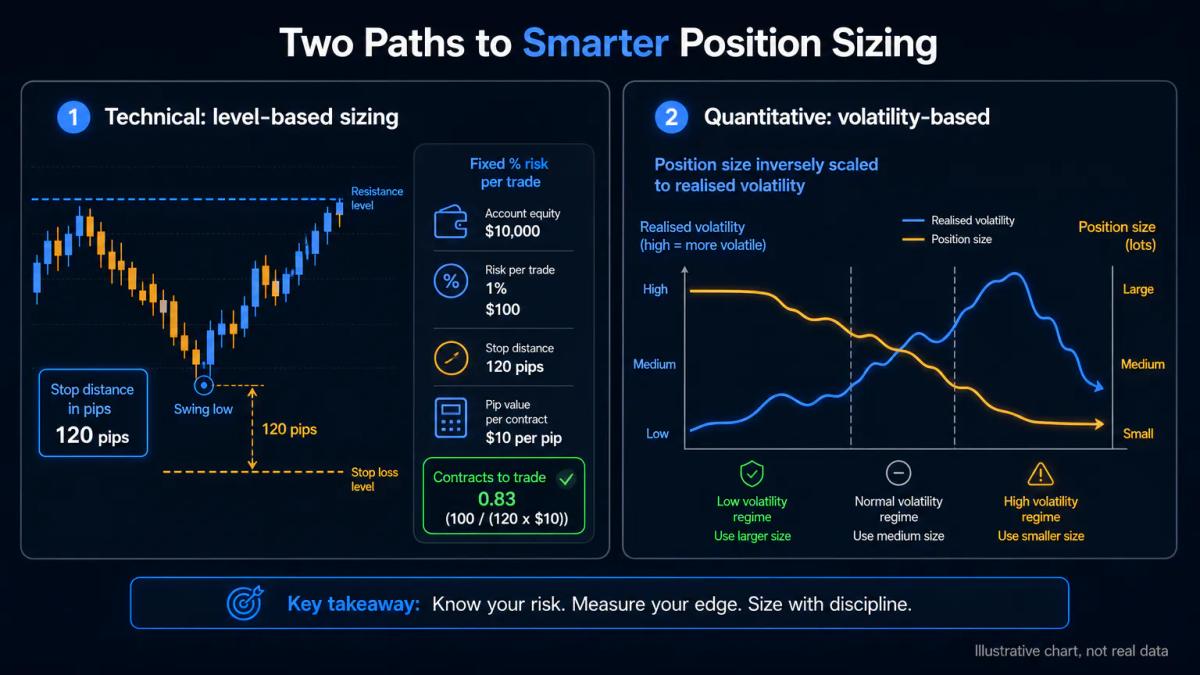
Technical position sizing is level-based and works from the chart itself. You define the invalidation point on the chart, whether that sits below the swing low or beyond the failed breakout, measure the distance to it in pips or points, and then size the position so that being stopped out costs a fixed percentage of equity, commonly somewhere between 0.5% and 1%. The R multiple, defined as reward divided by initial risk, frames every trade in the same currency, so that a 3R target taken on 0.75% risk pays 2.25% on the win.
Quantitative sizing works from the distribution of returns instead of any single chart level. Volatility targeting scales positions inversely to realised or implied volatility so that each holding contributes a comparable variance to the overall portfolio. Kelly fraction sizing takes the estimated edge and variance and derives a theoretically optimal bet size, then applies a fractional Kelly, typically around a quarter, to survive parameter estimation error. On top of individual position sizing, portfolio-level constraints cap gross exposure, per-sector exposure and drawdown; if the strategy breaches a 15% peak-to-trough drawdown limit, it de-risks or halts automatically.
Can you combine both approaches?
Integration works in two directions and is how most professional books actually operate. From the top down, a quantitative regime filter, which typically classifies markets as trending or mean-reverting based on realised volatility and dispersion, decides which technical playbook is live at any given time. When the regime score flags trend, breakout setups run; when it flags range, fade setups take over instead. From the bottom up, individual technical patterns get backtested statistically before any capital is committed to them, so that a description like 'bull flag on the 4-hour' turns into a coded rule with a measured hit rate, average R and drawdown profile.
The practical rule for combining the two is that quantitative work handles validation and gating, while discretion is reserved for the edges of execution. Walk-forward tested rules define the setup universe and the risk budget, and chart reading is used to skip a trade when the microstructure looks broken. Warning signs on that front include:
- A high-impact news release pending within minutes.
- Spreads widening beyond their usual session range.
- A visibly thin order book at the level you plan to trade.
This kind of veto-only discretion is a different practice from overriding trades by feel, which tends to erode the statistical edge that the systematic work was designed to capture.
For a concrete example of costs and platform, the Global Prime review goes through them line by line.
Frequently Asked Questions
Is technical analysis or quantitative analysis more profitable for retail traders?
Neither method has a structural profit advantage at retail scale; execution discipline and risk sizing determine outcomes more than the choice. Technical analysis has a lower barrier and a faster feedback loop, which suits traders with limited coding time. Quantitative analysis compounds better once you have a validated model because it scales across symbols without extra decision effort.
Do I need to learn to code to use quantitative analysis?
For anything beyond built-in MT5 optimisation, yes. Python is the standard: pandas for data handling, Backtrader or vectorbt for backtesting, and a broker API for execution. Expect three to six months of focused work to reach a level where you can code, validate and deploy a simple rule-based strategy end to end.
Can technical analysis work on cryptocurrency or only on stocks and forex?
Technical analysis applies wherever price and liquidity form structure, including crypto spot markets. Note that CFDs on crypto are prohibited for UK retail clients by the FCA, so a UK-based trader has to access crypto through a spot venue rather than through a CFD account at an FCA-authorised broker.
How long does it take to build a working quantitative trading system?
A first backtested system in Python on daily equity or FX data is realistic in two to three months if you already program. Getting it to survive walk-forward testing, out-of-sample data and live paper trading typically adds another six to twelve months, most of which is spent removing bias, cleaning data and shrinking overfitted parameters.
What happens to a technical analysis strategy when market conditions change suddenly?
Discretionary technical traders can reprice context immediately, tighten stops, flatten or reverse, because they read structure in real time. This is the main edge over static systematic rules during regime shifts. The trade-off is that the same flexibility becomes a liability when it turns into unstructured overrides after a losing streak.
About the authors


Put this into practice
Related articles

Trend Line Trading: How to Draw, Trade, and Manage Risk with Price Action
A practical guide to trend line trading for retail traders: drawing rules, entry and exit signals, stop placement, common mistakes, and a worked GBP/USD example.

Volume in Trading Explained: How to Read Market Activity
A practical guide to volume in trading: what it measures, how it confirms price moves, and how to use OBV, VWAP and volume patterns across asset classes.

W Candlestick Form Explained: From Recognition to Execution
A working guide to the W candlestick form: how it builds, how to trade it, where to place your stop, and how to spot the failure modes that trap retail traders.
0 comments