



Technical Analysis · Intermediate · 13 min read
Trend Line Trading: How to Draw, Trade, and Manage Risk with Price Action
Trend line trading is a price action method where you draw diagonal lines connecting two or more swing highs or lows, then use those lines as dynamic support or resistance to time entries and exits.
When price bounces off the line, you trade with the trend; when it breaks decisively, you flag a reversal.
Here's how it works in detail.
What is Trend Line Trading and How Does It Work
Trend line trading is a discretionary technique built on one visual object: a diagonal line drawn across two or more swing points on a price chart. In an uptrend, that line connects rising swing lows and acts as dynamic support. In a downtrend, it connects falling swing highs and acts as dynamic resistance. A swing low is a candle whose low is lower than the candles on either side; a swing high mirrors that on the upside.
The method works because market participants watch the same lines. When enough traders route stops and limit orders around a well-defined trendline, the line becomes a self-reinforcing decision zone. Price approaches, orders trigger, and the line either holds (a bounce) or fails (a break). Your job is to read which of the two is happening in real time.
Unlike moving average systems, trend line trading uses no lagging calculation. You react to the chart itself. This makes it portable across forex, indices, single stocks, commodities and crypto contracts for difference (CFDs), which are derivatives that mirror an underlying asset's price without you owning it. Note that the Financial Conduct Authority (FCA) prohibits the sale of crypto CFDs to UK retail clients, so if you trade crypto trendlines from the United Kingdom, you do so on the spot market via a separately regulated venue, not through a CFD broker.
The payoff of learning trendlines well is a repeatable framework. You define the trend, you define the entry, you define invalidation, and you size your position accordingly.
Apply this analysis on a proper platform — compare the best forex brokers.
How to Draw Trendlines on Uptrends and Downtrends
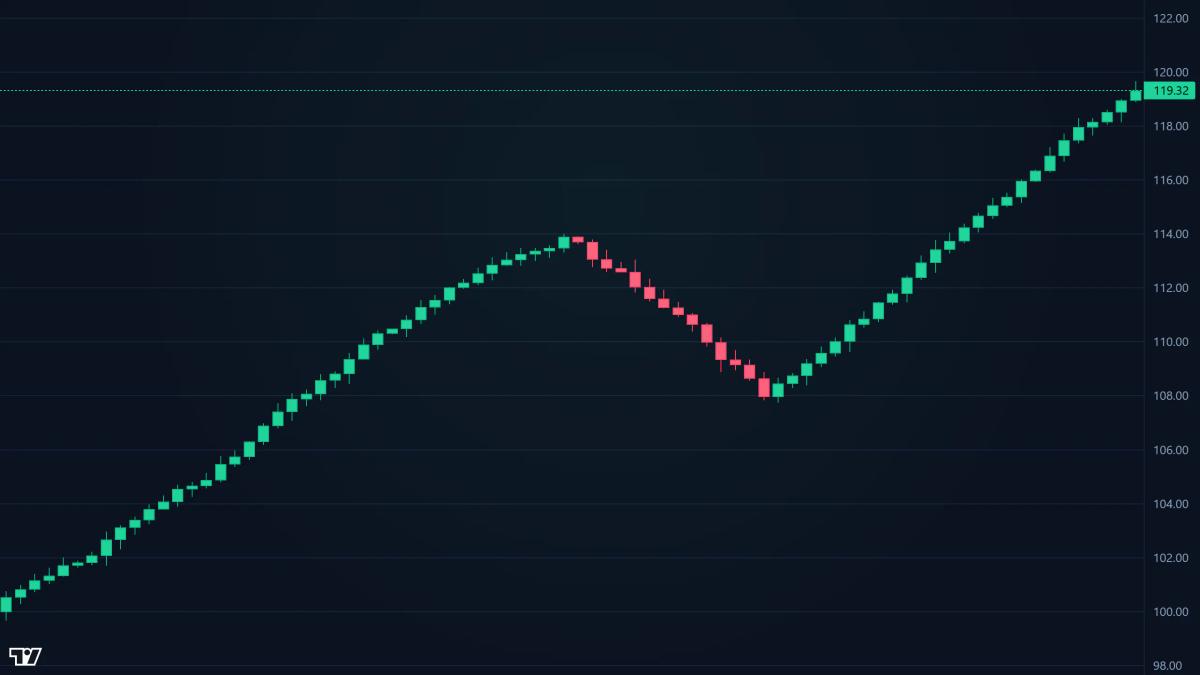
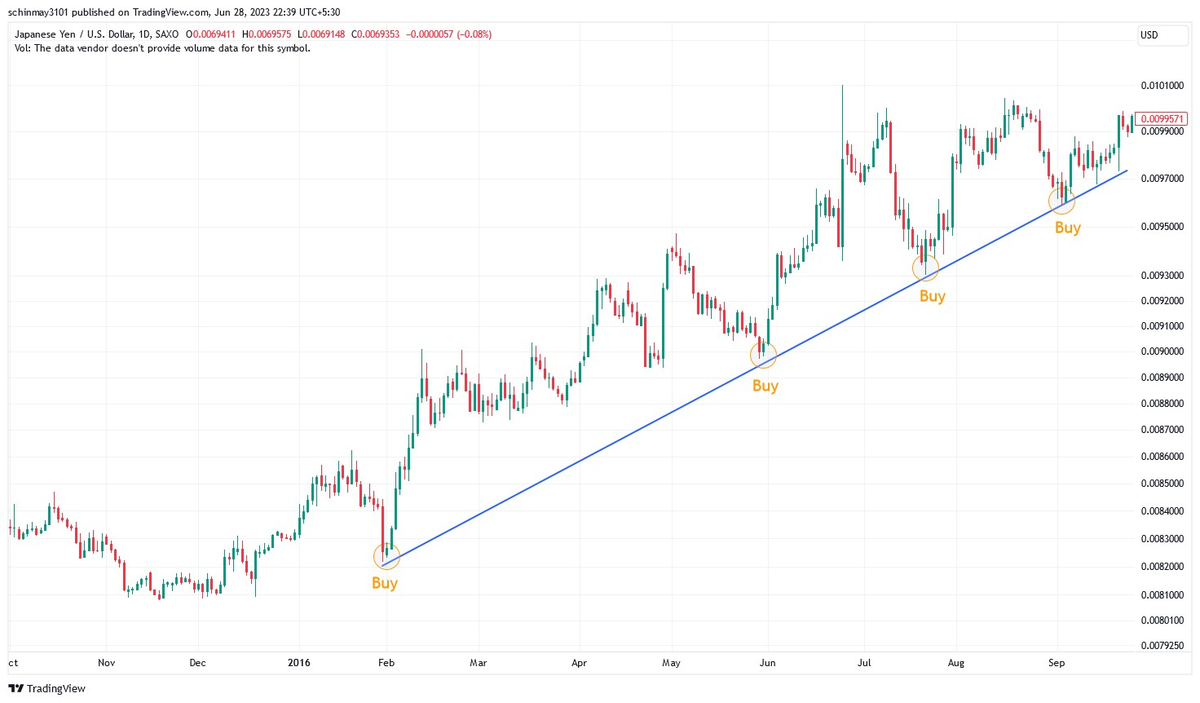
To draw an uptrend trendline, connect at least two consecutive swing lows with a diagonal line sloping upward. A third touch that respects the line confirms it is valid and tradeable.
For downtrends, connect two or more swing highs with a line sloping downward. Each successive low in an uptrend must be higher than the previous one; each successive high in a downtrend must be lower. If that condition fails, the trend is not intact and the line does not qualify.
The biggest choice you will make is bodies versus wicks. Connecting candle bodies (the open-to-close portion) produces cleaner, more conservative lines that ignore intrabar spikes. Connecting wicks (the full high or low, including the thin lines above and below the body) captures every extreme, at the cost of noise. Most experienced discretionary traders draw bodies first, then check whether the wick version tells a materially different story. If both versions cluster together, you have a strong line.
The table below summarises the drawing rules.
| Rule | Uptrend line | Downtrend line |
|---|---|---|
| Connect | Swing lows | Swing highs |
| Slope | Upward left to right | Downward left to right |
| Minimum touches to draw | 2 | 2 |
| Touches to confirm | 3 | 3 |
| Structural condition | Higher lows | Lower highs |
| Preferred anchor | Candle bodies | Candle bodies |
One practical detail: on MetaTrader 4 (MT4), MetaTrader 5 (MT5), cTrader and TradingView, the trendline object snaps to the nearest price by default. Turn on magnet mode (or ray mode on TradingView) so your line anchors precisely to the swing point you intend, not to whatever your cursor grabs.
Entry and Exit Signals: Bounces, Breaks, and Confirmation

A trendline bounce is your primary entry signal. Price drifts back to a validated line, prints a rejection candle (a hammer at support, a shooting star at resistance, or a simple bullish engulfing pattern) and turns back into the trend. You enter on the close of the confirmation candle. The touch alone is a location; the candle close is evidence that buyers or sellers actually defended the line.
A trendline break is the mirror event. Price closes decisively on the wrong side of the line, typically by a margin larger than the average range of recent candles. The word decisively matters. A wick through the line that closes back inside is a stop hunt. Waiting for a full-body close beyond the line, on the timeframe you traded the trend, filters most of these false signals.
Traders use three exit approaches. The first is a fixed profit target at the next visible swing high (for longs) or swing low (for shorts), which gives you a defined risk-to-reward ratio before you enter. The second is a trailing exit, where you move your stop below each new higher low as the trend extends. The third is a trendline-based exit, where you stay in the trade until price closes on the wrong side of the line.
| Signal | Trigger | Entry | Typical stop |
|---|---|---|---|
| Bounce (long) | Rejection candle at uptrend line | Close of confirmation candle | Below the swing low that formed the bounce |
| Bounce (short) | Rejection candle at downtrend line | Close of confirmation candle | Above the swing high that formed the bounce |
| Break (reversal long) | Full close above downtrend line | On close, or on retest of broken line | Below the retest low |
| Break (reversal short) | Full close below uptrend line | On close, or on retest of broken line | Above the retest high |
The retest entry, waiting for price to return to the broken line and reject it from the other side, is usually the higher-quality trade. You give up some pips of immediate move, but you gain a much tighter and more logical stop.
Risk Management and Stop-Loss Placement with Trendlines
Your stop loss sits just beyond the trendline on the opposite side of your entry.
For a long trade on an uptrend bounce, place the stop a few pips (a pip is the fourth decimal in most forex pairs and represents the smallest standard price increment) below the trendline, ideally below the swing low that formed the bounce candle. For a short on a downtrend bounce, place it above the swing high.
The logic is simple: if price prints a new low below the swing low, the trendline structure is broken and the reason for the trade no longer exists.
Position size flows from that stop. Decide first how much of your account you are willing to lose on the trade. A common ceiling among retail discretionary traders is 1% of account equity per position. Divide that risk figure by the stop distance in pips (or points, or currency units) to get your position size. This calculation caps your downside no matter how confident the setup looks.
Leverage sits on top of position sizing. As of 2024 and reaffirmed in 2025, FCA-authorised brokers cap retail leverage at 30:1 on major forex pairs, 20:1 on major indices, 10:1 on non-major indices and gold, 5:1 on individual equities, and 2:1 on remaining commodities. These caps limit how large a position your margin can support, but they do not replace disciplined stop placement. A tight stop on an over-leveraged position still blows up an account.
Common Mistakes Traders Make with Trendlines
The most frequent error is drawing trendlines too loosely: connecting wicks selectively, cherry-picking two random lows on a chart with a dozen candidates, and ignoring the two-touch minimum. A line drawn to fit a narrative is not a trendline; it is a hope. If you find yourself sliding the anchor points to make the line touch price, you are curve-fitting the past.
The second mistake is trading every touch without confirmation. A trendline is a location where a reaction becomes more likely, not a guaranteed reversal. Enter only when a candle prints the rejection, not when the wick brushes the line. Traders who buy at first touch pay for that impatience with a stream of small losses.
A third habit is chasing breaks after they have already run. By the time a break is obvious to everyone on X or in a Discord, the initial move has often extended two or three times the average candle range, and the retest is already forming somewhere below your fill. Waiting for the retest costs you a fast entry but usually pays you a better one.
The fourth mistake is emotional: revenge trading after a trendline break stops you out. You draw a new line, force a setup, size up to make back the loss, and compound the damage. According to the FCA's own consumer research on high-risk investments (multi-year work culminating in policy statement PS23/6, 2023), a substantial share of retail investors trade without a plan for losses, and behavioural biases including recency and overconfidence drive repeat losses. The lesson is that after any trendline stop-out, step away from the chart for the length of the timeframe you were trading before drawing anything new.
Finally, confirmation bias. Once you decide the trend is up, every wick looks like a bounce and no candle looks like a break. Force yourself to consider the opposite view before every entry.
Trendline Trading Across Timeframes and Asset Classes
Trendlines work on every timeframe from the 1-minute chart to the weekly, but reliability scales with the timeframe.
Higher timeframes (4-hour, daily, weekly) produce fewer signals with a higher hit rate because they filter out intraday noise and coincide with the levels institutional flow actually watches. Lower timeframes (1-minute, 5-minute) produce many signals with a lower hit rate, and require faster execution and tighter spreads (the gap between the buy and sell price, which is your immediate cost).
A sensible workflow combines two timeframes. You define the trend on a higher timeframe, for example the 4-hour, and you time the entry on a lower timeframe, for example the 15-minute. The higher timeframe trendline tells you which direction you are hunting; the lower timeframe candle tells you when to pull the trigger. This top-down approach is the single most common structure among experienced discretionary traders and cuts down on random signals.
| Timeframe | Typical style | Signal frequency | Trade duration | Reliability |
|---|---|---|---|---|
| 1m to 5m | Scalping | Very high | Minutes | Low, spread-sensitive |
| 15m to 1h | Intraday | High | Hours | Moderate |
| 4h | Swing | Moderate | 1 to 5 days | High |
| Daily | Position | Low | Weeks | Very high |
| Weekly | Long-term | Very low | Months | Very high |
The method is asset-agnostic. Forex majors, US and European indices, individual equities, gold, oil and crypto spot markets all respect trendlines because all of them are driven by order flow that clusters around visible levels. Adjust two things across assets: the pip or tick value in your position size calculation, and the leverage available under your regulator. UK retail clients face the FCA leverage caps listed above and cannot access crypto CFDs at all through UK-authorised entities.
Trendline Trading Versus Other Technical Analysis Methods
Trendline trading is pure price action and requires no indicators, unlike moving average, MACD (moving average convergence divergence) or RSI (relative strength index) systems. That has trade-offs. Price action is faster to read because you are looking at the chart directly. It also demands more discretion, because two competent traders can draw two slightly different lines on the same chart.
Compared to horizontal support and resistance, trendlines are dynamic. Horizontal levels sit still; trendlines rise or fall with the market structure. In a strong trend, this makes trendlines more useful because they track the actual path of least resistance. In a choppy, sideways market, horizontal levels are more reliable because there is no directional structure for a diagonal line to follow.
| Method | Requires indicators | Best regime | Speed to read | Discretion required |
|---|---|---|---|---|
| Trendlines | No | Trending | Fast | High |
| Horizontal S/R | No | Ranging | Fast | Moderate |
| Moving averages | Yes | Trending | Slow (lag) | Low |
| MACD | Yes | Trending | Slow (lag) | Low |
| RSI | Yes | Ranging | Moderate | Moderate |
| Fibonacci retracement | No | Pullbacks in a trend | Moderate | High |
Most traders eventually combine methods. A trendline entry on the 4-hour chart, filtered by whether price is above or below the 200-period moving average, and confirmed by an RSI reading that is not already at an extreme, is a common composite setup. The trendline provides the location and invalidation; the other tools provide context.
Real-World Trade Example: Entry, Exit, and Outcome
Assume GBP/USD is in a clear uptrend on the 4-hour chart. You draw a trendline connecting two swing lows at 1.2650 and 1.2680, with a third touch at 1.2685 confirming validity. Price pulls back to the line for a fourth time and prints a bullish engulfing candle whose body closes at 1.2692.
You enter long at 1.2693 on the next candle open. Your stop loss goes at 1.2675, three pips below the swing low that formed the bounce, giving you 18 pips of risk. Your profit target is the previous swing high at 1.2755, giving you 62 pips of upside and a 1:3.4 risk-to-reward ratio.
With a $10,000 account and a 1% risk limit ($100), your position size is $100 divided by 18 pips, or approximately 5.5 mini-lots (a mini-lot is 10,000 units of the base currency, and one pip on a mini-lot of GBP/USD is worth roughly $1). Price rallies over the next 36 hours, prints a marginal new high at 1.2751 and reverses. You exit at your target minus 4 pips, banking 58 pips, or about $319 gross.
| Trade element | Value |
|---|---|
| Instrument | GBP/USD |
| Timeframe | 4-hour |
| Direction | Long |
| Entry | 1.2693 |
| Stop loss | 1.2675 |
| Target | 1.2755 |
| Risk (pips) | 18 |
| Reward (pips) | 62 |
| R:R | 1:3.4 |
| Result | +58 pips, +$319 gross |
The point is that every variable was decided before you clicked buy. Entry, stop, target, and size were logical consequences of the trendline, not reactions to the P&L blinking on your screen.
Frequently Asked Questions
How many times must price touch a trendline before it is valid?
Two touches let you draw a line, but the line only qualifies as tradeable after a third touch that respects it. Trading the first bounce after the second touch is possible, but the historical hit rate is lower because the line has not yet been tested by other market participants.
What is the difference between a trendline bounce and a trendline break?
A bounce is when price approaches the line, prints a rejection candle, and turns back into the trend, offering a trend-continuation entry. A break is when price closes decisively on the opposite side of the line by a margin larger than the recent average candle range, often signalling a reversal or at least a pause in the trend.
Can you trade trendlines on the 1-minute timeframe, or are they only reliable on higher timeframes?
You can, but reliability drops sharply. On the 1-minute chart, spread costs are a bigger share of each trade, noise generates false signals, and execution needs to be near-instant. Most consistent discretionary traders use 15-minute charts as the lowest practical timeframe for trendline entries and prefer 1-hour or 4-hour.
How do you know when a trendline is no longer valid and needs to be redrawn?
A trendline is invalid once price closes decisively on the wrong side of it on the timeframe you drew it on, or once a new swing point (a lower low in an uptrend, a higher high in a downtrend) breaks the underlying structure. When either happens, delete the line and reassess the trend from scratch on a higher timeframe.
Should you use trendlines in combination with other indicators, or is price action alone sufficient?
Price action alone is sufficient once you are experienced, but most traders benefit from one filter. A common composite is a 200-period moving average to define the broader trend and an RSI check to avoid entries when price is already stretched. The trendline still drives the entry and stop; the extra tools just remove low-quality setups.
About the authors


Put this into practice
Brokers we have reviewed
Scored on the same five dimensions. Here are three of them — the full list is on the brokers page.



Related articles

Volume in Trading Explained: How to Read Market Activity
A practical guide to volume in trading: what it measures, how it confirms price moves, and how to use OBV, VWAP and volume patterns across asset classes.

W Candlestick Form Explained: From Recognition to Execution
A working guide to the W candlestick form: how it builds, how to trade it, where to place your stop, and how to spot the failure modes that trap retail traders.

What Is a Break of Structure in Trading? BOS Price Action Explained
A plain-English guide to break of structure: how to spot bullish and bearish BOS, tell it apart from Change of Character, and avoid the classic mistakes.
0 comments