



Financial Markets · Beginner · 6 min read
Trading Halts Explained: Circuit Breakers, Suspensions, and Delays
Did you know regulators and exchanges can stop the stock market at will?
A trading halt is a temporary pause in trading for a single security or an entire market to protect investors when volatility, pending news or a severe order imbalance threatens orderly pricing. Halts can last five minutes, fifteen minutes, or, in a full-day market event, until the next session opens.
In this article, you'll learn how and why it happens.
What is a Trading Halt?
A trading halt is a controlled pause during which no trades can execute in the affected security or market. The exchange stops matching buy and sell orders, quotes are suspended, and existing orders sit idle until trading resumes. The purpose is to let information disseminate, allow buyers and sellers to reassess, and prevent disorderly price moves.
Halts sit inside a wider regulatory toolkit. According to the U.S. Securities and Exchange Commission, a Level 1 or Level 2 market-wide circuit breaker triggered before 3:25 p.m. ET pauses US trading for 15 minutes, while a Level 3 breach closes the market for the rest of the day. The duration depends on which rule fires, and on the time of day.
Market-Wide Circuit Breakers and S&P 500 Thresholds
Market-wide circuit breakers are automatic pauses that stop every US equity trade when the S&P 500 Index (the benchmark of the 500 largest US listed companies) falls by set percentages from the prior day's close. They apply to the whole market, not one stock, and they trigger without any human decision.
According to the U.S. Securities and Exchange Commission, three levels apply: a 7%, 13%, or 20% drop triggers Level 1, Level 2, and Level 3 respectively. The current framework was implemented on April 8, 2013, replacing older thresholds of 10%, 20% and 30% tied to the Dow Jones Industrial Average. Level 1 and Level 2 fire only once per day.
Individual Stock Halts: Limit Up-Limit Down Rules
The Limit Up-Limit Down (LULD) plan pauses trading in a single security when its price drifts outside a permitted band, protecting the stock from erratic swings that are not backed by real order flow. It is the everyday cousin of the market-wide breaker: narrow, frequent, and stock-specific.
Understanding how stocks versus indices behave during volatility events can help you prepare for these pauses.
According to the U.S. Securities and Exchange Commission, if a stock's price stays outside its LULD band for 15 seconds, trading in that security is paused for 5 minutes. Price bands are set at 5%, 10%, 20%, or the lesser of £0.15 or 75%, depending on the reference price and whether the security is a Tier 1 or Tier 2 National Market System stock (the tier reflects size and liquidity).
Why Trading Halts Happen: News, Imbalance, and Volatility
Exchanges and regulators halt trading for three broad reasons. Each has a different trigger, a different typical duration, and a different signal to you as a trader.
| Trigger | What it means | Typical duration |
|---|---|---|
| Pending news | A material announcement (earnings restatement, merger, drug trial, bankruptcy) is about to hit the wire and could reprice the stock | Minutes to a few hours, until the news is disseminated |
| Order imbalance | Buy and sell orders are heavily one-sided at the open or close and cannot be matched at a fair price | Short pause during auctions, usually under five minutes |
| Volatility | Price moves breach LULD bands or market-wide circuit breaker thresholds | 5 minutes (LULD), 15 minutes (Level 1/2 MWCB), rest of day (Level 3) |
A news halt (often labelled T1 on Nasdaq) buys time for the market to read a filing before quoting. An imbalance halt protects auction price discovery. A volatility halt breaks a feedback loop where price moves trigger algorithmic orders that trigger further price moves.
How to read earnings call transcripts can help you understand the material announcements that often trigger news halts. Together, they explain nearly every halt you will see on a US exchange.
Halts, Delays, and Suspensions: Key Differences
These three actions look similar, but they come from different parts of the rulebook. A halt is a short exchange-driven pause during the session. A delay stops a stock from opening or resuming at the scheduled time, usually because of an imbalance or a pending disclosure. A suspension is a longer regulatory action taken by the SEC itself, not the exchange.
According to the U.S. Securities and Exchange Commission, the SEC may suspend trading in any stock for up to 10 trading days when it judges suspension is required in the public interest and for the protection of investors. That is a very different weight class from a five-minute LULD pause.
How Halts Affect Your Trading Strategy and Portfolio
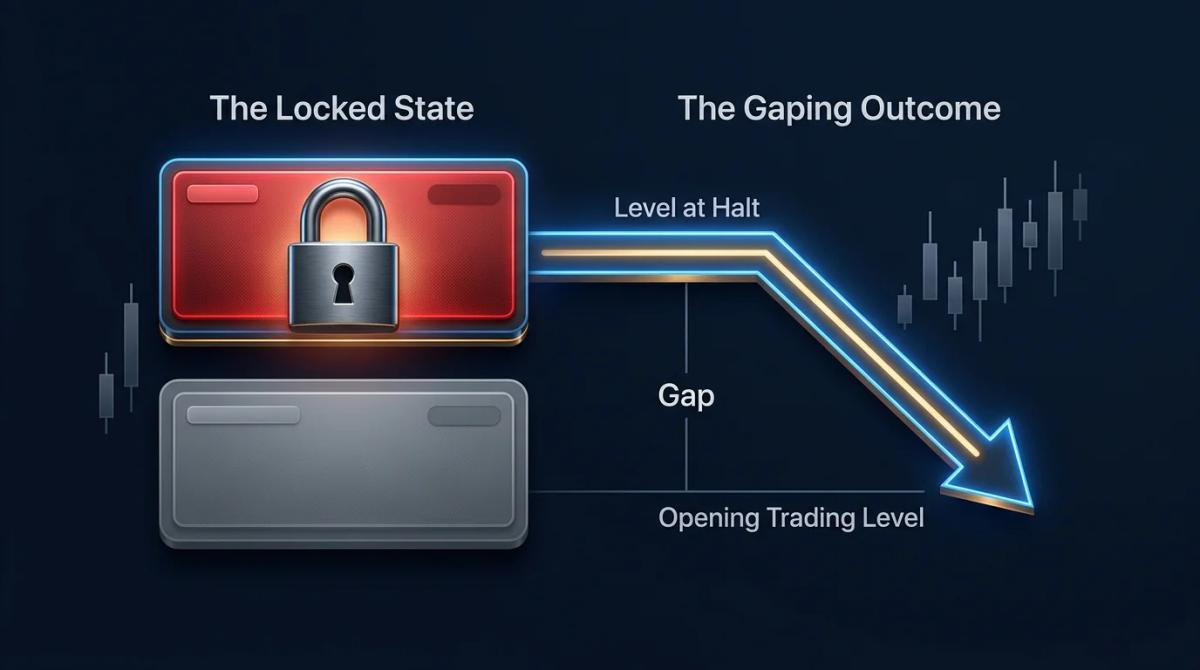
When a stock you hold is halted, you cannot sell, buy, cancel or modify orders in that security. Stop-loss orders (instructions to sell at market once a trigger price is reached) do not execute during the halt, and when trading resumes the reopening price often gaps far from the last print. That is where retail portfolios take real damage.
Practical position management follows from this. Size single-name exposure so that a 20% overnight gap does not break the account. Prefer wider mental stops on news-sensitive tickers (biotech, small caps, event-driven names) because tight stops rarely fill at the intended price after a halt. Watch for scheduled catalysts, and consider trimming into them.
Understanding the ATR indicator for measuring volatility can help you set more realistic stop levels on volatile names. High-frequency systems typically pull quotes into a halt and re-price cautiously on resumption, which is why the first minutes after reopening are unusually volatile.
Tracking Current and Historical Trading Halts
The SEC, Nasdaq and NYSE publish live halt feeds and downloadable historical files. You can filter by ticker, date, and halt code (for example, T1 for news pending, LUDP for a Limit Up-Limit Down pause, M for market-wide circuit breaker). Rules on major venues abroad, including the London Stock Exchange, Euronext, the Toronto Stock Exchange and the Australian Securities Exchange, follow the same logic: volatility bands, news pauses, and regulator-driven suspensions, with locally calibrated thresholds.
Frequently Asked Questions
How long does a typical trading halt last?
Most single-stock volatility halts under Limit Up-Limit Down last five minutes. News-related halts usually run from a few minutes to a couple of hours while the announcement is disseminated. According to the U.S. Securities and Exchange Commission, market-wide circuit breakers pause US trading for 15 minutes at Level 1 or Level 2, and close the market for the day at Level 3.
Can I sell my shares during a trading halt?
No. When a security is halted, the exchange stops matching orders in that stock. You cannot execute a sale, and existing stop-loss or limit orders do not fill during the pause. When trading resumes, orders enter the reopening auction and may execute at a price far from the last print before the halt.
What is the difference between a halt and a suspension?
A halt is a short exchange action, typically minutes to hours, driven by volatility, imbalance or pending news. A suspension is a longer regulatory action ordered by the SEC when it judges the pause is needed in the public interest. According to the U.S. Securities and Exchange Commission, an SEC suspension can last up to 10 trading days.
How do I find out if a stock I own is halted?
Your broker's platform normally flags halted tickers on the quote. For confirmation, the SEC, Nasdaq and NYSE publish live halt feeds that list the ticker, halt code, and time of the pause. You can search by symbol and see the reason (for example, T1 for news pending or LUDP for a Limit Up-Limit Down pause).
Do trading halts happen on all exchanges worldwide?
Yes. Major venues including the London Stock Exchange, Euronext, the Toronto Stock Exchange and the Australian Securities Exchange operate their own volatility bands, news pauses and regulator-driven suspensions. The mechanics differ in thresholds and code names, but the purpose is the same: protect orderly pricing when information or volatility overwhelms the order book.
About the authors


Put this into practice
Related articles

Types of ETFs: a practical guide to equity, bond, commodity and specialty funds
The main types of ETFs, from broad market equity funds to leveraged and ESG options, and how to match each to your goals, costs and risk tolerance.

What Are Derivatives? A Beginner’s Guide to Derivative Instruments
Learn what derivatives are, how they work, and why they matter. This beginner's guide covers futures, options, swaps, forwards, and key risks to understand.

What Is Commodity Trading? A Beginner’s Guide to Trading Commodities
Learn what commodities are, how commodity markets work, and the different ways to trade them, from futures and CFDs to ETFs and commodity stocks.
0 comments