



Technical Analysis · Beginner · 7 min read
Nison Japanese Candlestick Charting Techniques: How to Read Price Action
What Japanese candlestick charting is and why traders use it
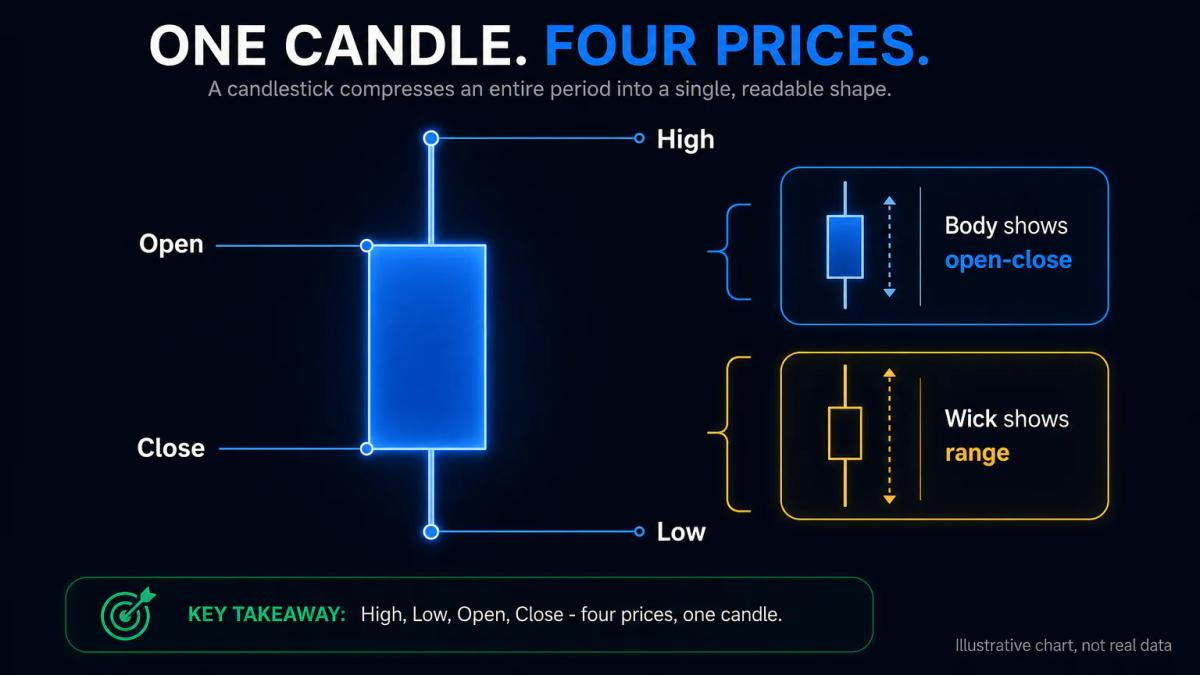
Every candlestick packs four data points into one shape: the open, the high, the low, and the close for a fixed period. That shape reads like a snapshot of the tug of war between buyers and sellers, with the body showing the open-to-close range and the wicks marking the extremes reached along the way. Traders lean on candlesticks because momentum, exhaustion, and hesitation become visible without piling on extra indicators.
Steve Nison brought these charts to Western markets in the early 1990s, documenting the Japanese method for English-speaking traders. The Nison framework reframed price action around three cues that carry the same meaning whether you look at EUR/USD, gold, or Bitcoin: body size, wick length, and pattern sequences. One candle offers a snapshot, and a sequence of two or three candles begins to tell a story about who is winning the exchange.
If you still need a broker, our guide to the best forex brokers compares the regulated options side by side.
Core candlestick patterns and what they signal
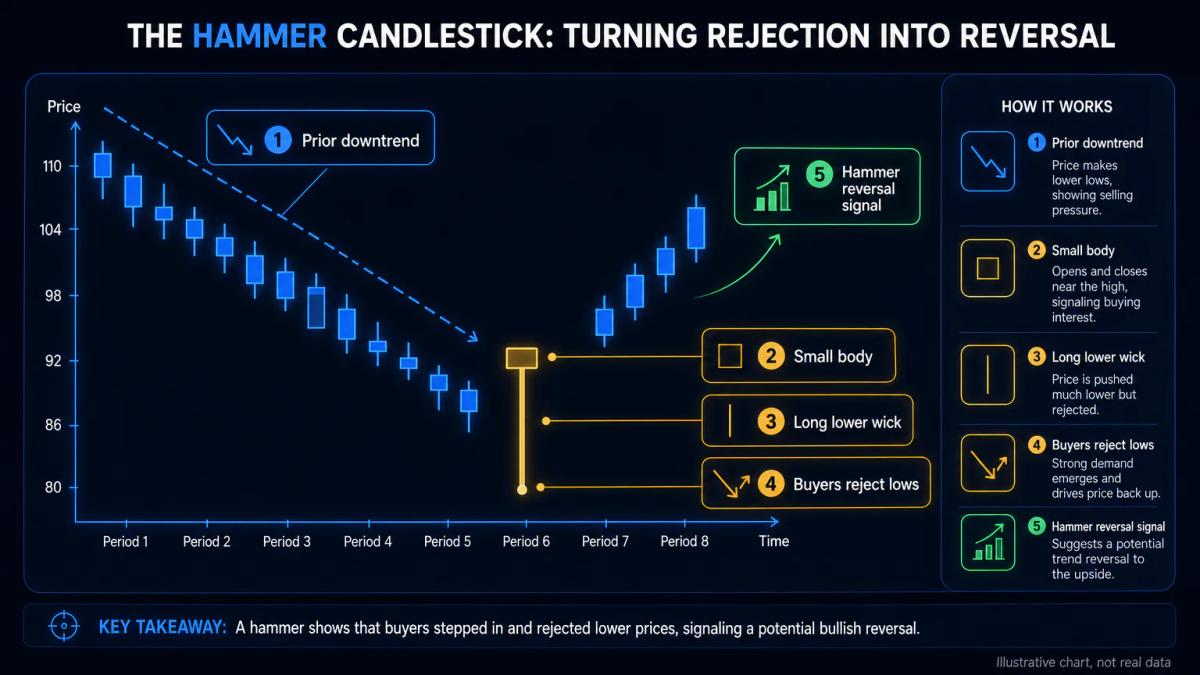
Candlestick patterns split into two groups. Reversal patterns mark a probable change in trend direction, while continuation patterns suggest the current trend will persist. Each name refers to a specific arrangement of open, high, low, and close across one to three candles.
The most common single- and multi-candle patterns share a small set of shapes and locations:
- Hammer: a single candle with a small body near the top and a long lower wick that appears after a downtrend, hinting that buyers rejected lower prices.
- Hanging man: the same shape appearing after an uptrend, a warning that sellers are testing control.
- Bullish engulfing: a small down candle fully wrapped by a larger up candle, signalling that buyers have taken over.
- Morning star: a three-candle bottoming sequence made of a strong down candle, a small indecisive candle, and a strong up candle.
- Rising three methods and tasuki gap: continuation shapes describing short pauses inside a trend that resolve in the trend's direction.
| Pattern | Type | Candles | Typical location |
|---|---|---|---|
| Hammer | Bullish reversal | 1 | After a downtrend, at support |
| Hanging man | Bearish reversal | 1 | After an uptrend, at resistance |
| Bullish engulfing | Bullish reversal | 2 | End of a pullback |
| Morning star | Bullish reversal | 3 | Bottom of a downtrend |
| Rising three methods | Bullish continuation | 5 | Inside an uptrend |
| Tasuki gap | Continuation | 3 | After a gap in the trend direction |
The strength of any pattern depends on context. A hammer at a well-defined support level carries more weight than one printed in the middle of a range, since the level itself gives buyers a reason to defend price. Volume, where available, remains the confirmation you should always check on lower timeframes.
How candlesticks differ from other charting methods
Candlesticks carry the same OHLC (open, high, low, close) data as bar charts, and they present it more intuitively: the filled or hollow body tells you instantly whether the close was below or above the open, whereas bar charts ask you to compare two small ticks. Line charts plot only the close, so intrabar volatility and the psychological tension between open and close disappear from view.
Other chart types trade information for clarity in different ways:
- Renko charts filter noise by plotting bricks only when price moves a set amount, discarding time from the picture.
- Heikin-Ashi smooths candles using averaged values, which helps you see trend, though it distorts real entry and exit prices.
- Point-and-figure charts strip out time entirely and focus on directional price moves.
Each of these formats has a use, though they all replace actual prices with derived values. Candlesticks keep real market prices while still revealing structure, which is one reason they remain the default on most retail platforms.
Applying candlestick analysis to forex, crypto, and commodities
Candlestick patterns travel well across asset classes because they encode universal behaviour: fear, greed, and hesitation look the same on EUR/USD, on crude oil, and on Bitcoin. Timeframe and market structure, however, change how you weight them from one market to the next.
The way each asset class behaves shapes how much weight to give a pattern:
- Major forex pairs: patterns on the 4-hour and daily charts tend to be cleaner because liquidity is deep and spreads are tight.
- Crypto: markets trade 24/7 with no true session gaps, and volatility spikes around thin-liquidity hours can produce long wicks that look like textbook rejections yet fail within minutes.
- Commodities such as gold and oil often respect candlestick-defined support and resistance more rigidly, because their trading windows concentrate liquidity into predictable sessions.
- Equities add earnings and scheduled announcements that can override any pattern in a single candle, so calendar awareness becomes part of the setup.
Common mistakes when reading candlestick signals
The most frequent mistake is treating one candle as a trade signal without context. A hammer at resistance is not a hammer buy setup; a bullish engulfing inside a strong downtrend is often a continuation trap, not a reversal. Beginners also confuse a pattern's name with predictive power: a morning star raises the probability of a reversal only when it forms at a level that already matters.
Ignoring timeframe distorts everything. A bullish engulfing on the daily is a different animal from one on the 5-minute. Backtesting patterns in isolation, without entry rules, stop placement, and position sizing, produces flattering numbers that fall apart in live markets, a form of curve-fitting, tuning a strategy so tightly to past data that it fails on new data. Finally, ignoring the calendar, central bank meetings, earnings, commodity inventory reports, cancels out otherwise valid signals. A candlestick pattern printed one minute before a rate decision is not a setup; it is noise waiting for a headline.
Combining candlesticks with support, resistance, and volume
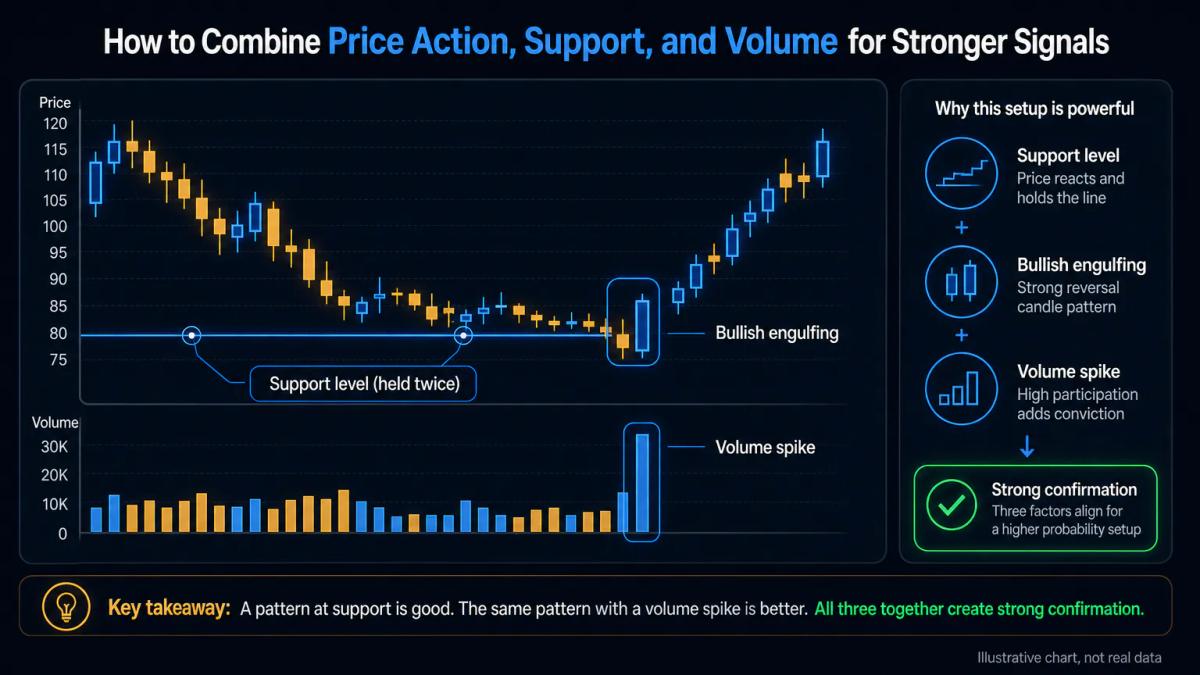
Candlestick patterns become useful when they line up with levels and volume. A bullish engulfing at a horizontal support that has held twice before is a stronger signal than the same pattern in the middle of a range. A hammer that prints on a clear spike in volume shows conviction; the same hammer on low volume shows hesitation.
Volume bars sit beneath the price chart on most platforms and are your simplest confirmation tool. Reversal patterns on high volume suggest real participation; low volume suggests few players are behind the move. A second layer comes from moving averages and Bollinger Bands, a volatility envelope drawn two standard deviations above and below a moving average: patterns that print near the 200-day moving average or at the outer edge of a Bollinger Band tend to have better odds. The logic stays simple: candlesticks show what happened, levels show where it matters, volume tells you whether the move was real.
Tools and platforms for candlestick chart analysis
MT4 and MT5 are the industry standard for candlestick charting; both offer flexible timeframes, custom indicators, and a Strategy Tester for running historical data through a rule set to measure win rate and drawdown, the fall from a capital peak to the trough before a new peak. TradingView is the browser-based alternative, with strong drawing tools and a community of traders publishing pattern analysis; cTrader is a professional option with detailed order management.
For structured backtesting of candlestick strategies, TradingView's Strategy Tester and dedicated backtesting suites let you code entry and exit rules and produce equity curves and trade-by-trade statistics. Most brokers include MT4 or MT5 at no cost, so your broker often decides your platform. TradingView's free tier is enough to learn candlestick reading; the paid plans add real-time data and pattern alerts.
To see these conditions applied by a regulated broker, read our Tickmill review.
Frequently Asked Questions
What is the difference between a bullish and bearish candlestick?
A bullish candlestick closes above its open, so the body is typically hollow or coloured green on most platforms; a bearish candlestick closes below its open, with a filled or red body. The body shows the open-to-close range, while the thin wicks above and below show the high and low reached during the period. Body size hints at conviction: a long green body suggests aggressive buying, a long red body aggressive selling.
How reliable are Japanese candlestick patterns for predicting price movement?
Candlestick patterns are probabilistic, not predictive. A hammer at a well-tested support level with rising volume is more reliable than the same shape mid-range on low volume. Reliability improves when patterns are combined with support and resistance, trend context, and volume confirmation, and when tested on the specific asset and timeframe you trade rather than assumed to work universally.
Can you use candlestick analysis on cryptocurrency and forex charts?
Yes. Candlestick patterns work on any market where you have OHLC data, including forex pairs and crypto. The differences are structural: forex has session gaps and macroeconomic drivers, while crypto trades 24/7 and can produce long wicks in thin-liquidity hours. Match your timeframe to the asset's liquidity, and expect major forex pairs and large-cap crypto to give cleaner patterns than illiquid altcoins.
What is the best timeframe for trading candlestick patterns?
Higher timeframes produce stronger signals because each candle represents more participants and more capital. The 4-hour and daily charts tend to give the cleanest patterns for swing traders; the 1-hour is a common compromise for intraday work. Timeframes below 15 minutes require tighter risk management because noise, spread, and news impact can overwhelm the pattern.
How do you combine candlestick patterns with other technical indicators?
The most common combinations are candlesticks with horizontal support and resistance, with moving averages such as the 50 and 200-day, and with Bollinger Bands. Volume is the simplest confirmation layer. The principle is to use candlesticks to time the entry and use levels and indicators to decide whether the location justifies the trade in the first place.
About the authors


Put this into practice
Related articles

Pennant Pattern: Definition, Trading Strategy, and Breakout Signals
A practical guide to the pennant pattern: how it forms, how to trade bullish and bearish breakouts, and how to size positions while filtering false signals.

RSI Buy and Sell Signals: How to Read Them Correctly
A practical guide to reading RSI buy and sell signals through crossovers, divergence, price structure and risk rules, so the indicator earns its place on your chart.

RSI Indicator Explained: How to Read and Trade the Relative Strength Index
A practical, citable guide to the RSI indicator: formula, thresholds, divergences, failure swings, false signals, and how to tune the period for your trading style.
0 comments