



Financial Markets · Beginner · 8 min read
Forex Market Sentiment: What It Is and How to Read It
The smallest consensus, explained
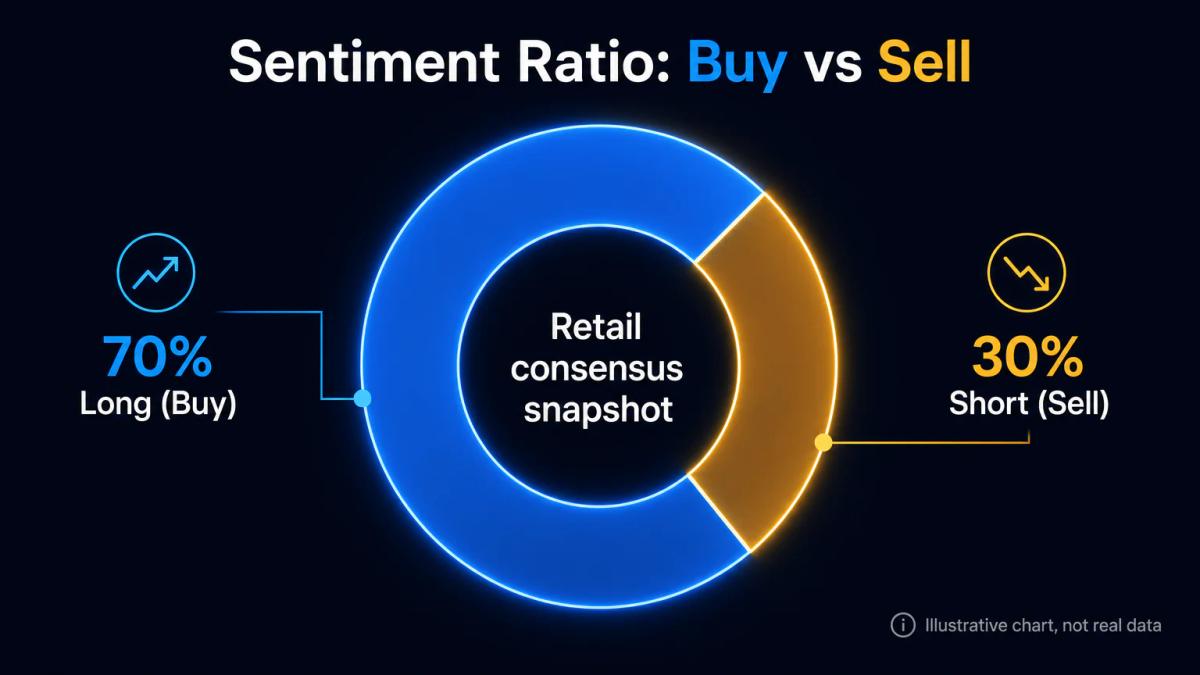
Every currency pair trades against a running tally of who is long and who is short. Brokers and aggregators aggregate that book across their retail clients and publish it as a percentage, giving you a read on the crowd's current lean. For example, a reading of 70% long on EUR/USD means seven out of every ten open retail positions on that pair are buys, with the remaining three sitting short.
This single number captures where the crowd already sits; it does not tell you where price is heading next. Forex market sentiment earns its keep as a behavioural gauge, letting you see whether retail participants are leaning heavily one way, splitting evenly, or piling into a trade that has already gone against them. Read on its own, a ratio is just a data point; combined with price structure and macro context, it becomes a signal.
How sentiment ratios work and what they tell you
A sentiment ratio compares the number of open buy positions to sell positions on a single pair, expressed as a percentage or a decimal. If GBP/USD reads 65% short and 35% long, roughly two in three open retail trades on that broker are betting sterling will fall. Some feeds also report the volume ratio, which weights the same idea by lot size (the standard unit of trade size) and can diverge sharply from the count ratio when a handful of large positions dominate the book.
How you read the ratio depends on where it sits. A balanced ratio around 55/45 tells you neither side has convincingly won the crowd, while a skewed ratio of 75/25 or more signals consensus, and consensus is where contrarian traders start paying attention. Historical behaviour on the major pairs shows that when retail positioning becomes extreme, price tends to move against the crowd more often than with it, though this remains a working assumption behind most sentiment-based setups rather than a hard rule.
One useful habit before acting on any ratio is to check the direction of price over the past few sessions. If retail is 80% long and price has been sliding all week, the crowd is sitting on losing positions, which sets up quite differently from 80% long into a rising market, where the crowd is riding the trend.
Where to find real-time sentiment data
Major brokers and platforms publish live sentiment indicators showing current trader positioning. The most accessible sources for retail traders fall into three groups: broker-native dashboards, aggregator feeds, and futures-based reports. Each has different coverage, refresh frequency and sample size.
| Source type | Refresh rate | Coverage | What it shows |
|---|---|---|---|
| Broker-native sentiment tools | Real-time or hourly | The broker's own client book | Long/short percentage per pair |
| Aggregator feeds (e.g. Dukascopy SWFX) | Every few minutes | Multi-source retail positioning | Buy/sell ratio across sampled brokers |
| CFTC Commitments of Traders | Weekly | US futures market participants | Positioning by trader category |
Broker dashboards refresh the fastest but reflect only that broker's client base, while aggregator indices smooth out single-broker bias by sampling across several sources. The Commitments of Traders (COT) report sits apart from both, drawn from futures rather than spot, and it gives you a look at how large speculators and commercials are positioned on currency futures. Although it is not a retail sentiment feed, the COT remains the closest public read on institutional positioning, which earns it a place as a routine cross-check.
Sentiment extremes and contrarian setups
When sentiment climbs to extreme levels around 90% long or 90% short, the retail crowd is frequently positioned against institutional flows. This is the classical contrarian setup, where the crowd's own conviction becomes the fuel for the reversal, because those late longs must sell to close their positions once price turns, and their forced exits accelerate the move further in the opposite direction.
To quantify what counts as extreme, look at the distribution of the ratio over the past six to twelve months on the pair you trade. On EUR/USD the ratio typically oscillates within a band, and readings that sit in the top or bottom 5% of that band mark the tails worth watching. A one-off spike carries less weight than a sustained extreme: two or three consecutive daily readings above 85% long tell a stronger story than a single afternoon print.
Fading the crowd on its own rarely holds up. A workable contrarian rule set brings in three filters that need to align before the setup counts:
- Sentiment sits in its historical tail (top or bottom 5-10% of the past six months).
- Price is at or near a technical level, i.e. a prior high, a prior low, or a round number.
- Momentum is stalling, shown by rejection candles or divergence on an oscillator such as RSI (an indicator that oscillates between 0 and 100 to flag stretched conditions).
When all three filters align, the reversal probability climbs well above what any single filter provides on its own; when they fail to line up, the disciplined move is to stand aside, since trading a lone sentiment extreme against a strong trend is a well-worn route to losses.
Retail versus institutional sentiment divergence
Retail traders and institutions often hold opposing positions on the same pair. Tracking this divergence helps you spot when the retail consensus is likely wrong. The clearest window into institutional positioning is the Commitments of Traders report, which breaks down positions held by commercial hedgers, large speculators and small speculators.
[CFTC, trader classification]: According to the Commodity Futures Trading Commission (CFTC), the Commitments of Traders reports provide a breakdown of each Tuesday's open interest for futures and options on futures markets in which 20 or more traders hold positions equal to or above the CFTC reporting levels.
According to the Commodity Futures Trading Commission (CFTC), the COT report is released each Friday at 3:30 pm ET, using position data from the immediately preceding Tuesday. That three-day lag makes COT a positioning map rather than a real-time signal, which is worth remembering when you compare it with a live broker feed.
The divergence worth watching looks something like this: retail sentiment feeds show the crowd heavily long EUR/USD, while the COT shows large speculators net short. When these two disagree strongly, the historical pattern favours the institutional side, because retail traders tend to buy dips too early and hold losers too long, while large speculators trade with the trend and manage risk more strictly. The divergence does not have to be perfect for it to be useful; a retail long bias above 70% while non-commercials sit net short is already enough to make you cautious about buying, even when your other signals look constructive.
Using sentiment with technical and macro signals
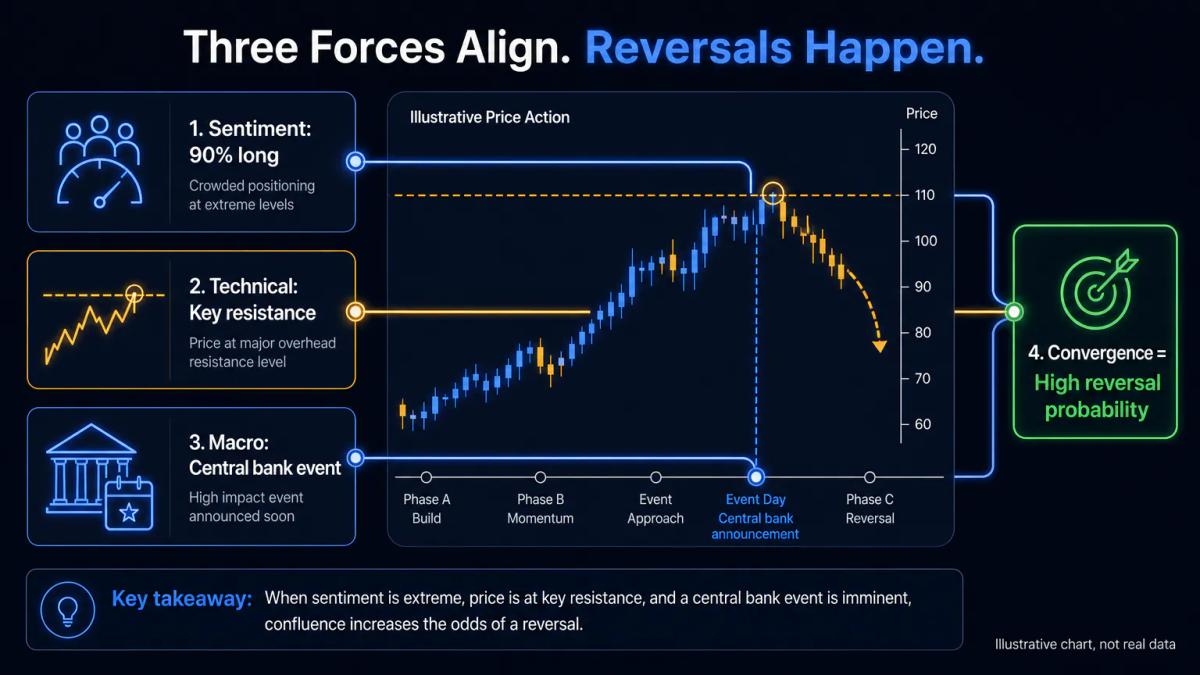
Sentiment does its best work as a confirmation tool alongside other inputs, rather than as a standalone entry trigger. Extreme sentiment near a key technical level, or ahead of a central bank announcement, amplifies the probability of a reversal because two independent forces line up at once: crowd exhaustion on one side, and a scheduled catalyst that forces repricing on the other.
A workable checklist for combining the three inputs:
| Input | What to check | Why it matters |
|---|---|---|
| Sentiment | Ratio in the historical tail | Identifies crowd exhaustion |
| Technical | Price at prior high, low or round number | Identifies where reversals happen |
| Macro | Scheduled release within 24 hours | Identifies the catalyst |
Central bank meetings from the Fed, ECB, Bank of England and Bank of Japan carry the highest impact for the major pairs, with non-farm payrolls, CPI prints and central bank speeches sitting just below in the hierarchy. When retail sentiment is stretched into one of these events, the post-release move often runs against the crowd, because institutional flow rebalances into the new information faster than retail traders adjust their open positions.
The opposite case is equally useful. When sentiment is balanced at 55/45 or tighter going into a major release, neither side has strong conviction to defend, and price often moves cleanly in the direction of the surprise. Balanced sentiment combined with a clear macro catalyst tends to behave as a trend setup rather than a contrarian one, and the practical skill lies in reading which of the two regimes is in force at any given moment.
Sentiment data for emerging and exotic pairs
Sentiment coverage for emerging market and exotic currency pairs is considerably thinner than for the majors. Fewer brokers publish positioning data on USD/TRY, USD/ZAR, USD/MXN or Asian crosses, and when they do publish, the sample size can be too small to be meaningful, with a few hundred open positions standing in for what might be tens of thousands on EUR/USD.
The COT report helps only partially here, since it covers currency futures listed on US exchanges. You get useful data on the Mexican peso and the Brazilian real, though Turkish lira and South African rand are largely absent. According to the Commodity Futures Trading Commission (CFTC), when the number of reportable large traders drops below 20 for a market, that market is removed from the COT report until participation recovers, and emerging pairs are the ones most exposed to falling under that threshold.
A practical approach for exotics looks something like the steps below, since sentiment on these pairs can be flipped by a single large position without reflecting genuine crowd behaviour:
- Cross-reference two or three broker feeds wherever the pair has coverage.
- Watch the COT report if the currency has a listed futures contract on a US exchange.
- Weight the sentiment input less than you would on a major pair.
- Lean on technical levels and interest-rate differentials as your primary inputs, and treat any sentiment read as a soft check rather than a hard signal.
Frequently Asked Questions
Is forex sentiment a reliable trading signal on its own?
No. A sentiment ratio is a snapshot of what other retail traders have already done, not a directional prediction. Used alone it produces frequent false signals, especially in strong trends where the crowd is on the right side. Sentiment becomes reliable when it confirms a setup built on technical levels and macro context, not when it drives the setup.
How often does sentiment data update, and which brokers publish it?
Broker-native sentiment dashboards typically update in real time or on an hourly cycle, drawing from their own client book. Aggregator indices such as the Dukascopy SWFX Sentiment Index refresh every few minutes and sample multiple sources. The CFTC Commitments of Traders report is a separate, weekly release covering futures market participants rather than spot retail traders.
What does it mean when sentiment is extremely one-sided?
An extreme reading (roughly 85% or more on one side) means the retail crowd has heavy consensus. Historically that positioning often sits against the direction price ultimately takes, because late entrants must eventually close losing trades. Extremes are best read as a warning that crowd conviction is stretched, not as an automatic reversal trigger. You still need a technical level and a catalyst.
Can you backtest historical sentiment data to validate a strategy?
Yes, if you have access to a historical sentiment feed. Some aggregators and brokers archive daily or hourly ratios, which you can align with historical price data and test contrarian rules. The main caveat is sample bias: historical sentiment reflects the client base of the provider, and shifts in that base over time can distort results. Test on the pair and the timeframe you actually trade.
How does retail sentiment differ from institutional positioning tracked in COT reports?
Retail sentiment reflects the open positions of a broker's or aggregator's clients, refreshed continuously. The Commitments of Traders report breaks down futures positions by category (commercials, large speculators, small speculators), is released weekly with a three-day lag, and covers listed futures rather than spot. Retail and institutional positioning frequently disagree, and the divergence is often the most useful piece of information.
About the authors


Put this into practice
Related articles

Forex vs Stocks Trading: Key Differences for Retail Traders
A direct comparison of forex vs stocks trading for UK retail traders: hours, leverage caps, costs, tax treatment, and platform differences.

Geopolitical Risk Trading: What Trump’s War Policy Means for Your Positions
Learn how Trump's war policy affects forex, gold, and indices. A practical geopolitical risk trading guide for retail traders.

How to Evaluate a Prop Firm Before You Buy a Challenge
Learn how to evaluate a prop firm before buying a challenge. Use this due diligence framework to vet payouts, rules, and red flags.
0 comments