



Trading Strategies · Beginner · 14 min read
Price Action Trading Strategy: Read Charts Without Indicators
What Price Action Trading Actually Is
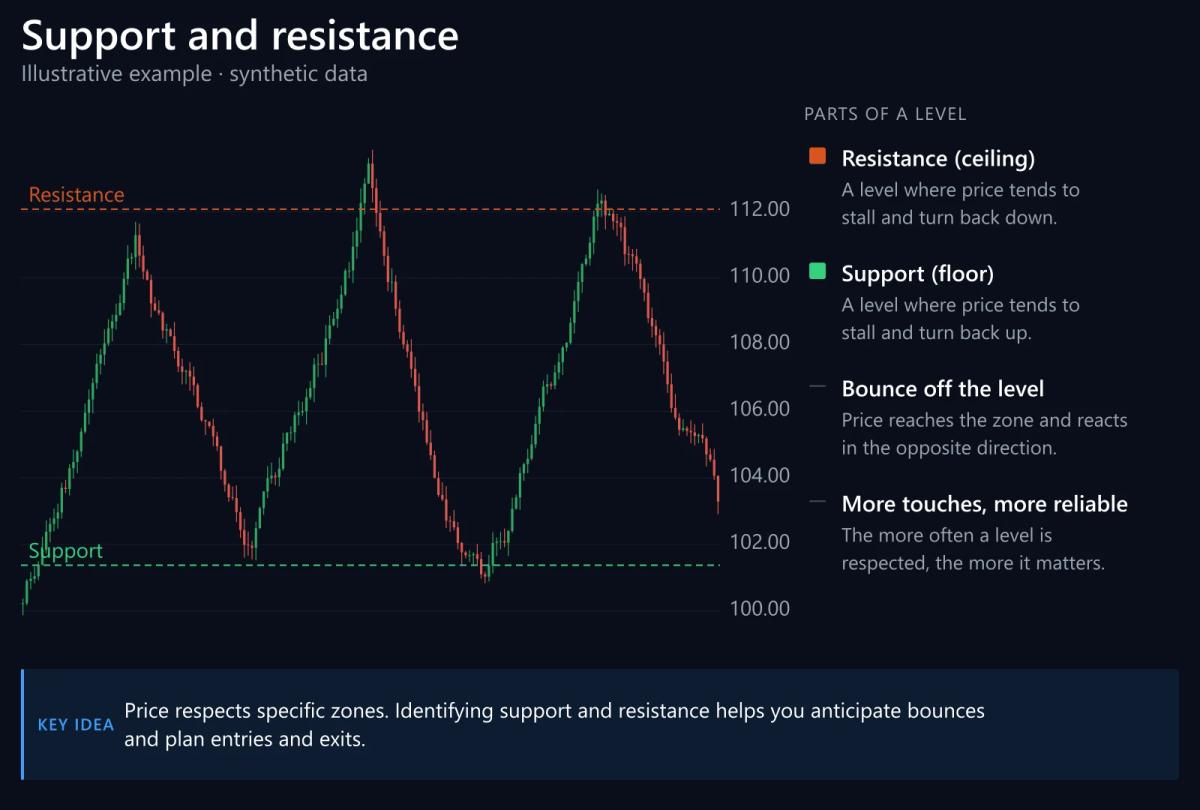
Price action trading means reading and trading directly from candlestick patterns, support and resistance levels, and chart structure without leaning on lagging technical indicators like moving averages or the Relative Strength Index (RSI).
You use only the four data points every candle records: the open, high, low, and close. Those four points capture where buyers and sellers have fought over the session and which side eventually walked away with the ground.
The underlying idea is simple: every indicator on your screen is a mathematical transformation of price, so the price itself is the least delayed signal you can read. Instead of waiting for a moving average to cross, you watch how the candle closes at a level you drew yourself. A candlestick (a bar that shows the open, high, low, and close for a set period) becomes your primary instrument. Everything else, from Bollinger Bands to stochastics, is optional context.
Where you choose to trade shapes results as much as the strategy itself, so it is worth comparing the best forex brokers and the conditions they offer before committing capital.
Core Price Action Patterns and What They Signal
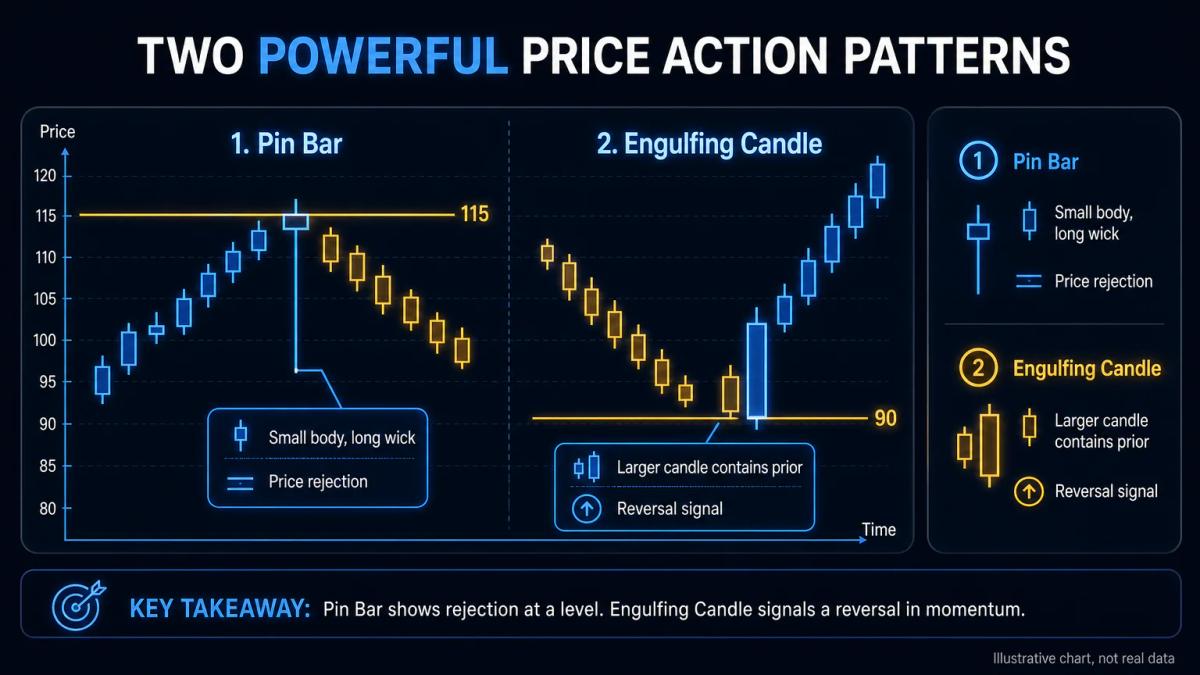
The most reliable price action patterns are pin bars, engulfing candles, inside bars, and swing highs and lows. Each one tells you where buyers and sellers rejected price and where a reversal or continuation is likely to form. You do not need dozens of patterns to trade well; you need four or five that you recognise instantly on any chart.
A pin bar is a candle with a small body and a long wick on one side, showing that price pushed into a level and got rejected. If the wick points down and the body sits near the top of the range, buyers absorbed the selling pressure and pushed price back up. A bearish pin bar is the mirror image: long upper wick, small body near the low, sellers winning.
Understanding bearish candlestick patterns helps you recognise rejection signals across different market conditions.
An engulfing candle is a two-candle pattern. The second candle's body fully covers the first candle's body in the opposite direction. A bullish engulfing candle appears after a downtrend: the previous red candle is completely swallowed by a larger green candle, signalling that buyers have taken control in a single session.
An inside bar is a candle whose entire range (high to low) sits inside the previous candle's range. It signals compression, a pause in the trend where the market is deciding its next move. Inside bars work best when they form after a strong directional candle; the breakout of that inside bar's high or low often triggers the next leg.
Learning how continuation and reversal patterns interact will deepen your ability to read these setups.
Swing highs and lows are the skeleton of every chart. A swing high is a candle whose high is above the highs of the candles immediately before and after it. A swing low is the opposite. Connecting recent swing highs and lows tells you whether the market is trending up (higher highs and higher lows), trending down, or ranging.
| Pattern | What it looks like | What it signals | Best used at |
|---|---|---|---|
| Pin bar | Small body, long wick on one side | Rejection of a level | Support or resistance |
| Bullish engulfing | Large green candle covers prior red body | Buyer takeover | End of a pullback in an uptrend |
| Bearish engulfing | Large red candle covers prior green body | Seller takeover | End of a rally in a downtrend |
| Inside bar | Candle range inside prior candle's range | Compression before breakout | After a strong directional move |
| Swing high or low | Local peak or trough on the chart | Structural pivot | Drawing support and resistance |
These patterns are best read as evidence rather than as commands, because their weight depends entirely on where they appear. A pin bar in the middle of a range carries little information, whereas the same pin bar printing at a support level that has already held twice before becomes a high-probability signal worth acting on.
Support and Resistance: The Foundation of Price Action
Support and resistance levels are price zones where buyers and sellers have historically stepped in to defend or break through.
In price action trading, you use these levels to identify where reversals are likely and where to place your stop loss and take profit orders. Without levels, a pin bar is just a candle; with levels, it becomes a location where a decision is being made. The principles of trendline trading apply here, as both rely on identifying and respecting key structural points.
You draw support and resistance by finding the swing highs and lows that price has respected multiple times. A level that has been touched three or four times without breaking is stronger than one touched only once. Treat these as zones, not exact prices: a support at 1.1000 on the EUR/USD is really a band from roughly 1.0990 to 1.1010, because market makers rarely respect a single decimal.
When price returns to a level, the disciplined approach is to wait for a candlestick signal that confirms the reaction before entering, which separates predicting from reacting. Predicting looks like buying at support in the hope that it holds, while reacting means buying only once a pin bar or bullish engulfing candle has actually printed there. The reactive entry gives up a slightly worse price in exchange for a considerably higher win rate, because you have let the market show you that buyers have arrived before you commit any capital.
Broken support often becomes resistance, and broken resistance often becomes support. Traders who bought at an old support and got trapped once it broke will sell into any retest of that level, converting it into a supply zone.
Why Timeframe Selection Shapes Your Price Action Trades
The timeframe you choose determines the noise level in your chart and the reliability of your signals.
Higher timeframes like the 4-hour or daily chart show cleaner price action with fewer false breakouts; lower timeframes like the 5-minute or 15-minute chart generate more trades but require tighter risk management and faster decisions. Different types of trading demand different timeframe approaches.
A daily pin bar reflects a full twenty-four hour battle between buyers and sellers, so it carries more weight than a five-minute pin bar formed during a quiet European lunch hour. That gap is a function of how many participants contributed to the candle rather than a question of opinion, and it scales predictably: the more traders whose orders shaped the range, the cleaner the signal and the lower the residual noise.
Multi-timeframe analysis fixes the problem of trading in a vacuum. You use the higher timeframe (daily) to define the trend and the key levels, then drop to the intermediate timeframe (4-hour or 1-hour) to find your entry. A common combination is daily for trend, 4-hour for setup, 1-hour for execution. You never take a 1-hour signal that fights a daily trend without an exceptional reason.
For beginners, the 4-hour chart is a sensible starting point. It gives you six candles per day, enough to learn without demanding constant screen time. Once you have proven a strategy on the 4-hour, you can decide whether to go higher for calmer trades or lower for more frequency.
Risk Management and Position Sizing in Price Action
Price action traders should size their positions from the distance between entry and stop loss rather than from account size alone. If your stop loss sits 50 pips (a pip is the smallest standard price move in a forex pair, usually the fourth decimal) away from entry and you risk 1% of your account per trade, you calculate the number of lots that keeps the potential loss at exactly that 1% threshold. Doing this arithmetic consistently is one of the clearest lines between traders who survive their first year and traders who blow their accounts.
In price action, the stop loss is placed according to what the pattern itself tells you rather than at a fixed distance decided in advance. If you buy on a bullish pin bar at support, your stop belongs just below the low of the pin bar, plus a small buffer of five to ten pips to absorb spread and noise. Whatever distance that produces becomes your risk for the trade, and every other variable, from position size to target, is set to fit around it.
Here is the calculation for a $10,000 account risking 1% per trade on EUR/USD, where one standard lot is 100,000 units and each pip is worth roughly $10:
| Stop distance | 1% risk in dollars | Position size (standard lots) |
|---|---|---|
| 20 pips | $100 | 0.50 lot |
| 50 pips | $100 | 0.20 lot |
| 100 pips | $100 | 0.10 lot |
| 200 pips | $100 | 0.05 lot |
Notice that a wider stop forces a smaller position, keeping the dollar risk constant. Beginners often do the opposite: they use the same lot size on every trade and let the stop distance dictate the loss, which is how one bad session wipes out weeks of gains.
For UK retail clients, the Financial Conduct Authority (FCA) caps leverage at 30:1 on major forex pairs, 20:1 on major indices, and 5:1 on individual equities. The FCA also prohibits CFDs on crypto for UK retail. These caps limit how large a position you can open on a given deposit, which in practice protects your position sizing arithmetic from your own optimism.
FCA: UK retail leverage is limited to 30:1 on major forex pairs, 20:1 on major indices and 5:1 on single equities, and CFDs on cryptoassets are prohibited for retail clients.
The target reward-to-risk ratio for a price action trade is at least 2:1. If you risk 50 pips, you aim for at least 100 pips of profit. This means you can lose more trades than you win and still be profitable, which is essential because no pattern wins more than roughly 60% of the time in a real market.
Backtesting and Validating Your Price Action Strategy
Before risking real money, you should backtest your price action rules on historical price data to see how often your patterns win and lose. Backtesting reveals your win rate, average win size, average loss size, and whether your strategy is actually profitable or only feels right in hindsight. Most retail traders skip this step, then blame the market when the strategy fails live.
A usable backtest needs a rulebook before you look at any chart. Write down, in one page: which pair, which timeframe, which pattern qualifies as a signal, what makes a valid support or resistance level, where your stop goes, where your target goes, and any filter you apply (like time of day or trend direction on a higher timeframe). Ambiguity in the rulebook produces ambiguity in the results.
With the rulebook fixed, you scroll back on the chart bar by bar, or use a bar-replay feature in your platform, and mark every setup that matches your rules. You record each trade in a spreadsheet: date, pattern, entry, stop, target, outcome, and pips won or lost. A minimum sample is 100 trades; anything less and your results are noise.
| Metric | What it tells you | Healthy range for price action |
|---|---|---|
| Win rate | Percentage of trades that hit target | 40% to 60% |
| Average reward-to-risk | Average win divided by average loss | 1.5 to 3.0 |
| Expectancy per trade | Average pips or dollars per trade | Positive, above transaction costs |
| Max drawdown | Largest peak-to-trough equity fall | Below 20% of account |
| Longest losing streak | Consecutive losses in the sample | Note for psychological preparation |
Expectancy is the single most important number in the whole exercise. It is calculated as (win rate x average win) minus (loss rate x average loss). If your win rate is 45%, your average win is 100 pips, and your average loss is 50 pips, your expectancy works out at (0.45 x 100) minus (0.55 x 50), which equals 17.5 pips per trade before costs. A positive expectancy that survives spreads and commissions is the clearest evidence that your strategy has an edge.
Drawdown (the fall from a capital peak to the trough before a new peak) is the metric that decides whether you can psychologically trade the system. A backtest showing a 40% drawdown looks fine on paper; in live trading, you will abandon the system before it recovers. Design for a drawdown you can actually tolerate, typically below 20% of the account.
Forward testing on a demo account for at least a month is the honest final step. Historical data tells you the past; a demo run tells you whether you can execute the rules under conditions closer to live pricing, including slippage and platform delays.
Volume Confirmation and Emotional Discipline
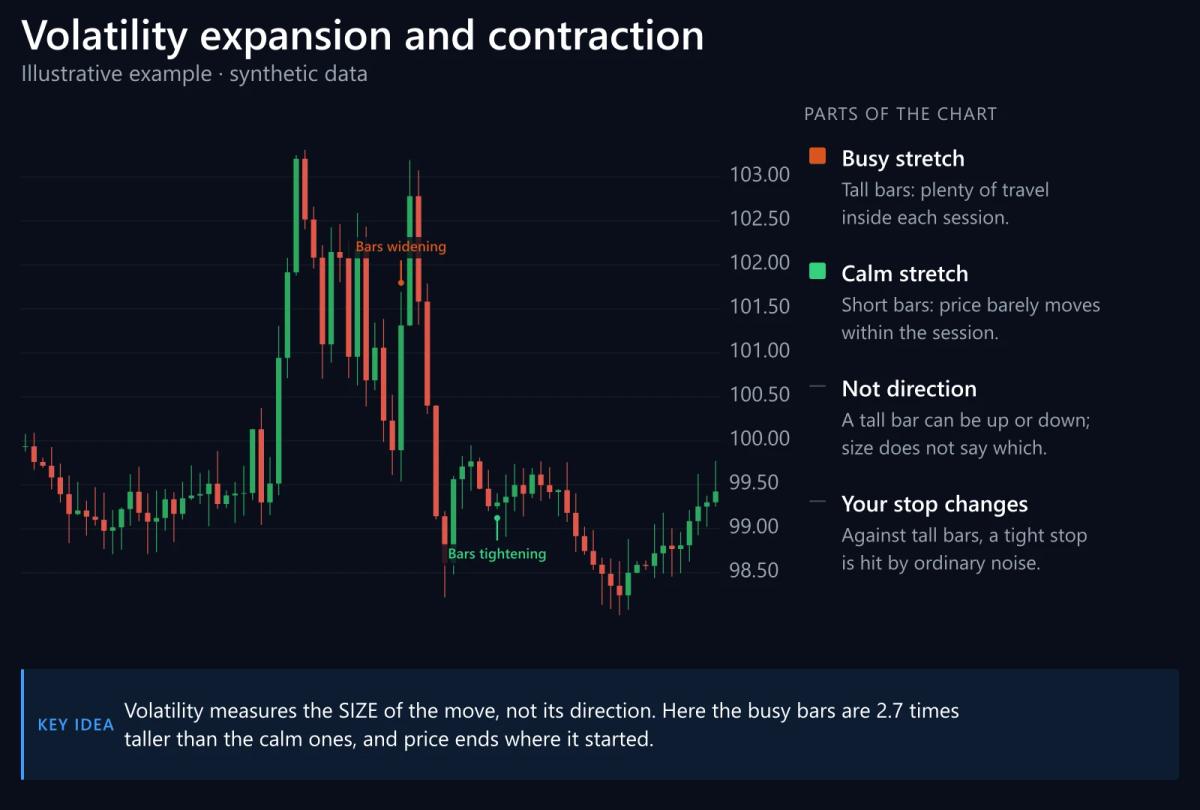
Price action signals gain their strongest confirmation when volume spikes at support or resistance, since a jump in participation is what tells you that real buying or selling pressure has entered the level. A pin bar printed on heavy volume suggests that a broad set of participants agreed the level was worth defending, while the same pin bar on thin volume tends to be a fake-out that reverses within hours.
On stock and futures charts, volume comes as a native data point, whereas on spot forex you fall back on tick volume as an approximation, because no centralised volume feed exists for the market.
Tick volume counts the number of price changes per candle rather than the number of contracts traded, which makes it imperfect, though it correlates well with true volume on major forex pairs during liquid hours. What you are looking for is volume expansion on the signal candle followed by volume contraction on the pullback that comes after, since expansion tends to confirm that the underlying move is real while contraction on the pullback suggests it is unfolding in a healthy way.
Emotional discipline is what allows the whole system to function in practice. The urge to trade every pattern is the largest single reason retail traders lose money over time, and recognising that urge for what it is takes conscious effort. A pin bar sitting in the middle of a range, with no volume behind it, no level nearby, and no supporting context on the higher timeframe, is bait rather than a trade. Skipping such a setup often feels wrong, and that discomfort is precisely because the brain has been trained through hours of screen time to act rather than to sit on its hands.
Understanding how many trades per day you should make is essential to building discipline.
The fixes for these problems tend to be structural in nature rather than a question of willpower or motivation. Keep a trade journal with a screenshot and a written reason for every entry and every skip you take. Set a maximum number of trades per week, since two or three high-quality setups on the 4-hour will comfortably outperform fifteen mediocre ones on the 5-minute over any reasonable stretch of time. After two consecutive losses in a single day, walk away from the screen, because revenge trading, the impulse to win it back immediately, destroys more accounts than bad strategies ever have.
Getting Started: A Simple Price Action Trading Plan
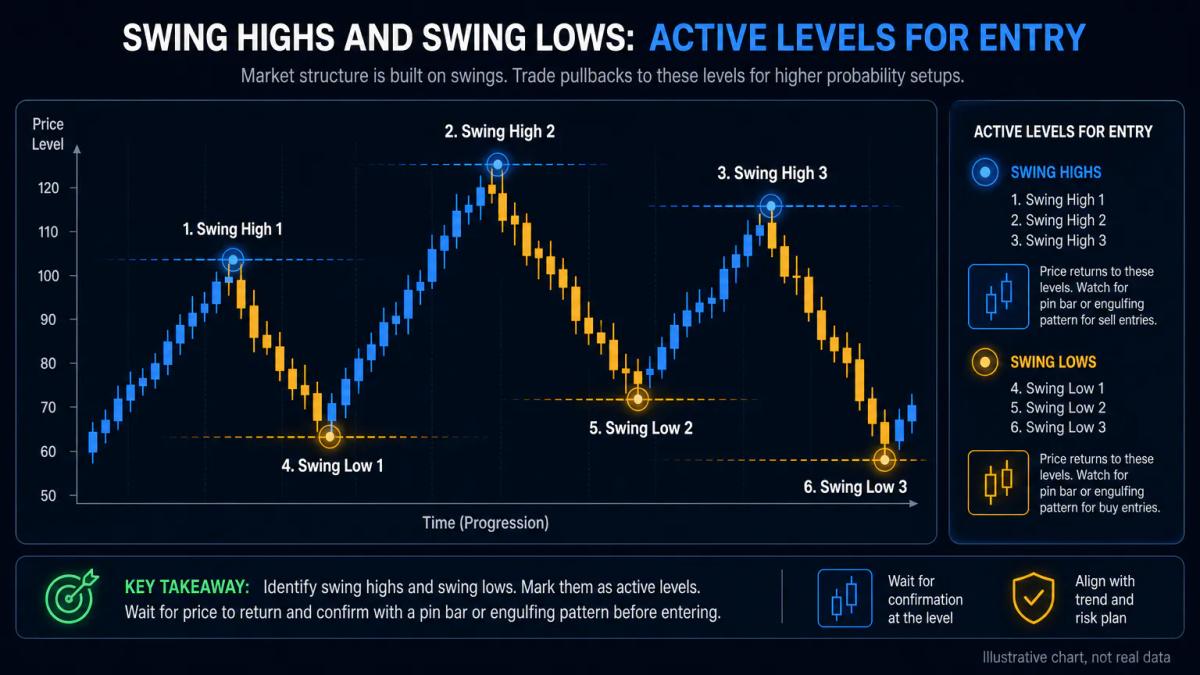
Start by choosing one currency pair or index on the 4-hour timeframe. EUR/USD is the sensible default because it has the tightest spreads and the deepest liquidity. Mark the last three swing highs and the last three swing lows on your chart. Those six points are your active levels for the week.
Wait for price to return to one of those levels and print a pin bar or engulfing candle. Place your stop loss ten pips beyond the pattern's extreme and your take profit at the next opposing level, checking that the reward-to-risk ratio is at least 2:1. Confirm with a volume spike on the signal candle. If any of the four conditions is missing (level, pattern, ratio, volume), you skip the trade.
A sample beginner rulebook fits on one page:
| Element | Rule |
|---|---|
| Instrument | EUR/USD only |
| Timeframe | 4-hour for entry, daily for trend |
| Setup | Pin bar or engulfing candle at a marked swing level |
| Stop | 10 pips beyond the pattern extreme |
| Target | Next opposing swing level, minimum 2:1 reward-to-risk |
| Risk per trade | 1% of account balance |
| Volume filter | Signal candle above the last 20 candles' average volume |
| Maximum trades | 3 per week |
Before your first live trade, sit through a full month on a demo account executing the same rulebook. Record every trade. If your expectancy is positive after 30 trades and you followed the rules on at least 90% of setups, you are ready to go live at the smallest position size your broker allows. Scale up only after another 30 live trades confirm the demo result. Skipping this progression is the single fastest way to lose an account.
Frequently Asked Questions
What is the difference between price action trading and indicator-based trading?
Price action trading reads price directly from the chart: candlestick patterns, support and resistance, and swing structure. Indicator-based trading applies mathematical formulas to price (moving averages, RSI, MACD) and trades the output. Every indicator lags the price it is calculated from, so price action removes that delay. The trade-off is that price action is more discretionary and requires practice to see the same setups consistently, while indicators produce mechanical, easily coded signals.
Can you make money trading price action patterns alone, or do you need other confirmation signals?
You can trade profitably using patterns alone if they form at meaningful levels and your risk management is solid, but most consistent price action traders add at least one filter. Volume confirmation, higher-timeframe trend alignment, and a minimum 2:1 reward-to-risk ratio are the three most common filters. Patterns without context (a pin bar in the middle of a range, no level, no volume) win roughly at random. Patterns with context and filters win at rates high enough to be profitable after spreads.
What is the best timeframe for price action trading: 5-minute, hourly, or daily?
The 4-hour chart is the best starting point for most beginners because it produces cleaner signals than intraday timeframes and fewer trades than the daily. The 5-minute chart generates constant setups but the signal-to-noise ratio is poor, and spreads eat a large share of the small pip targets. The daily chart is the most reliable but demands patience, with maybe two or three trades per pair per month. Serious traders combine timeframes: daily for trend, 4-hour or 1-hour for entry.
How do you avoid false breakouts and whipsaws in price action trading?
False breakouts happen when price briefly pierces a level and reverses. You avoid them by waiting for a candle to close beyond the level, not just wick through it, and by checking volume: a genuine breakout usually shows expanding volume on the breakout candle. Trading breakouts on higher timeframes (4-hour and above) further reduces whipsaws, since a full 4-hour close beyond a level is much harder to fake than a 5-minute close. If in doubt, wait for a retest of the broken level and take the entry there.
What is the most common mistake retail traders make when learning price action?
Overtrading is the single most common mistake. Beginners learn a handful of patterns and then see them everywhere, taking every pin bar and every engulfing candle regardless of location, trend, or volume. The fix is a written rulebook with a maximum number of trades per week and a mandatory checklist for every entry: named level, valid pattern, minimum 2:1 reward-to-risk, and volume confirmation. If any item on the checklist is missing, the trade is skipped, no matter how attractive the pattern looks in isolation.
About the authors


Put this into practice
Brokers we have reviewed
Scored on the same five dimensions. Here are three of them — the full list is on the brokers page.



Related articles
Quantitative Trading Explained: Strategies, Methods, and How It Differs from Algo Trading
Quantitative trading explained: how it differs from algorithmic trading, core quant strategies, and how retail traders can get started.

Trendline Trading Strategy: How to Trade Breaks and Bounces
How to trade trendline bounces and breaks with clear entry rules, stop placement and confluence checks across forex, indices and equities.

Types of Trading Explained: Day Trading, Swing Trading and Scalping
A plain-English guide to the three main types of trading: day trading, swing trading and scalping, with the capital, leverage and discipline each one demands.
0 comments