



Trading Strategies · Beginner · 14 min read
Trendline Trading Strategy: How to Trade Breaks and Bounces
The core mechanism: how trendlines signal entry and exit points
A trendline trading strategy uses a line drawn across two or more price points to identify support or resistance, and you trade either when price bounces off that line (continuation) or closes decisively through it (reversal). The line becomes tradable because repeated touches show that buyers and sellers keep agreeing to defend it, which turns it into a high-probability decision zone.
Understanding the difference between continuation vs. reversal patterns helps you recognise which type of setup you are facing.
Think of the line as a shorthand for crowd behaviour. Each time price approaches a rising trendline in an uptrend and buyers step in again, they leave a footprint: a higher low. The more footprints, the stronger the memory. When the line finally fails, it is because the balance has shifted: buyers no longer show up in size at that level, and the market needs a new reference point. That transition is what makes the break tradable.
A support level (a price zone where buying pressure has repeatedly stopped a fall) and a resistance level (the mirror image on the way up) are the horizontal cousins of trendlines. A trendline is simply a diagonal version of the same idea, adapted to a market that is trending rather than ranging. This matters for entries: on a bounce, you are trading the assumption that the trend continues; on a break, you are trading the assumption that the trend has ended, or at least paused long enough for a counter-move to pay.
The rest of this guide walks you through drawing the line, taking the two trade types, sizing risk, stacking confluence, and recognising the setups where trendline trading quietly stops working. The mechanics themselves are straightforward enough to learn in an afternoon, whereas the discipline to apply them consistently across dozens of trades is what separates profitable trendline traders from the rest.
Where you choose to trade will shape your results as much as the strategy itself; see the best forex brokers and their conditions.
Drawing trendlines correctly: the foundation of any trade
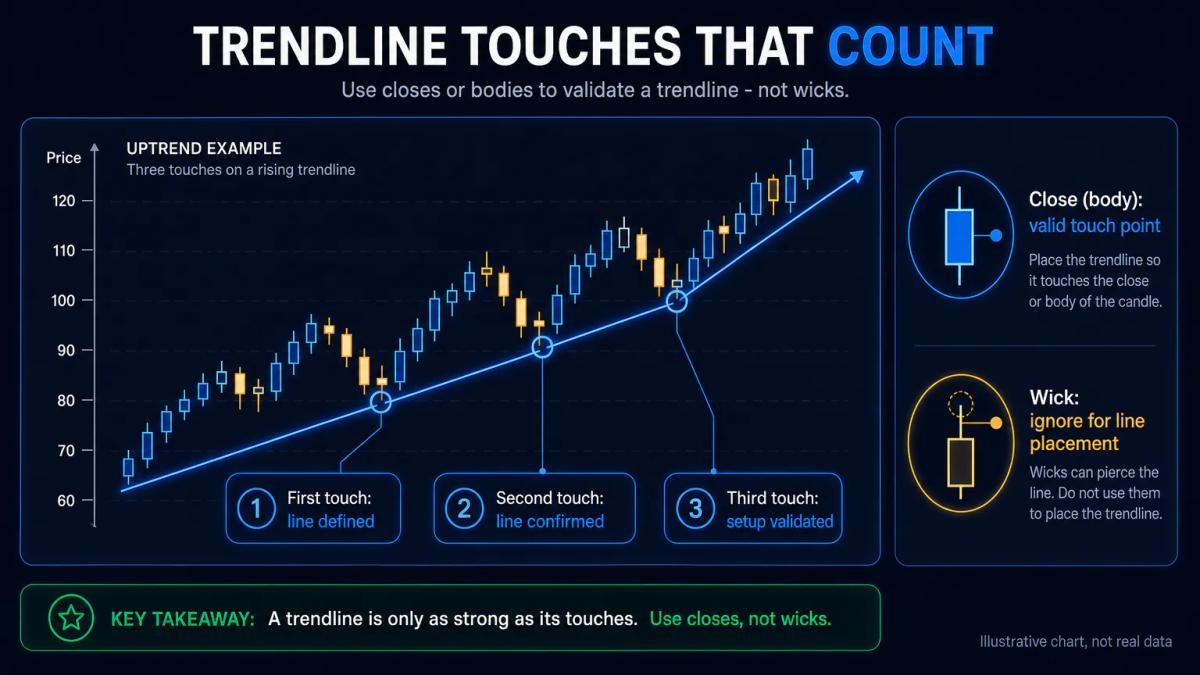
A valid trendline needs at least two confirmed price touches, and ideally a third to validate the line before you trade from it. In an uptrend you connect higher lows, whereas in a downtrend you connect lower highs, so the first two points define the geometry of the line while the third confirms that participants are actually respecting it. Trading from an unconfirmed two-point line tends to be weaker, and it is where many beginners lose money to lines that were never really there in the first place.
Forcing the line through wicks or one-off spikes usually produces a drawing that looks tidy but has no predictive value. A wick is the thin part of a candle that shows the extreme price reached during the period, whereas a body is the thick part between open and close.
In liquid markets, closes carry more weight than wicks because closes represent where the market genuinely agreed to settle, while wicks often mark liquidity grabs that were immediately rejected by the order flow. As a working rule, draw across candle bodies or the cluster of swing points, allowing one or two wicks to poke through provided the closes still respect the line.
Angle deserves attention as well:
- A rising trendline steeper than roughly 60 degrees on your chart is usually unsustainable, because it reflects a burst of momentum rather than a durable trend and tends to break early.
- A very shallow line, under 20 degrees, often reveals a market that is drifting sideways with only a slight directional bias and is not really trending in any tradable sense.
The sweet spot for most instruments sits between those extremes, where each successive touch gives price enough time to breathe before returning to the line.
| Element | What to check | Common error |
|---|---|---|
| Number of touches | 2 to draw, 3 to confirm | Trading a 2-touch line as if confirmed |
| Anchor points | Candle bodies or clear swing highs/lows | Forcing through wicks to make it fit |
| Angle | Roughly 20 to 60 degrees | Too steep breaks fast, too flat is noise |
| Timeframe | Match the line to the trade horizon | Drawing on 5-minute for a swing trade |
Trading the bounce: continuation entries when price respects support
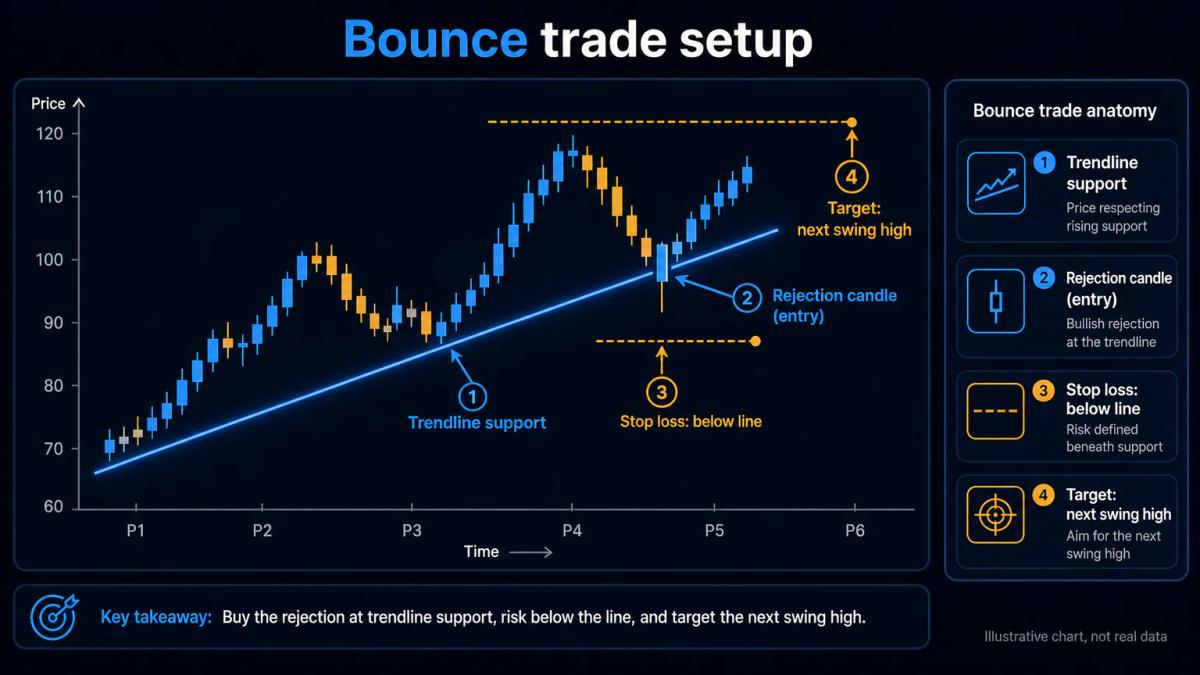
A bounce trade enters when price touches the trendline and shows rejection without breaking through it, meaning a reversal candle such as a hammer, a bullish engulfing pattern, or simply a clear higher low forming on the timeframe you trade. The underlying bet is that the trend continues and that the line behaves like a magnet price keeps returning to, which is what gives the setup its edge in trending conditions. Your stop loss sits just beyond the line, and your target is the next swing high in an uptrend, or the next swing low in a downtrend.
The practical sequence on an uptrend usually unfolds in a predictable order.
- Price pulls back toward the rising trendline, and you wait for a candle to close showing rejection, whether that is a long lower wick, a close near the high, or an engulfing bar that swallows the prior red candle.
- You then enter on the next candle open, place a stop a small buffer below the line to account for normal noise on that instrument, and set the target at the previous swing high.
Provided that target sits at least twice the distance of your stop the trade is worth taking, and if the reward-to-risk falls short of that ratio the setup is better skipped.
A bullish engulfing pattern is a two-candle signal where a green candle's body fully covers the previous red candle's body, showing that buyers overwhelmed sellers in a single session. It is one of the more reliable confirmation candles on a trendline touch because it prints a clear transfer of control at exactly the price zone you were watching for a reaction.
Learning to identify bearish candlestick patterns and their bullish counterparts strengthens your ability to spot these reversals as they form.
Without a confirmation candle, a touch amounts to little more than a hypothesis, and waiting one candle costs a few pips of entry price while eliminating a large share of losing bounce trades.
Trading the break: reversal entries when price closes decisively through the line
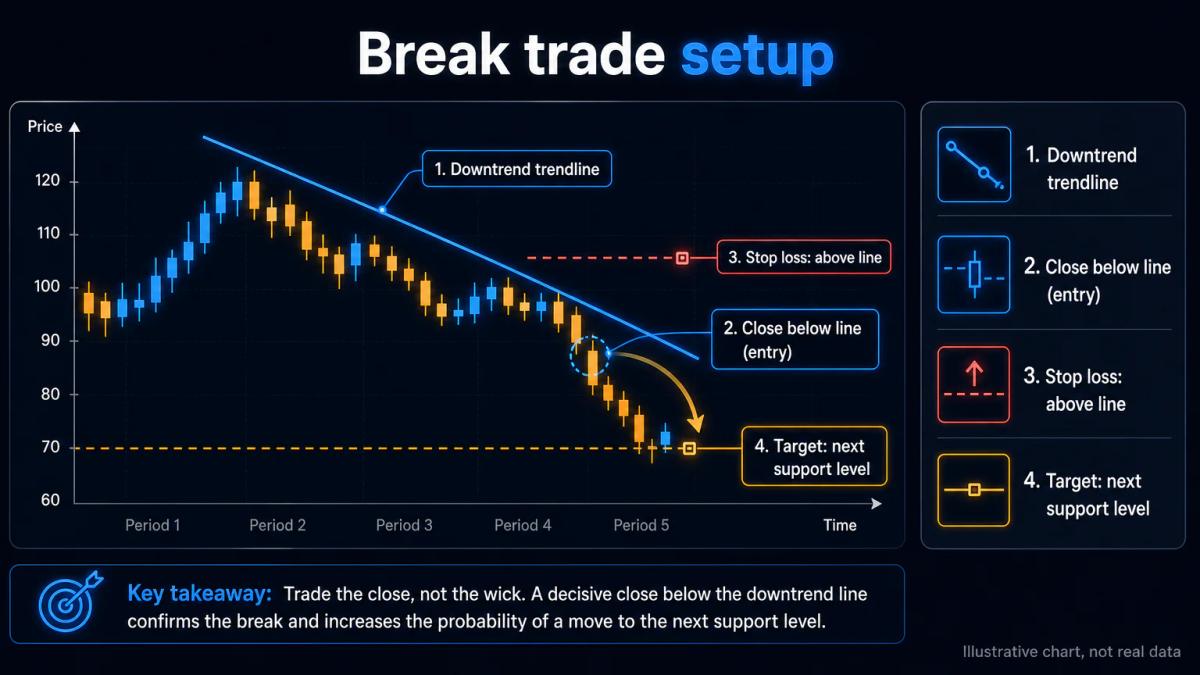
A break trade enters after price closes beyond the trendline with momentum, signalling that the trend has weakened enough for a counter-move to pay. On an uptrend line that finally gives way, you sell the break; on a downtrend line that cracks, you buy. The stop goes on the other side of the broken line, and the target is the next horizontal support or resistance level, or the next visible swing point in the new direction.
The word 'closes' is doing a lot of work in that definition. A wick that pokes through the line and then pulls back is best read as a test of the level rather than a genuine break, whereas a body that closes clearly beyond the line, especially on the timeframe that produced the trendline in the first place, is what qualifies as an actual break. Traders who enter on the wick tend to get stopped out repeatedly, because markets routinely spike through lines to trigger stops before reversing back into the range. Learning to wait for the candle to close is one of the simplest adjustments that turns a losing break strategy into a viable one over a large sample of trades.
Momentum confirmation strengthens the signal. Volume (the number of contracts or shares traded during that candle) is useful on stocks and futures where exchange volume is real; in decentralised forex, tick volume from your broker is a rougher proxy but still directional.
Understanding Chaikin Volatility Indicator expansion and contraction signals helps you gauge whether volume is truly backing the move. A
break candle that closes with a large body and higher-than-average volume behind it is more trustworthy than a break candle with a small body and thin trade behind it.
| Element | Bounce trade | Break trade |
|---|---|---|
| Setup | Price touches line and rejects | Price closes decisively through line |
| Entry | Next candle after confirmation | Next candle after close beyond line |
| Stop loss | Just beyond the line | Just beyond the broken line |
| Target | Next swing in trend direction | Next support/resistance opposite |
| Assumption | Trend continues | Trend has reversed or paused |
Risk management and stop-loss placement with trendlines
Stop losses in a trendline strategy live just beyond the line itself.
- For a bounce trade the stop sits below the line on a long, because if price closes through it the setup has already failed by its own internal logic.
- For a break trade the stop sits back above the broken line, because a close back above would mean the reversal never confirmed and you are on the wrong side of a fake-out.
Since the line defines the trade thesis in the first place, it is the natural place to locate the point at which the thesis is disproven.
Adding a small buffer to the stop for the instrument's normal noise is usually wise. On EUR/USD on a 4-hour chart, a few pips beyond the line is generally enough to filter routine wicks. A pip is the standard smallest price move in a currency pair, typically 0.0001 for most majors, and on a volatile stock or a commodity like crude oil the buffer needs to be considerably wider, often calculated from the average true range (ATR), a measure of how far price typically moves within a single period. A stop placed exactly on the line will regularly be triggered by ordinary market noise before the setup has had a chance to play out.
Position size follows from the stop distance rather than from a fixed lot count. If your account is $10,000 and you accept a maximum risk of 1% per trade, that works out to $100 of risk on the setup.
Should the distance from entry to stop be 20 pips on EUR/USD, your position size is calibrated so that those 20 pips equal $100 of exposure. According to the FCA, the majority of retail CFD accounts lose money, and undersized stops paired with oversized positions come up repeatedly as a driver of those losses. Sizing consistently from the stop distance, in preference to trading larger because the account balance allows it, is the habit that keeps a trendline strategy alive across the losing streaks that every approach eventually goes through.
Confluence and timeframe selection: raising your probability
Confluence describes the situation where a trendline aligns with at least one other technical reason to expect a reaction at that price. A rising trendline that meets the 200-day moving average, or a falling trendline that intersects a previous swing high, is considerably more likely to hold or produce a clean break than a lone line sitting in empty space. Stacking two or three confluent factors together lifts the probability of a clean reaction materially, whereas trading isolated lines with no supporting evidence amounts to betting on the drawing itself rather than on any structural feature of the market.
Common confluent factors are horizontal support or resistance from prior swings, moving averages (the 50, 100 and 200 period lines are watched by enough participants to be self-fulfilling), round numbers on price (1.1000 on EUR/USD, 4,000 on the S&P 500 index), and Fibonacci retracement levels drawn from the last leg of the trend.
A Fibonacci retracement is a set of horizontal levels at fixed percentages (38.2%, 50%, 61.8%) of a prior move, used to anticipate where a pullback might end.
Timeframe selection sets the tempo of the whole approach. Longer timeframes produce cleaner lines, so a daily chart trendline with three touches over four months is a serious level watched by many participants and tends to produce fewer false breaks.
Shorter timeframes generate more setups at the cost of considerably more noise around each one. As a working rule, draw your trendline on the timeframe one step above your trade horizon: if you swing trade on the 4-hour, draw on the daily, and if you day trade on the 15-minute, draw on the 1-hour instead.
Trendline trading across asset classes and market conditions
Trendlines work across forex, indices, equities and commodities, but their reliability varies with liquidity and participant mix.
- Major forex pairs (EUR/USD, GBP/USD, USD/JPY) and large-cap indices (the S&P 500, the FTSE 100) produce cleaner lines because they are watched by enough participants to make the level self-reinforcing.
- Small-cap stocks and thin commodities generate noisier action where lines are broken and reclaimed inside the same session.
Market regime carries more weight than the specific instrument in most trendline setups.
- In a strong bull market, bounce trades off rising trendlines are favoured because the higher-timeframe bias is doing the work for you, with shallow pullbacks, quick confirmations and targets that get hit relatively cleanly.
- In a bear market, break trades below falling support lines tend to travel further because sellers dominate and rallies are consistently sold into. In sideways or choppy markets, both bounce and break setups produce false signals thanks to the absence of any dominant flow that could carry the trade toward its target.
Knowing the best time to trade forex and other assets helps you identify when conditions actually favour trendline setups, and the more sensible response to a choppy chart is often to leave its trendlines alone entirely, sitting out until the range resolves and a new trend defines fresh lines to work with.
Frequently Asked Questions
How many price touches do you need to draw a valid trendline?
Two touches are the minimum needed to draw a trendline, since two points define any line. A third touch confirms it and turns the line into a tradable level. Trading a two-touch line is possible but weaker: reduce your position size or wait for the third touch before treating the line as a serious support or resistance level.
What is the difference between trading a trendline bounce and a trendline break?
A bounce trade assumes the trend continues: you enter on rejection at the line and target the next swing in the trend direction. A break trade assumes the trend has ended or paused: you enter after a decisive close beyond the line and target the next level in the opposite direction. Bounce trades suit bull markets on rising lines and bear markets on falling lines; break trades suit turning markets.
How do you know if a trendline break is real or just a false break?
A real break shows a candle close clearly beyond the line on the timeframe that produced the trendline, usually with an above-average candle body and volume behind it. A false break is a wick that pokes through and reverses inside the same or the next candle. Waiting for the candle to close before entering eliminates most false breaks at the cost of a few pips of entry price.
Should you trade trendlines on all timeframes, or are some better than others?
Longer timeframes such as the daily and 4-hour produce more reliable trendlines because they are watched by more participants and generate fewer false breaks. Shorter timeframes such as the 15-minute and 1-hour produce more setups but with much higher noise. A common approach is to draw the line one timeframe above your trade horizon and take entries on the lower timeframe.
What should you do if price breaks your trendline but then reverses back above it?
That pattern is a failed break or bull trap (or bear trap in reverse), and it usually means the original trend is stronger than the break signal suggested. If you were short the break, exit at your stop above the line as planned. Do not immediately flip long: wait for a fresh confirmation, such as a new higher low above the reclaimed line, before treating the trend as intact again.
About the authors


Put this into practice
Brokers we have reviewed
Scored on the same five dimensions. Here are three of them — the full list is on the brokers page.



Related articles

Types of Trading Explained: Day Trading, Swing Trading and Scalping
A plain-English guide to the three main types of trading: day trading, swing trading and scalping, with the capital, leverage and discipline each one demands.
Copy Trading vs Algo Trading: Which Has the Better Risk Profile?
Discover how copy trading and algo trading differ in risk profile, who controls the risk, and which approach suits your trading style.

5 Trading Strategies That Work Across Multiple Asset Classes
Discover trading strategies that work across forex, stocks, indices, and commodities; with clear guidance on how to adapt each one.
0 comments