Which Asset Classes Perform Best During Rate Hiking Cycles?
Rate hiking cycles reshape the investment landscape, and not all asset classes respond the same way. Understanding how equities, bonds, commodities, forex, and real estate have historically behaved during periods of rising rates gives you a more informed framework for thinking about your portfolio. This article draws on the historical record to describe those patterns, with appropriate caveats about where they hold and where they break down.
This article is for informational purposes only and does not constitute financial advice. All historical performance patterns involve significant uncertainty and should not be used in isolation to make investment decisions.
What Counts as a Rate Hiking Cycle?
Defining the cycle
A rate hiking cycle is a sustained period during which a central bank raises its benchmark interest rate multiple times in response to inflationary pressure or economic overheating. In the US context, this means the Federal Reserve raising the Federal Funds Rate in a series of consecutive or closely spaced increases.
The cycle typically has three identifiable stages:
- Pre-hike signalling: the central bank communicates that rate increases are coming, often affecting markets before the first hike occurs
- Active hiking: a period of incremental rate increases, sometimes at a defined cadence
- Plateau and pivot: the rate stabilises at the terminal level before eventual cuts begin
The effects on asset classes are not uniform across these stages. Markets often react most dramatically during the signalling phase. By the time hikes are actually happening, a significant part of the repricing may already be complete.
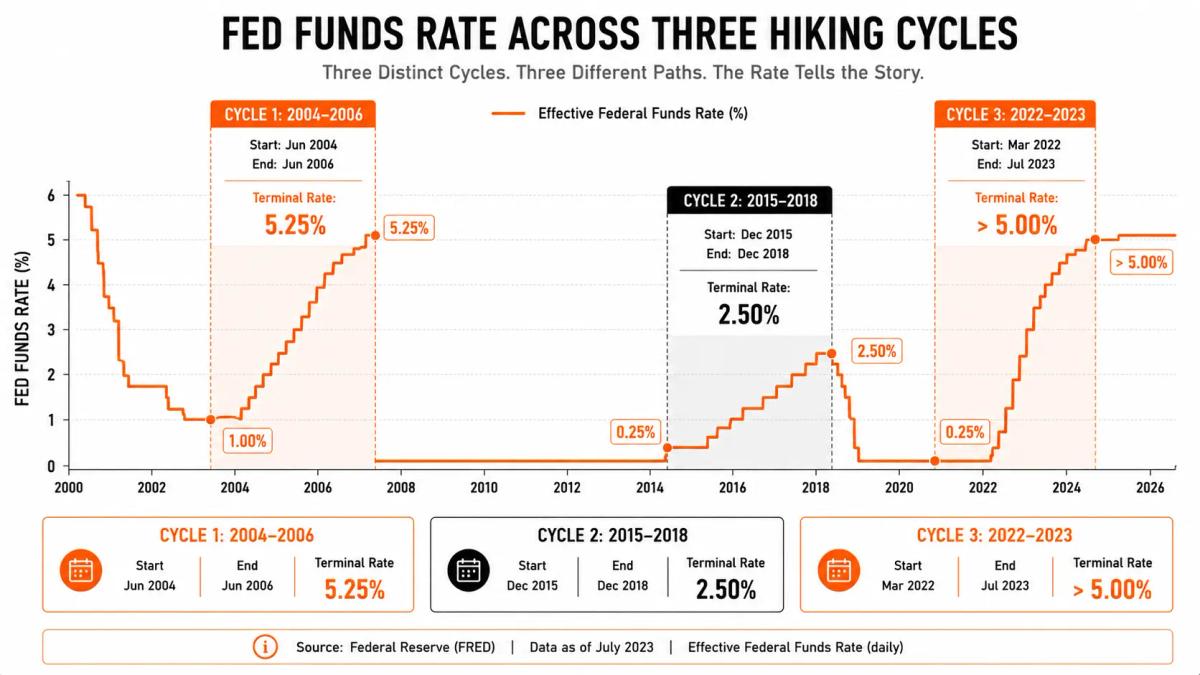
Key historical cycles (2004–2006, 2015–2018, post-2022)
Three recent US hiking cycles provide the most analysed reference points.
2004–2006: The Fed raised rates from 1.0% to 5.25% across 17 consecutive increases. The economy was growing, corporate earnings were strong, and the hiking cycle coincided with generally positive equity performance, particularly in financials and energy. This cycle is often cited as evidence that rate hikes do not automatically produce equity bear markets.
2015–2018: A more gradual cycle that began after years of near-zero rates. The Fed moved slowly, with nine rate increases over three years, ending at 2.25–2.50%. This cycle is notable for its limited market disruption, partly because of its pace and partly because global growth was supportive throughout most of the period.
2022–2023: The fastest hiking cycle in four decades. The Fed raised rates from near zero to above 5% in roughly 16 months in response to inflation that reached multi-decade highs. This cycle produced significant bond losses, a meaningful equity drawdown (particularly in high-multiple growth stocks), and notable US dollar strength. It is the most recent and most severe example in this dataset.
Each cycle had different starting conditions, different paces, and different terminal rates, which is precisely why broad characterisations need to be treated carefully.
Why Rate Hikes Affect Asset Classes Differently
Discount rate mechanism and equity valuations
Interest rates affect equity valuations through the discount rate used in valuation models. Future earnings and cash flows are worth less in present-value terms when the discount rate is higher. This effect is strongest for companies whose value is disproportionately weighted toward distant future earnings, including growth stocks in technology and unprofitable companies with long payback horizons.
Value stocks, financials, and companies with near-term earnings streams are less exposed to this discount rate mechanism and may actually benefit from rate hikes, as banks earn more on their lending margins when rates rise.
Bond price dynamics during rising rates
The relationship between interest rates and bond prices is one of the most mechanically certain in finance: when rates rise, existing bond prices fall. The longer the bond's duration, the larger the price decline for a given rate increase.
A bond paying a fixed 2% coupon becomes less attractive when new bonds are issued at 4%. Its market price falls until its effective yield matches the prevailing rate. For long-duration bonds (20 to 30-year instruments) the price sensitivity is substantial. For short-duration instruments (three to six months) it is minimal.
Commodities, inflation, and the rate hike relationship
Rate hikes are typically a response to inflation. Commodities, as real assets, often benefit from the same inflationary environment that triggers hiking cycles, which is why commodity performance during hikes is more complex than it might initially appear.
Aggressive rate hikes that successfully reduce inflation can dampen commodity demand, particularly for industrial metals sensitive to economic growth. Energy commodities tend to be less responsive to rate policy and more responsive to supply-side factors.
Forex: rate differentials and currency strength
In currency markets, interest rate differentials are one of the most significant drivers of capital flows. When the Federal Reserve raises rates faster or higher than other central banks, the US dollar tends to attract capital seeking higher yields, pushing it higher against currencies where rates remain lower.
Currency movements also reflect relative economic strength, current account dynamics, inflation differentials, and positioning. A hiking cycle perceived as overdone or likely to trigger recession can reverse dollar strength even before cuts begin.
Asset Class Performance: What the Historical Record Shows
Equities: which sectors hold up and which do not
The claim that rate hikes are uniformly bad for equities is an oversimplification. Looking across the three cycles described above:
Sectors that have historically held up better during rate hikes:
- Financials, particularly banks, which benefit from wider net interest margins as deposit rates lag lending rates
- Energy, typically in early hiking cycles when inflation is commodity-driven
- Healthcare, which has defensive characteristics and is relatively insensitive to rate movements
- Consumer staples, similarly defensive, with earnings streams less affected by discount rate changes
Sectors that have historically underperformed:
- Long-duration growth, particularly unprofitable technology companies with valuations dependent on distant future earnings
- Utilities, often seen as bond proxies, which fall as bond yields rise
- Real estate stocks, where higher financing costs reduce property valuations and REIT distributions
The 2022–2023 cycle illustrated this pattern sharply, with growth and technology stocks declining significantly while energy and financial sectors were among the stronger performers.
Bonds: the consistent underperformer, with caveats
Bonds are the asset class most directly and mechanically affected by rate hikes. Long-duration government bonds experienced some of their worst historical returns during the 2022 hiking cycle, a period notable for simultaneously high inflation and rising rates, which removed both price value and inflation-adjusted income.
The caveat is timing. Buying bonds after significant rate increases means buying higher yields and facing a different return profile than someone who held through the hike cycle. Bonds can be a poor investment during a hiking cycle and become attractive again as rates approach their peak or begin to fall.
Short-duration bonds and treasury bills are relatively insulated. Their prices do not fall much, and maturing proceeds can be reinvested at progressively higher rates.
Commodities: the nuanced case (energy vs. metals vs. agriculture)
Commodities do not move as a unified block during rate hikes:
- Energy (oil, natural gas): Performance tends to track the inflation narrative more than the rate response. If hikes are triggered by an energy price shock, as in 2022, energy commodities may continue to perform well into the hiking cycle.
- Industrial metals (copper, aluminium): These track economic growth expectations. If rate hikes are expected to produce a hard economic landing, industrial metals often suffer. If hikes are gradual and growth remains supportive, they can hold up.
- Precious metals (gold): Gold has an ambiguous relationship with rates. Higher real interest rates (nominal rate minus inflation) historically pressure gold, as the opportunity cost of holding a non-yielding asset rises. During the 2022 cycle, gold was volatile and broadly flat in USD terms despite high inflation, partly because nominal and real rates both rose sharply.
- Agriculture: Broadly supply-driven and relatively insensitive to interest rate policy compared to other commodity segments.
Cash and short-duration instruments
Cash and short-duration instruments are direct beneficiaries of rate hikes in yield terms. Money market funds, treasury bills, and short-duration bond funds progressively pay higher yields as the cycle progresses.
This is the most straightforward relationship in the hiking cycle framework: rising rates directly increase the income generated by cash-equivalent holdings. The trade-off is opportunity cost, as holding cash preserves capital but misses potential gains in risk assets.
Real estate and REITs
Physical real estate and listed real estate investment trusts (REITs) are generally negatively affected by rate hikes, though the mechanisms differ.
Physical real estate: Higher mortgage rates reduce buyer affordability and put downward pressure on property prices. In markets with high household debt, this effect can be substantial.
REITs: As income-focused securities with characteristics similar to bonds, REIT prices generally fall as yields rise. Higher financing costs also pressure underlying property values and development economics.
The severity of the impact depends heavily on leverage levels, lease structures, and whether the hiking cycle is accompanied by economic growth (which supports rental income) or recession fears (which undermine it).
Forex and currency pairs
The currency of the hiking central bank typically appreciates against currencies where rates remain on hold or are being cut. This was clearly evident in 2022, when the US dollar strengthened substantially against most major currencies as the Fed hiked aggressively while other central banks moved more slowly.
Key pairs to watch during US hiking cycles historically include:
- USD/JPY: tends to strengthen as Japan has historically maintained ultra-low rates
- EUR/USD: dollar strength pressures the euro, though ECB hiking can counteract this
- Emerging market currencies: historically vulnerable to USD strength as capital flows toward US yields
Patterns That Hold, and Where They Break Down
The patterns described above are real and historically consistent. Several conditions cause them to break down or reverse.
When hikes are already priced in: Markets are forward-looking. If a hiking cycle is well-telegraphed and priced into asset values before it begins, the actual hikes may produce less price movement than historical averages suggest.
When hikes trigger recession fears: A rate hiking cycle that overreaches and is perceived to risk recession produces different asset class responses. Cyclical equities and commodities can suffer regardless of their typical hiking-cycle relationships. The yield curve inverts (as it did sharply in 2022), signalling that markets expect rate cuts sooner than the central bank intends.
When other factors dominate: Geopolitical events, commodity supply shocks, credit market disruptions, and global growth cycles can all overwhelm rate policy effects. The 2022 cycle was driven simultaneously by post-pandemic supply chain issues, an energy supply shock from the Russia-Ukraine conflict, and the rate response, all interacting in ways that did not fit neatly into any single-variable model.
Across different economies: The patterns described here are primarily based on US data. Other economies have different rate transmission mechanisms, debt structures, and currency dynamics. Applying US hiking cycle patterns to emerging markets, Japan, or highly leveraged property markets like Australia requires significant adjustment.
How to Use This Information Without Overfitting
The temptation when reviewing historical patterns is to construct a neat sector rotation trade: sell utilities, buy banks, go long energy, short bonds. The historical record supports the general direction of these moves, but not the timing, the magnitude, or the certainty that this cycle will resemble previous ones.
A few principles for using this framework without overconfidence:
Focus on direction. The historical record tells you which way asset classes have generally moved. It does not tell you how far, how fast, or whether this cycle will look like previous ones.
Remember that most of the move happens in the signalling phase. By the time the Fed is actively hiking, a significant amount of repricing has often already occurred. Attempting to trade the hiking cycle pattern after it is underway means entering after much of the move.
Use it to stress-test. The most productive use of this framework is asking: if rates continue to rise, how exposed is my portfolio to the categories that tend to underperform? That is a risk management question, not a trading prediction.
Diversification remains the only free lunch. Concentrated bets on hiking cycle patterns have produced significant losses when cycles behaved differently than historical norms. A portfolio that includes both hiking-cycle beneficiaries and hedges for when the pattern breaks down is more robust than one that bets entirely on any single scenario.
Frequently Asked Questions
Do rate hikes always cause stock market declines?
No. The relationship between rate hikes and equity performance is more complex than the headline narrative suggests. During the 2004–2006 cycle, US equities generally performed well throughout most of the hiking period. The more meaningful drivers are whether hikes are accompanied by strong earnings growth, whether the pace is gradual or aggressive, and whether the rate level is moving from accommodative to neutral (less impactful) or from neutral to restrictive (more impactful).
Why do bonds lose value when rates rise?
It is a mathematical consequence of fixed-income pricing. When new bonds are issued at higher yields, existing bonds with lower coupon payments become less attractive. Their market price falls until their effective yield matches the prevailing rate. The longer the time to maturity, the larger the price adjustment required. This relationship is reliable, and the only variable is the magnitude.
Is gold a good hedge during rate hikes?
Gold's relationship with rate hikes is complex. Gold tends to struggle when real interest rates (nominal rate minus inflation) rise, because the opportunity cost of holding a non-yielding asset increases. During the 2022 cycle, gold delivered broadly flat returns in USD terms despite high inflation, as real rates moved sharply higher. Gold may offer better protection against inflation uncertainty before or after a cycle than during aggressive hiking itself.
Which forex pairs are most affected by US rate hikes?
USD/JPY has historically been among the most responsive, given Japan's sustained ultra-low rate policy. EUR/USD responds to the relative hiking differential between the Fed and ECB. Emerging market currency pairs are generally most vulnerable to US dollar strength driven by rate hikes, as capital flows toward higher US yields.
How should traders use rate cycle information without overcommitting to one scenario?
Use it as a directional framework to identify relative exposure, not as a precise trading signal. Sector tilts informed by the rate cycle are a common approach, adjusting exposure toward historically resilient sectors and away from the most rate-sensitive ones, while maintaining diversification. Avoid constructing a portfolio that only works if the historical pattern repeats exactly.
How long do rate hiking cycles typically last?
The three cycles examined here varied significantly: the 2004–2006 cycle lasted about two years; the 2015–2018 cycle stretched over three years; the 2022–2023 cycle was the most compressed, completing its hikes in roughly 14–16 months. The starting point, terminal rate, and pace of hikes differ in every cycle.
Does the end of a hiking cycle mean asset prices automatically recover?
The transition from hiking to pausing and eventually cutting is generally positive for rate-sensitive assets like long-duration bonds and high-multiple equities. The timing and pace of recovery depend heavily on whether a recession follows the hiking cycle, the starting valuation levels, and whether the cutting cycle begins earlier or later than markets expect.
About the authors


0 comments