


Technical Analysis · Beginner · 6 min read
Engulfing Candlestick Pattern: How to Spot and Trade It
The smallest reversal signal, explained
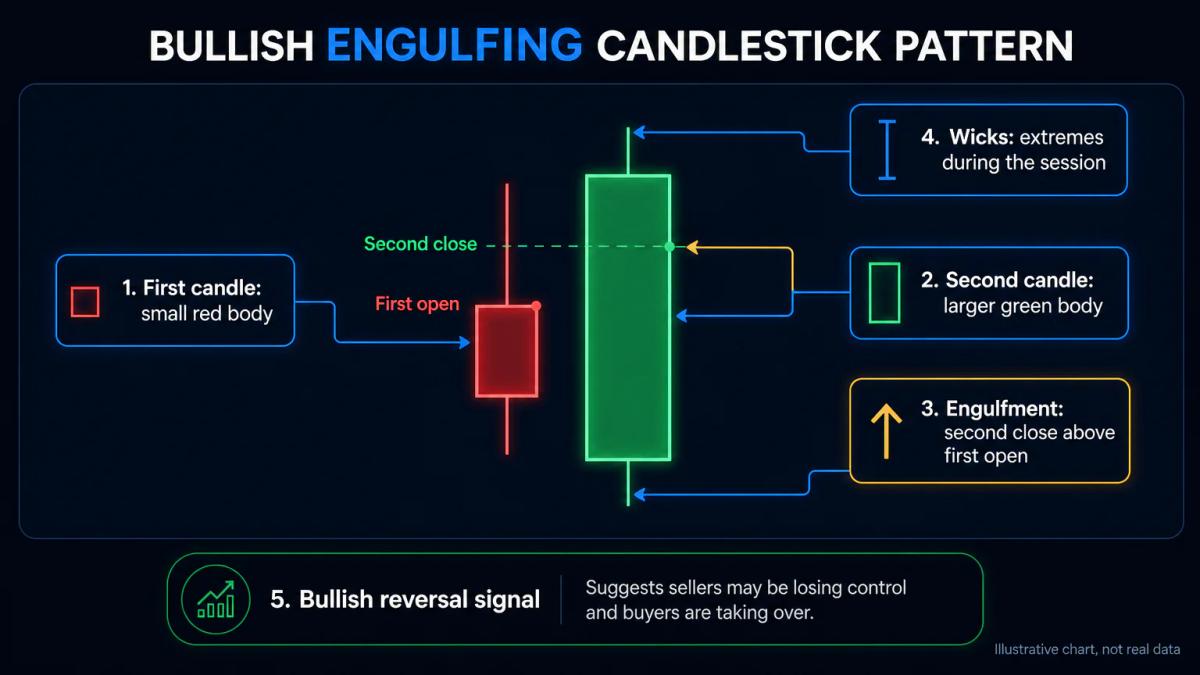
An engulfing candlestick pattern is a two-candle reversal formation where the body of the second candle completely covers the body of the first, signalling a potential shift in momentum. A candle's body is the thick part between the open and the close; the thin lines above and below are wicks, showing the extremes reached during the session.
The pattern works because it shows one side of the market overwhelming the prior session's direction in a single bar. If yesterday closed down and today opens lower but closes above yesterday's open, buyers have reversed the balance in one move. You'll spot it most clearly on hourly, four-hour and daily charts.
If you still need a broker, our guide to the best forex brokers compares the regulated options side by side.
What exactly is an engulfing candlestick pattern and how does it form?
The engulfing candlestick pattern forms when a second candle's open and close completely surround the prior candle's open and close. Only the bodies need to be engulfed; the wicks can stick out on either side without breaking the pattern.
Two versions exist, and the direction of each candle defines them:
- Bullish engulfing: appears after a downtrend. The first candle is a down candle (close below open). The second candle opens below the first candle's close, then rallies to close above the first candle's open. Sellers who shorted the open are trapped.
- Bearish engulfing: appears after an uptrend. The first candle is an up candle (close above open). The second candle opens above the first candle's close, then falls to close below the first candle's open. Buyers who bought the open are trapped.
The trapped-trader effect is the engine of the move. Those positions need to be closed, and closing them accelerates price in the pattern's direction, which is why confirmation on the next candle often follows.
Bullish versus bearish: spotting the difference in live charts
A bullish engulfing reverses a downtrend. The first candle closes lower, the second opens below it, then prints a strong rally that closes well above the first candle's open. On the chart, you see a small red body next to a larger green body that visually swallows it.
A bearish engulfing reverses an uptrend and reads as the mirror image: a small green body next to a larger red body that engulfs it. The first candle closes higher, the second opens above it, then sells off to close below the first candle's open.
Two quick checks separate a real engulfing from a lookalike. First, the prior trend has to exist; a pattern inside a sideways range is just two bars, not a reversal. Second, the second body should visibly dominate the first; a near-equal engulfing often fails on the next candle.
How do you distinguish between bullish and bearish engulfing patterns in real trading?
Context decides whether the pattern is tradable. Three filters sharpen the read:
- Prior trend length: at least three candles in one direction before the pattern. A bullish engulfing after a single down bar is noise.
- Relative candle size: the second candle should be clearly larger than recent average bars, not a marginal cover of the first body.
- Location on the chart: the pattern gains weight at prior support (for bullish) or resistance (for bearish), or at a well-watched moving average such as the 50 or 200 period.
Timeframe also changes the signal's weight. A daily engulfing after a multi-week trend is a stronger reversal cue than a 5-minute engulfing inside a lunch-hour drift. You'll get cleaner reads on four-hour and daily charts when you're starting out.
Entry, exit, and the role of confirmation
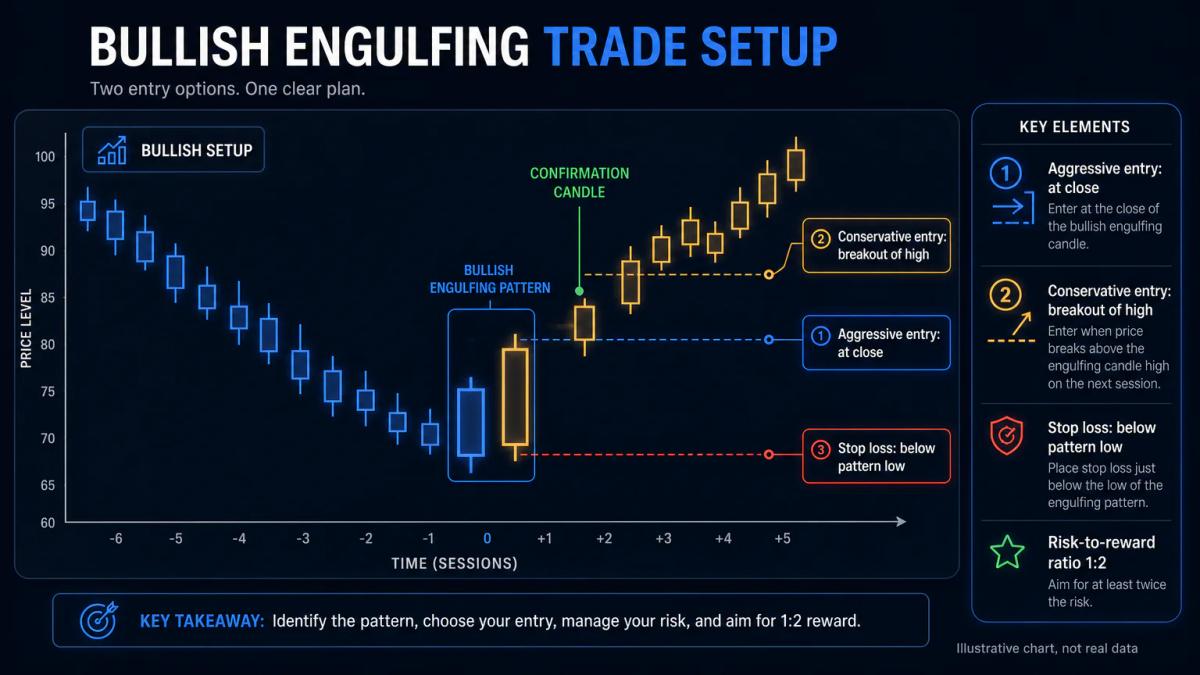
Entries sit in one of two places. The aggressive entry is on the close of the engulfing candle itself: you commit as soon as the pattern completes. The conservative entry waits for the next candle to break the engulfing candle's high (for bullish) or low (for bearish), confirming follow-through before you commit capital.
Exits need to be set before the trade opens. The protective stop goes just beyond the pattern's opposite extreme: below the low of the bullish engulfing, above the high of the bearish one. The profit target is usually a prior support or resistance level, or a measured move of at least two times the risk distance.
Confirmation layers reduce false breakouts, and the most useful are:
- a volume reading above the recent average on the engulfing candle
- an RSI reading leaving oversold (below 30) on a bullish signal or overbought (above 70) on a bearish one
- a candle close that reclaims a key moving average
One confirmation layer is a filter; two is a conviction trade.
What are the most reliable entry and exit signals when trading engulfing patterns?
Reliable entries wait for a close beyond the engulfing candle's extreme or a retest of that level on lower volume. The retest entry is the cleanest for beginners because it lets price confirm the level before you commit.
Tight exits sit just past the pattern's opposite extreme. Target placement should give a risk-to-reward ratio of at least 1:2, meaning the profit target is twice the distance from entry to stop. This filter alone discards most low-probability setups.
Confluence improves the odds further, and the strongest engulfing trades sit at an intersection of:
- prior support or resistance
- a trendline
- a moving average, with volume above average on the signal bar
Imagine a daily bullish engulfing closes at $1.0820 on EUR/USD, with the pattern's low at $1.0790. If you entered at $1.0820, placed the stop at $1.0785, and set a target at the prior resistance of $1.0900, the risk would be 35 pips and the reward 80 pips, roughly 1:2.3.
Common pitfalls and how to avoid them
The biggest mistake is trading every engulfing you see without checking the prior trend or the timeframe. A one-candle engulfing on a 5-minute chart in a flat market is noise; the same shape on a daily chart at a six-month support can be a genuine turn.
Four pitfalls catch most beginners:
- Ignoring the trend requirement: a reversal pattern needs something to reverse. Count at least three directional candles before the signal.
- Chasing late entries: entering after price has already moved a significant distance from the pattern destroys the risk-reward.
- Skipping the stop loss: without a stop just past the pattern's opposite extreme, a failed engulfing turns into an open-ended loss.
- Oversizing the position: risk no more than 1% of account equity per trade; the stop distance sets your position size, not the other way round.
Two close relatives are worth knowing so you do not confuse them with engulfing patterns. The harami is the opposite shape: a small second candle sits inside the first body. The piercing line (bullish) and dark cloud cover (bearish) only cover part of the prior body, not all of it. Treat them as weaker cousins of the full engulfing signal.
To see these conditions applied by a regulated broker, read our Forex.com review.
Frequently Asked Questions
What exactly is an engulfing candlestick pattern and how does it form?
An engulfing candlestick pattern forms when the body of a second candle completely covers the body of the previous candle. A bullish engulfing appears after a downtrend: a down candle is followed by a larger up candle that opens below the prior close and closes above the prior open. A bearish engulfing is the mirror image after an uptrend. Only the bodies need to be engulfed, not the wicks.
How do you distinguish between bullish and bearish engulfing patterns in real trading?
Check the prior trend and the colour of the bodies. A bullish engulfing shows a small red body followed by a larger green body after a downtrend of at least three candles. A bearish engulfing shows a small green body followed by a larger red body after an uptrend of at least three candles. Candle size, volume, and location at support or resistance filter weak signals.
What are the most reliable entry and exit signals when trading engulfing patterns?
The most reliable entries wait for the next candle to break the engulfing candle's high (bullish) or low (bearish), or for a retest of that level on lower volume. Place the stop just beyond the pattern's opposite extreme and aim for a target at the next support or resistance that gives a risk-to-reward ratio of at least 1:2. Confluence with moving averages or trendlines improves win rates.
What common mistakes do traders make when using engulfing patterns, and how do you avoid them?
The main errors are trading every engulfing without a prior trend, chasing late entries after price has already moved far from the pattern, skipping stop losses, and oversizing positions. Avoid them by requiring at least three trend candles before the signal, waiting for a confirmation candle or retest, defining the stop before entering, and risking no more than 1% of account equity per trade.
Can engulfing patterns be used on all timeframes and asset classes?
Engulfing patterns appear on every timeframe and asset that produces candlestick charts, including forex, stocks, indices, commodities, and crypto. Reliability rises with the timeframe: daily and four-hour signals tend to produce cleaner reversals than 5-minute or 15-minute signals, which are often absorbed by intraday noise. Beginners get the most consistent reads on four-hour and daily charts.
About the authors


Put this into practice
Brokers we have reviewed
Scored on the same five dimensions. Here are three of them — the full list is on the brokers page.



Related articles

Fair value gap explained: how to spot and trade FVGs with discipline
A practical, advanced breakdown of fair value gaps: formation, fill mechanics, entry and exit logic, sizing rules, timeframe effects and the mistakes that waste good setups.

Fibonacci Retracement Explained: Levels, Setup, and Trading Rules
A working guide to Fibonacci retracement: how to draw it, which levels matter, and how to combine it with risk rules and other indicators without over-relying on the tool.

Head and Shoulders Pattern Trading: Structure, Entry, and Risk Management
A structural guide to head and shoulders pattern trading: identification, neckline breakouts, false-break filters, inverted variant, and position sizing tied to pattern dimensions.
0 comments