



How to Trade · Intermediate · 12 min read
Market Structure Shift: How to Identify and Trade Reversals
The smallest reversal signal, explained
A market structure shift is a change in the pattern of swing highs and lows that flags a potential reversal in price direction. It occurs when price breaks below a previous swing low in an uptrend, or above a previous swing high in a downtrend, breaking the prior trend structure and giving you an objective entry before the full reversal plays out.
The appeal for you is speed. You do not wait for a moving average crossover or a lagging oscillator to catch up. The instant a candle closes beyond the last protected swing, the character of the chart has changed on paper, and you have a defined level to lean against. That definition also gives you a stop loss (the price at which you close a losing trade to cap the damage) that is not arbitrary: it sits just beyond the swing that was broken.
Where you get into trouble is treating every small break as a shift. On a five-minute FTSE 100 chart, dozens of micro swings form and break every session, and most of them mean nothing.
What separates a tradable market structure shift from noise is context: the swing that broke was protecting a meaningful trend, the break happened at a level where liquidity had accumulated, and price closed decisively through, not just wicked.
Throughout this guide the focus stays on decisions you can defend with a chart. You will see how to mark swings the same way every time, how to tell a reversal signal from a continuation one, how to combine the shift with order blocks and Fair Value Gaps, and how to size a position so a single wrong read does not damage your account.
Putting this into practice means opening an account: start with the best forex brokers our team reviewed.
How to identify swing highs and lows on your chart
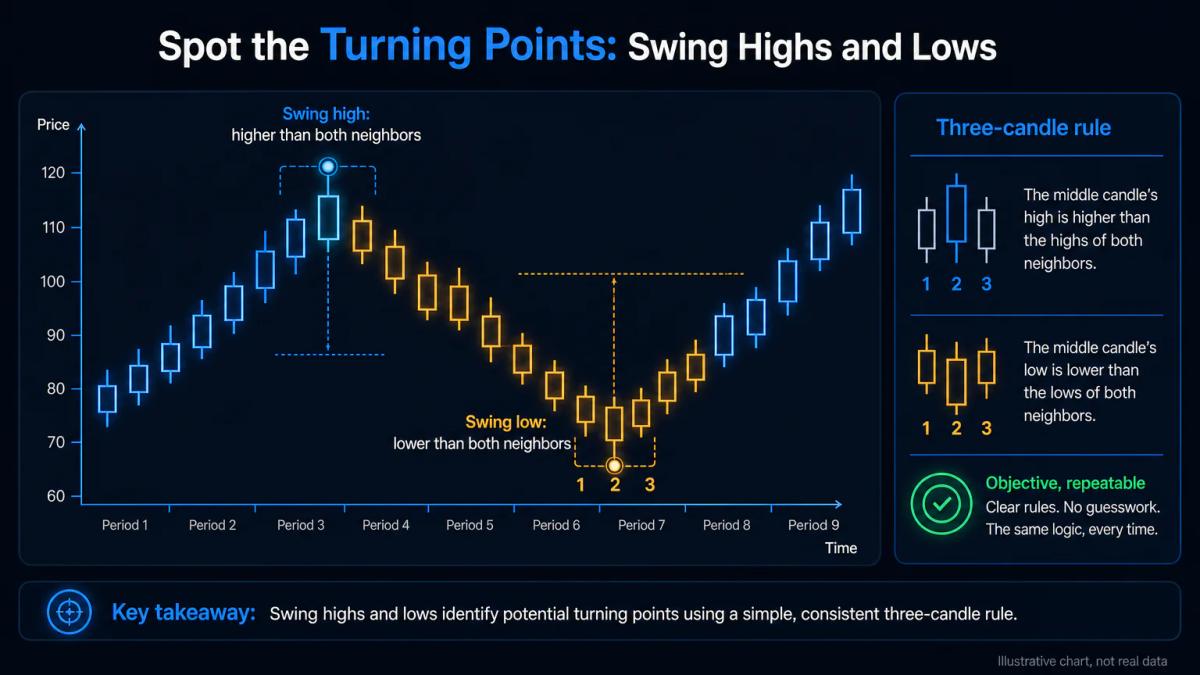
Swing highs and lows are the peaks and troughs in price action that form the foundation of market structure.
- A swing high is a candle whose high is higher than the highs of the candles immediately on either side.
- A swing low is a candle whose low is lower than the lows of the candles either side.
That three-candle definition is the simplest one that works across forex, indices and crypto, and it gives you a rule you can apply with a ruler rather than an opinion.
To spot them cleanly, zoom out first. On a 15-minute EUR/USD chart, load enough history to see two or three days of price action, then mark the most recent significant peak and trough. Ignore the micro wiggles between them. If you cannot see the swing without squinting, it is not the one you should be trading against.
As of 2026, most charting platforms (TradingView, MT5, cTrader) let you drop horizontal rays at those levels and label them, which is worth doing even when you think you will remember.
Some traders use a five-candle definition (two lower highs on each side of the peak) to filter out noise on lower timeframes. Whichever you pick, apply it to every chart you look at, every day. If you switch methods depending on how the trade is going, your structure analysis becomes storytelling.
| Timeframe | Swing definition to use | Typical noise level | What to mark |
|---|---|---|---|
| 1 min | 5-candle fractal | Very high | Only day-session extremes |
| 15 min | 3-candle fractal | Moderate | Last 2 or 3 clear peaks and troughs |
| 1 hour | 3-candle fractal | Low | Session and daily extremes |
| 4 hour | 3-candle fractal | Very low | Weekly extremes |
| Daily | 3-candle fractal | Minimal | Monthly and quarterly extremes |
Mark once, trade against those marks all day. The chart does not owe you a new swing every 20 minutes.
Market Structure Shift versus Break of Structure: what traders confuse
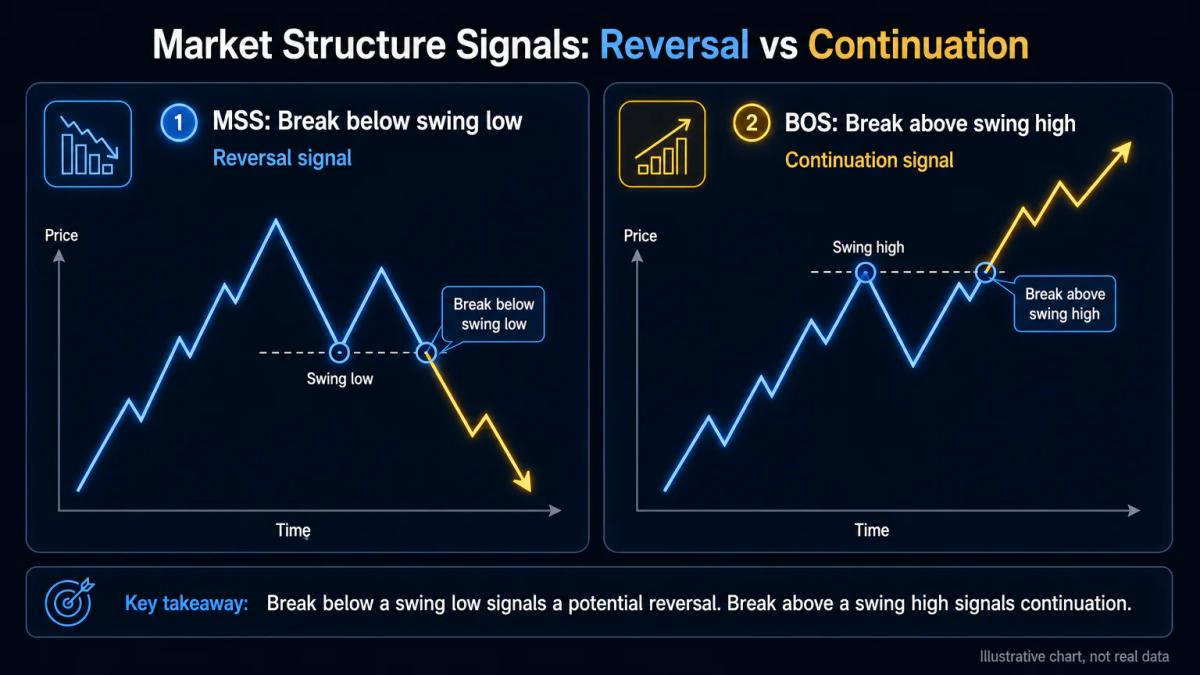
A market structure shift (MSS) signals a reversal: price breaks below a swing low while the trend was up, or above a swing high while the trend was down, flipping the direction of the structure.
A break of structure (BOS) is a continuation signal: price breaks above a prior swing high in an existing uptrend, or below a prior swing low in a downtrend, extending the trend that was already in force. Both involve a candle closing through a level. Only one reverses your bias.
The confusion is understandable, and it costs money. If you enter long on what you think is a BOS in an uptrend, but the market is actually giving you a bearish MSS through the last higher low, you are buying into the first leg of a reversal. The chart will look identical for about two candles.
Understanding the difference between bull flag and bear flag continuation patterns helps clarify how structure breaks extend trends versus how shifts reverse them.
| Signal | What breaks | Trend context before | Trade bias after | Typical stop location |
|---|---|---|---|---|
| BOS bullish | Prior swing high | Uptrend (higher highs, higher lows) | Long, continuation | Below last higher low |
| BOS bearish | Prior swing low | Downtrend (lower highs, lower lows) | Short, continuation | Above last lower high |
| MSS bullish | Prior swing high that stopped the downtrend | Downtrend | Long, reversal | Below the low that formed the shift |
| MSS bearish | Prior swing low that supported the uptrend | Uptrend | Short, reversal | Above the high that formed the shift |
The cleanest tell is the swing that just broke. Ask a single question before you enter: was that swing protecting the current trend, or extending it. A protecting swing giving way is a shift. An extending swing giving way is a break of structure.
Combining MSS with order blocks and Fair Value Gaps
Market structure shifts work best when paired with tools that show where large orders were likely placed. An order block is the last opposing-colour candle before the impulsive move that caused the structure break: the last bearish candle before a bullish MSS, or the last bullish candle before a bearish MSS. A Fair Value Gap (FVG), also called an imbalance, is an unfilled price zone between three consecutive candles where the wicks of the first and third candles do not overlap. Price tends to return to fill it.
When an MSS occurs and leaves behind a Fair Value Gap or an untouched order block, the probability of a clean retest improves because price often returns to that zone before continuing in the new direction. That retest is where the disciplined entry sits.
Confluence reduces false signals. A bearish MSS on GBP/USD is more trustworthy if the break happened at a prior daily order block, if a Fair Value Gap remains open just above the entry, and if the shift swept the session high before turning. Any one of those factors alone is thin. Two or three stacked is a setup worth risking capital on.
A short checklist for confluence:
- The swing that broke is one you would have marked before the trade, not after.
- An order block or FVG sits within one or two candles of the shift.
- Higher-timeframe structure supports the direction of the shift.
- The shift candle closed through the level, not just wicked.
If three of the four are present, the trade earns a place in your journal. If only one is, wait.
Timeframe selection and multi-timeframe confirmation
Market structure shifts appear on every timeframe, but a shift on a 1-minute chart is noisier than one on a 4-hour or daily chart. The higher the timeframe, the more capital has voted on the level, and the more meaningful the reversal tends to be.
As a rough working rule, use the daily and 4-hour for bias, the 1-hour for the shift itself, and the 15-minute or 5-minute for entry timing. Skipping straight from a 1-minute MSS to a market order is how accounts get chopped up during London and New York overlap.
Multi-timeframe confluence is the discipline of not entering unless two timeframes agree. If you see a bullish MSS on the 15-minute EUR/USD chart while the 4-hour is still printing lower highs and lower lows, the higher-timeframe seller is still in control and your shift is likely a pullback within a downtrend, not a reversal. If both the 15-minute and the 1-hour flip bullish through their respective swings, the odds line up.
A workable checklist before you click:
- Daily: what is the dominant trend, and where are the untouched swing points.
- 4-hour: is structure aligned with the daily, or has it already shifted.
- 1-hour: is an MSS forming, or has one closed in the last few candles.
- 15-minute: is there an order block or FVG left behind that price can retest.
If three of the four align, the trade is worth taking. If only the 15-minute agrees with you, you are trading noise against a trend, and the maths of that fight are not friendly.
Entry, stop loss, and position sizing for MSS trades
A typical MSS entry is placed just after the structure-break candle closes, either at the market or on a limit order at the order block or Fair Value Gap left behind by the shift.
Entering on the retest is the more patient version and usually gives a tighter stop; entering on the close is the more aggressive version and catches moves that do not retrace. Neither is wrong. Pick one and use it consistently for a quarter before you evaluate.
Your stop loss sits beyond the swing high or low that formed the shift. Price often wicks through a level before continuing, and a stop at the break is a stop that gets hit by noise. Give the trade room. If the swing is 15 pips above your short entry, that is your stop, plus one or two pips of buffer for the spread.
Position size follows from stop distance and account risk.
If you are risking 1% of a £5,000 account per trade, that is £50 at risk. If your stop is 25 pips from entry on a GBP/USD short, you divide £50 by the value of one pip at your chosen lot size until the maths works.
Under FCA rules for UK retail clients, maximum leverage on major forex pairs is 1:30, on non-major indices 1:20, on individual equities 1:5, and CFDs on cryptoassets are prohibited for UK retail. Those caps constrain lot size before your own risk rule does; check both.
Avoiding leverage trading mistakes is essential when sizing positions around MSS trades.
| Account size | Risk per trade (1%) | Stop distance | Approximate position size (GBP/USD) |
|---|---|---|---|
| £2,000 | £20 | 20 pips | 0.10 lot |
| £5,000 | £50 | 25 pips | 0.20 lot |
| £10,000 | £100 | 40 pips | 0.25 lot |
| £25,000 | £250 | 50 pips | 0.50 lot |
Target a minimum reward-to-risk of 1:2 before entry. If the nearest logical target (the prior swing on the opposite side, or an opposing order block) sits closer than twice your risk, skip the trade.
Common mistakes traders make with market structure
The most common error is trading every market structure shift without waiting for confluence. A shift alone is a signal, not a setup. Without an order block, a Fair Value Gap, a liquidity sweep, or a higher-timeframe alignment, you are entering on a single piece of evidence, and the win rate on single-evidence entries in fast markets is not one that survives a hundred trades.
Tight stops are the second offender. A stop placed at the break level gets picked off by the retest wick that would have started your move. The market makes its money from traders who mistake precision for skill. If a wider stop makes the trade too big for your risk rule, the answer is to reduce lot size.
Timeframe confusion is the third. Spotting an MSS on the 5-minute chart while ignoring that the 1-hour is still in a clean uptrend is how you find yourself short into a squeeze. Before every entry, glance up one and two timeframes. If they disagree with you, the trade is a scalp at best.
Premature entry rounds out the list. A candle that trades below the swing but closes back above it is not a shift, it is a failed test. Wait for the close. If your platform lets you set alerts at swing levels, that is a better tool than staring at the last 30 seconds of a candle.
The psychology sits underneath all four. Early exits after a small drawdown, revenge entries after a false signal, and impatience during the retest are the same discipline problem wearing different clothes. A written plan with fixed rules for entry, stop, and target is the only known cure, and the journal is what proves whether you followed it.
Frequently Asked Questions
What is the difference between a market structure shift and a break of structure in forex?
A market structure shift is a reversal signal: price breaks below a swing low in an uptrend or above a swing high in a downtrend, flipping the direction. A break of structure is a continuation signal: price breaks the next swing in the same direction as the existing trend. The candle looks similar on the chart; the difference is which swing broke and what trend was in force before it.
How do I identify a market structure shift on a 4-hour chart?
Mark the last two or three significant swing highs and lows using a three-candle definition. In an uptrend, watch the most recent higher low: if a 4-hour candle closes below it, that is a bearish MSS. In a downtrend, watch the most recent lower high: if a candle closes above it, that is a bullish MSS. Confirm the daily trend agrees before acting.
Can I trade market structure shifts on crypto and stock indices, or only forex?
The method works on any liquid market that prints swing points, including indices such as the FTSE 100 and S&P 500. For UK retail clients, CFDs on cryptoassets are prohibited by the FCA, so crypto MSS trading via CFDs is not available. You can still study crypto charts and, where appropriate, trade the underlying through a permitted route.
What is the best stop loss placement for a market structure shift trade?
Place the stop beyond the swing high or low that formed the shift, with one or two pips of buffer for spread. On a bullish MSS, that means below the low that preceded the break. On a bearish MSS, above the high. Stops at the break level itself are usually too tight and get hit by the retest wick.
How do I avoid false market structure shift signals?
Require three things before entering: a full candle close through the swing (not just a wick), confluence with an order block or Fair Value Gap, and agreement from at least one higher timeframe. If any of the three is missing, wait. Most false signals fail one of those checks, and skipping them is the fastest way to shrink an account.
About the authors


Put this into practice
Brokers we have reviewed
Scored on the same five dimensions. Here are three of them — the full list is on the brokers page.



Related articles

Options Backtesting: How to Test Strategies Before You Trade
A practical walkthrough of options backtesting: how to configure a test, read the metrics that matter, and avoid the mistakes that inflate historical returns.

Python Trading: Build, Backtest and Deploy Automated Strategies
A practical guide to Python trading for retail: from Pandas dataframes to live broker APIs, with risk sizing, backtest realism and deployment hygiene.

Stock Selection Criteria: How to Pick Stocks to Trade
How to build a repeatable stock selection process using fundamentals, charts, screeners and risk rules that fit your time horizon.
0 comments