



How to Trade · Intermediate · 5 min read
Options Backtesting: How to Test Strategies Before You Trade
The mechanics of options backtesting
Options backtesting is the process of running a defined trading strategy against historical options and underlying price data to measure how it would have performed. You feed a platform your entry rules, exit rules, and position size, then the software simulates every trade and outputs profit, loss, win rate, and drawdown so you can judge the idea before risking capital.
Under the hood, a backtest reconstructs each trade from an options chain snapshot: strike, expiration, bid, ask, implied volatility, and the underlying price at that moment. Drawdown, the fall from a capital peak to the trough before a new peak, is calculated trade by trade.
Choosing where to trade matters as much as the strategy; see the best forex brokers and their conditions.
Setting up your first backtest
To set up an options backtest, you pick a platform that stores clean historical options data, choose an underlying and a date range, then define entry criteria such as strike, delta (the option's sensitivity to a £1 move in the underlying), and days to expiration.
- Add exit rules: profit target, stop loss, and a time-decay threshold like closing at 21 days to expiry.
- Be precise about position size and costs. Most retail-friendly platforms let you specify contracts per trade, a fixed commission per leg, and a slippage assumption in pence per contract.
- Test both single-leg trades and multi-leg spreads (iron condors, call spreads, strangles) inside the same framework so results are comparable.
Vague rules produce vague backtests; rules that match how you will actually place the order produce backtests you can trust.
Reading backtest results and performance metrics
A finished backtest returns total return, win rate, average win, average loss, maximum drawdown, and often a Sharpe ratio (return per unit of volatility). Total return frames the outcome; win rate shows the share of profitable trades; maximum drawdown reveals the worst peak-to-trough decline you would have lived through.
Context is more important than any single number.
- A 60% win rate paired with small average wins and much larger average losses is a red flag: one bad trade wipes out several good ones.
- A 40% win rate with large winners and small controlled losers can be entirely viable.
Our article on how many day traders are successful shows that profitability depends far more on risk management than on hit rate alone. Compare the average loss against your intended account size, and check whether the maximum drawdown would have forced you to stop trading in real life.
Testing spreads and multi-leg strategies
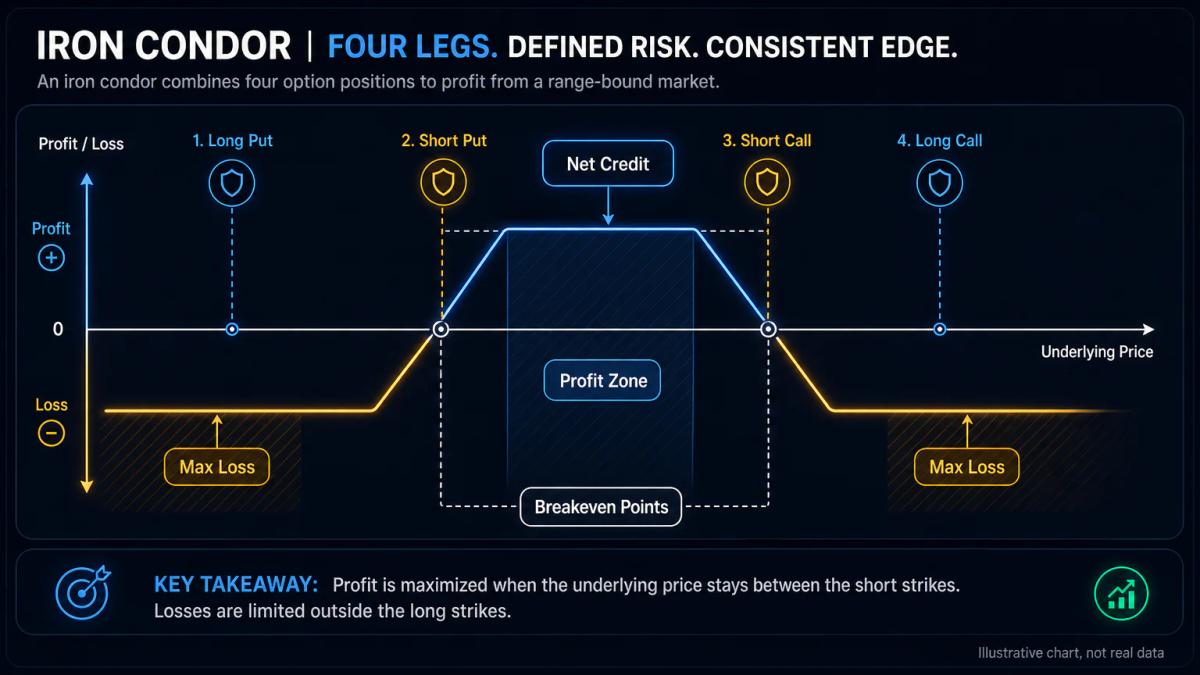
Multi-leg strategies need a platform that opens and closes every leg simultaneously.
For an iron condor, for example, you define four legs (long put, short put, short call, long call), their strikes, and a shared expiration, then set exit rules for the whole structure, not each leg individually. The platform records the net credit at entry and marks the spread to market as the underlying moves and time decay eats each leg's extrinsic value.
If you are evaluating options prop firms, they typically require you to backtest multi-leg strategies before deployment.
Commissions add up faster here: four legs in and four legs out means eight commissions per round trip. Make sure your backtest applies that cost, otherwise a strategy that looks profitable in the report may barely break even after fees.
Common backtesting mistakes to avoid
Overfitting is the biggest trap: you adjust rules until the equity curve looks flawless on the sample, then the strategy collapses live because it was tuned to noise.
Survivorship bias creeps in when your dataset excludes delisted stocks or expired contracts, so only the winners remain visible. Ignoring slippage and commissions can turn a mediocre strategy into a fake winner on paper.
Other common errors include testing only in a bull market, using fewer than two or three years of data, and reusing the same period for both design and validation. Split your data into an in-sample window for building the rules and an out-of-sample window you never touched, then judge the strategy on the untouched window.
Backtesting across different market regimes
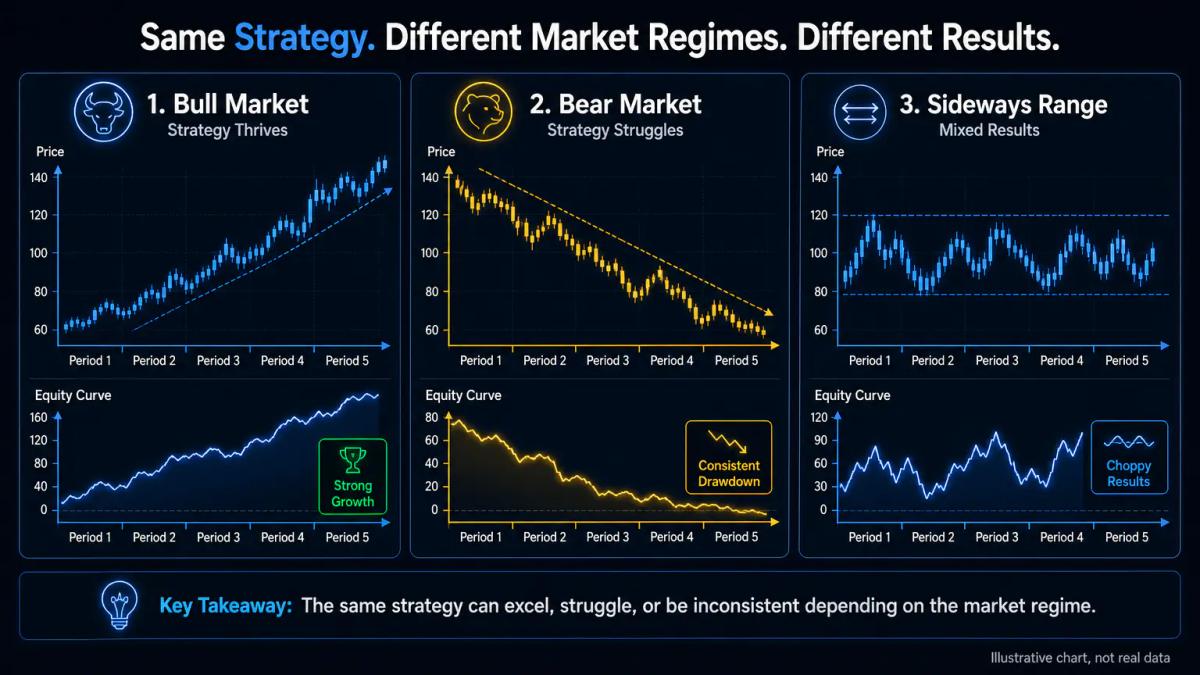
A strategy that thrives in a low-volatility uptrend can implode when the VIX spikes or the tape ranges for months. Run separate backtests for bull, bear, and sideways periods, and for high and low implied volatility regimes.
Short-premium strategies and long-premium strategies need different market conditions: short strangles and iron condors tend to perform when IV is elevated and mean-reverts, while long-premium strategies need directional moves that outrun time decay.
Filtering results by regime tells you when to trade the strategy and when to sit on your hands.
From backtest to live trading
A strong backtest is a starting point, not a guarantee. Paper trade the strategy first to confirm entry and exit rules work in real time with your broker's chain.
Place the first live trade at a fraction of the intended size, log every fill against the backtest's assumed price, and scale up only if slippage, execution delays, and realised drawdown stay within the ranges the report predicted.
FCA, consumer investment guidance: Retail investors should treat historical simulations as indicative only, since past performance does not guarantee future results.
Frequently Asked Questions
What is the difference between backtesting and paper trading options strategies?
Backtesting runs your rules against historical data and produces results instantly. Paper trading runs the same rules forward in real time on a simulated account, so you experience live bid-ask spreads, execution delays, and your own decision-making. Backtesting is faster for testing many ideas; paper trading is closer to how the strategy will actually behave when you go live.
Can you backtest 0DTE (zero days to expiration) options strategies, and what are the challenges?
Yes, but 0DTE backtests need intraday options data with tight timestamps, because prices move violently in the final hours. Bid-ask spreads widen near expiration, so slippage assumptions have to be realistic (often several cents per contract). Rapid gamma and theta swings mean small delays in entry or exit change results significantly, so backtests must model fills conservatively rather than at the mid price.
How much historical data do you need to backtest an options strategy reliably?
A useful floor is two to three years so the sample covers at least one shift in volatility regime, and five years or more is better because it captures a wider range of market conditions. Sample size matters as much as duration: a strategy that trades weekly for two years gives about 100 trades, which is a reasonable minimum for statistical comfort.
Do backtesting results account for slippage and commissions, and how do they affect real trading?
Only if you configure them. Most platforms default to mid-price fills and zero commission, which flatters returns. Add a per-contract commission that matches your broker's schedule and a slippage assumption of a few cents per contract per leg. On multi-leg strategies these costs compound quickly, and a strategy that shows a small edge without them often disappears once realistic costs are applied.
Which options backtesting platforms are free or low-cost for retail traders?
Options-specific historical data is expensive, which limits truly free tools. Some brokers include a basic backtester with a funded account, and independent platforms offer entry-level tiers for tens of dollars per month. When comparing platforms, look at the depth of the options chain history, whether intraday data is available, how spreads are modelled, and whether you can export trade logs for your own analysis.
About the authors


Put this into practice
Brokers we have reviewed
Scored on the same five dimensions. Here are three of them — the full list is on the brokers page.



Related articles

Python Trading: Build, Backtest and Deploy Automated Strategies
A practical guide to Python trading for retail: from Pandas dataframes to live broker APIs, with risk sizing, backtest realism and deployment hygiene.

Stock Selection Criteria: How to Pick Stocks to Trade
How to build a repeatable stock selection process using fundamentals, charts, screeners and risk rules that fit your time horizon.
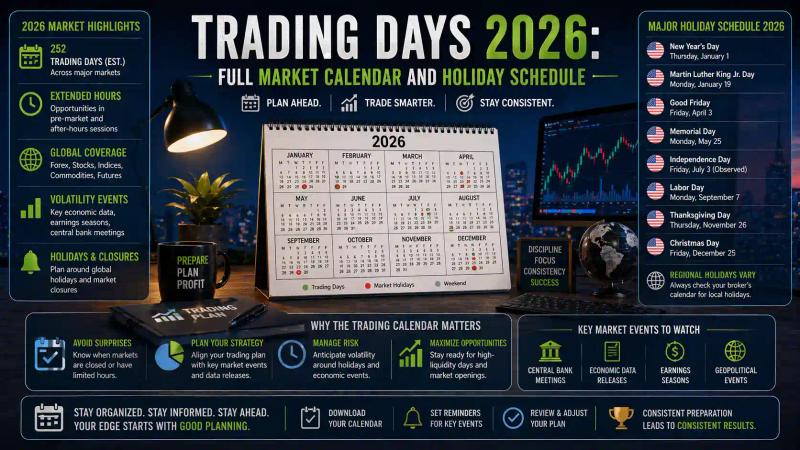
Trading Days 2026: Full Market Calendar and Holiday Schedule
Complete trading days 2026: 251 NYSE/NASDAQ trading days, all market holidays, early-close sessions, and global exchange schedules to plan around.
0 comments