



How to Trade · Beginner · 5 min read
Stock Selection Criteria: How to Pick Stocks to Trade
The core of stock selection: matching criteria to your goal
Stock selection consists of choosing individual equities based on measurable criteria that align with your investment horizon and risk tolerance. You evaluate companies using financial metrics, price patterns, or both, then decide whether the risk-reward fits your portfolio. The goal is to reduce guesswork and apply a repeatable process.
A useful framework has four layers: define your goal (income, growth, short-term trading), pick the analysis methods that answer questions about that goal, screen a universe of stocks down to a shortlist, then apply risk rules before you press buy.
How to become a trader covers the foundational process of building a repeatable approach. Equity, by the way, is simply a share in a company's ownership. Skip any layer and stock picking becomes a hunch, and hunches are the fastest route to concentrated losses.
Choosing where to trade matters as much as the strategy; see the best forex brokers and their conditions.
Fundamental analysis: reading the financial story
Fundamental analysis examines a company's financial statements, earnings, revenue growth and competitive position to estimate intrinsic value. You look at metrics like the price-to-earnings ratio (share price divided by annual earnings per share, a proxy for how much you pay for each dollar of profit), debt levels, cash flow and profit margins to decide if a stock is cheap or expensive relative to its business quality.
Beginners can start with four numbers per stock. The table below shows what each one tells you and a rough reference range for a stable large-cap company.
| Metric | What it measures | Rough reference for large caps |
|---|---|---|
| P/E ratio | Price paid per unit of earnings | 10 to 25 |
| Debt-to-equity | Leverage on the balance sheet | Below 1.0 |
| Free cash flow | Cash left after operations and capex | Positive and growing |
| Return on equity | Profit generated per dollar of equity | Above 10% |
For income-focused picks, add the dividend yield and the payout ratio: a yield above 6% funded by more than 80% of earnings signals an unsustainable dividend.
Passive income for beginners explains how dividend strategies fit into a broader income framework.
Technical analysis: what price action tells you
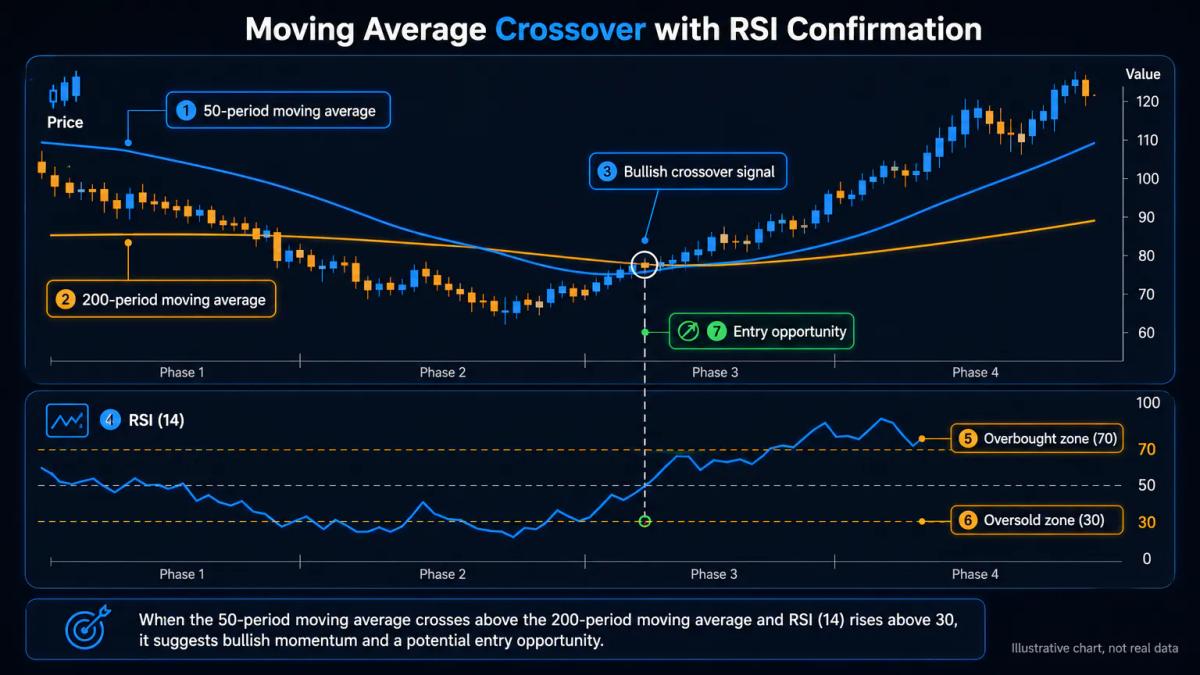
Technical analysis uses historical price and volume data to identify trends, support and resistance levels, and entry or exit signals.
How to identify market trends walks through the core concepts of reading price action. You study charts and indicators like moving averages (the average closing price over the last N sessions) or the RSI, the Relative Strength Index, which measures momentum on a 0 to 100 scale, to spot when a stock is overbought or oversold.
A simple entry rule: buy only when the stock trades above its 200-day moving average and pulls back to the 50-day, with RSI below 60.
Moving average crossover strategy details how to use these signals in practice. That combination filters out downtrends and chasing tops. Volume confirms the move: a breakout without a volume spike is often a false signal.
Screening and filtering: narrowing your universe
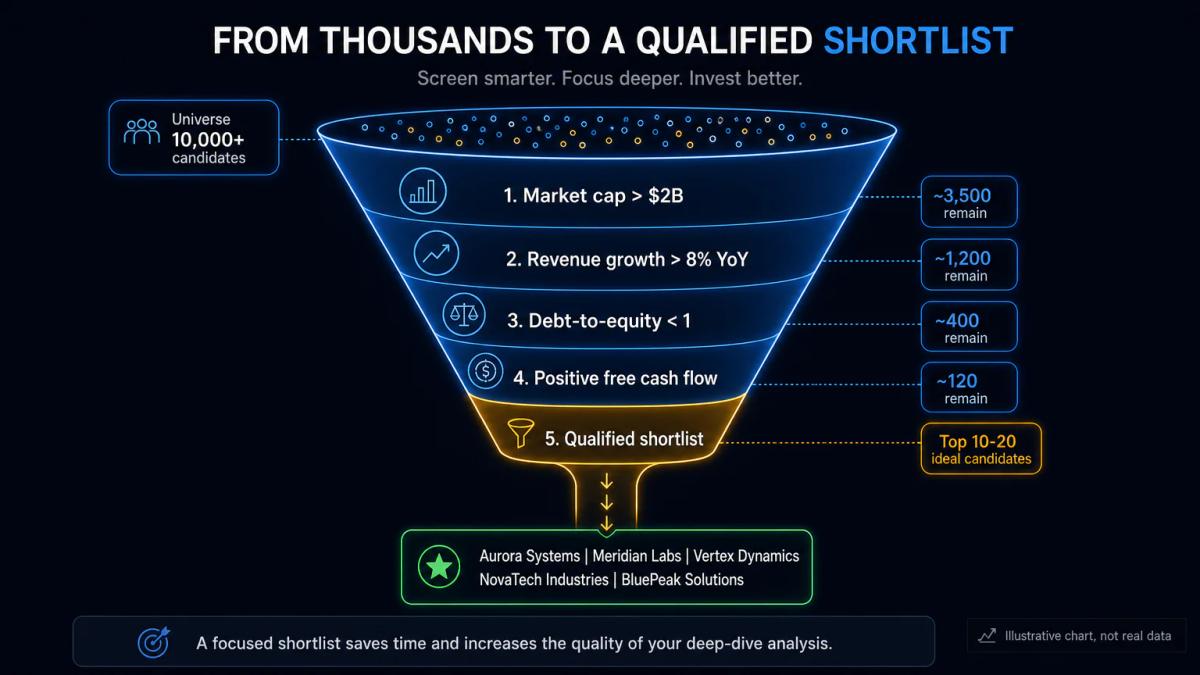
Stock screening tools let you filter thousands of equities by criteria you set: market capitalisation, sector, dividend yield, earnings growth rate or valuation multiples. This narrows your search to a manageable shortlist before you apply deeper analysis.
A workable beginner screen: market cap above $2 billion, revenue growth above 8% year on year, debt-to-equity below 1, positive free cash flow.
For international exposure add a country or ADR filter; for ESG-oriented picks add a minimum sustainability rating from a recognised data provider. Aim for a shortlist of 15 to 25 names, then read the latest annual report of each one before committing capital.
Risk management and position sizing in stock picking
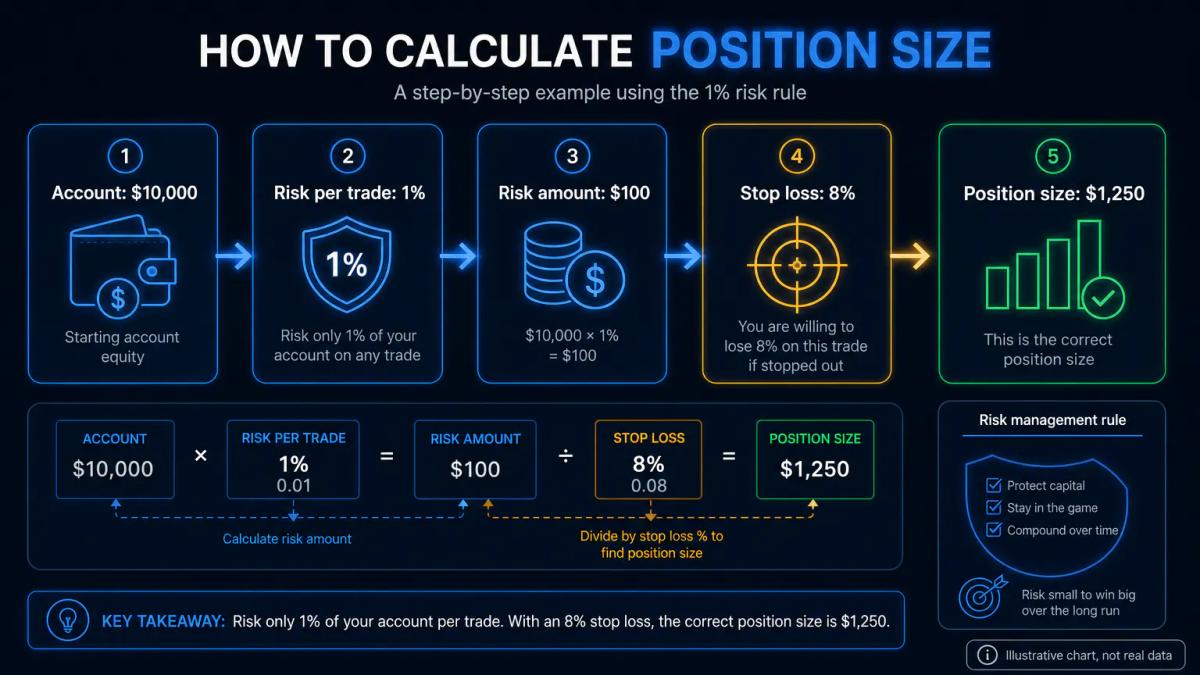
Even a well-researched pick can move against you, so you set a stop loss level and size your position so that a loss does not blow up your account.
Leverage trading mistakes covers the common errors that lead to account blowups. A common rule: risk no more than 1% of your account on a single trade. If your account is $10,000 and your stop is 8% below entry, the position is $1,250.
Diversification across sectors and company sizes reduces the impact of any single pick failing.
Stocks vs indices explains how individual equity risk compares to broader market exposure. A concentrated bet on one sector will amplify losses when the economic cycle turns against it, so rotating exposure between defensive names (utilities, staples) and cyclical names (industrials, discretionary) is part of the criteria.
Long-term versus short-term: your time horizon shapes your criteria
Long-term investors prioritise earnings stability and growth trajectory; short-term traders focus on volatility and momentum. Your holding period determines which metrics matter most and which price patterns you chase.
Tax treatment reinforces the horizon choice: in the UK, gains inside a Stocks and Shares ISA are exempt from capital gains tax, which favours long holding periods. Behavioural discipline matters too: if a name is not on your written shortlist, it does not enter the portfolio, no matter how loud the news feed gets.
Frequently Asked Questions
What is the difference between value and growth stock selection?
Value selection looks for stocks trading below their estimated intrinsic worth, using low P/E, low price-to-book and high dividend yield as filters. Growth selection targets companies expanding revenue and earnings quickly, accepting higher valuation multiples in exchange for faster compounding. Value tends to outperform in recoveries; growth tends to lead in low-rate expansions.
How do I know if a stock is undervalued or overvalued?
Compare its valuation multiples (P/E, price-to-sales, EV/EBITDA) against the industry median and the company's own five-year average. A P/E significantly below the sector median with stable earnings suggests undervaluation; a P/E well above both, with slowing growth, suggests overvaluation. Cross-check with a discounted cash flow estimate for larger positions.
Can I use both fundamental and technical analysis together when picking stocks?
Yes, and most disciplined retail traders do. Fundamentals shortlist companies worth owning; technicals time the entry and exit. A common workflow: screen for financially sound names, then wait for the price to trade above a long-term moving average and pull back before you buy.
What are the most important financial metrics to check before buying a stock?
Start with four: P/E ratio, debt-to-equity, free cash flow trend and return on equity. Add dividend yield and payout ratio if you invest for income. Read the latest annual report to check that reported earnings are backed by cash, not accounting adjustments.
How much diversification do I need when building a stock portfolio?
Research from index providers suggests most of the diversifiable risk in an equity portfolio is removed by holding 20 to 30 names spread across at least five sectors. Concentrating below ten names raises single-stock risk sharply; spreading beyond 40 names tends to dilute your best ideas without much extra risk reduction.
About the authors


Put this into practice
Brokers we have reviewed
Scored on the same five dimensions. Here are three of them — the full list is on the brokers page.



Related articles
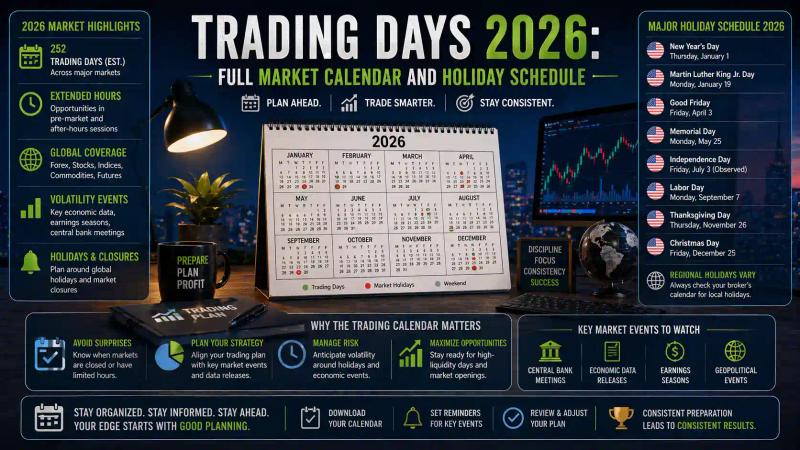
Trading Days 2026: Full Market Calendar and Holiday Schedule
Complete trading days 2026: 251 NYSE/NASDAQ trading days, all market holidays, early-close sessions, and global exchange schedules to plan around.

Useful TradingView Plugins: Which Ones Actually Improve Your Analysis
Which TradingView plugins deserve a slot on your chart, how to install and backtest them, and when a custom Pine Script beats anything in the public library.

What Are Trading Signals: How They Work and When to Use Them
A practical guide to trading signals: how indicators generate them, manual versus automated types, costs, regulation, and how to combine them with sound risk management.
0 comments