Prop Trading · intermedio
The Real Pass Rate of Prop Firm Challenges: What the Data Shows
You have probably heard that prop firm challenge pass rates are low, but anecdote is not data, and you deserve to know what the actual numbers say. This article digs into prop firm challenge pass rate data: what verified figures exist, what is only estimated, and what the gaps tell you about the industry. By the end, you will be able to assess your own realistic odds rather than relying on someone else's marketing.
There is a certain irony worth noting up front: an industry built entirely on measuring trading performance publishes almost none of its own. That scarcity is where any honest analysis has to begin.
What Pass Rate Data Actually Exists
Before you trust any pass rate figure, you need to know where it came from. The available data falls into clearly different tiers of reliability, and treating them as equal is how readers get misled.
Firm-Published Figures
A small number of firms publish their own pass rates. These figures are the most specific available, and also the most self-interested, since a firm controls both the number and how it is calculated. When you see a firm-published rate, ask what counts as an attempt and over what period, because those definitions can move the number dramatically.
Third-Party and Community Estimates
Beyond the firms themselves, analysts and trading communities produce estimates by aggregating reports from traders. These are useful for spotting patterns but should be treated as estimates, not verified facts. They draw on self-selected samples, which skews them in ways that are hard to correct.
Why the Data Is Incomplete
The core problem is that prop firms have little reason to publish unfavorable numbers and operate largely outside the regulatory frameworks that would compel disclosure. There is no standardized reporting, no audited industry benchmark, and no agreed definition of a pass. So the picture you can build is directional rather than precise.
With that caveat firmly in place, here is what the numbers seem to show.
What the Numbers Show
The figures that do exist are worth examining carefully, as long as you hold them loosely. They point to a consistent story even where the precise values are uncertain.
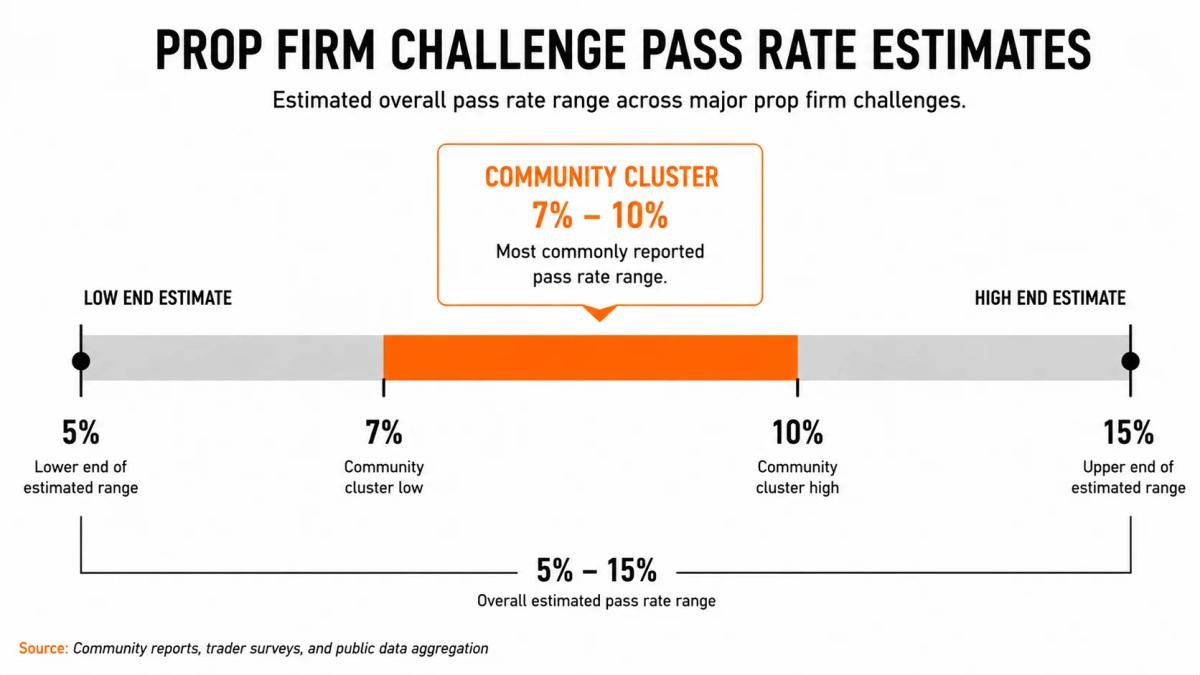
Overall Industry Pass Rate Range
Commonly reported estimates place the share of paid attempts that clear a full evaluation in the single digits to low double digits as a percentage. Treat that as a reported range rather than a confirmed industry figure, because the underlying methodologies vary and are often undisclosed. The broad takeaway is that passing is the exception.
Pass Rates by Challenge Phase (Phase 1 vs Phase 2)
Where data distinguishes between phases, Phase 1 and Phase 2 are not equally difficult, and they fail for different reasons. Phase 1 often filters out traders who size too aggressively chasing the profit target. Phase 2, which typically has a lower target, can catch traders who pull back too far or breach consistency rules. The combined pass rate across both phases is lower than either phase alone, a point industry marketing tends to blur.
Pass Rates by Firm Type (Instant Funding vs Two-Phase)
The challenge structure changes what a pass rate even means. A one-phase or instant-funding model applies a different filter than a strict two-phase evaluation, so comparing their headline pass rates directly is misleading. Instant funding often shifts the difficulty to the funded stage rather than removing it, which is why interpreting these numbers requires knowing the structure behind them.
Numbers tell you the outcome. The more useful question is what is actually causing it.
Why Most Traders Fail Challenges
Knowing the numbers is one thing. Understanding what drives them is another, and this is where you start to see what is within your control.
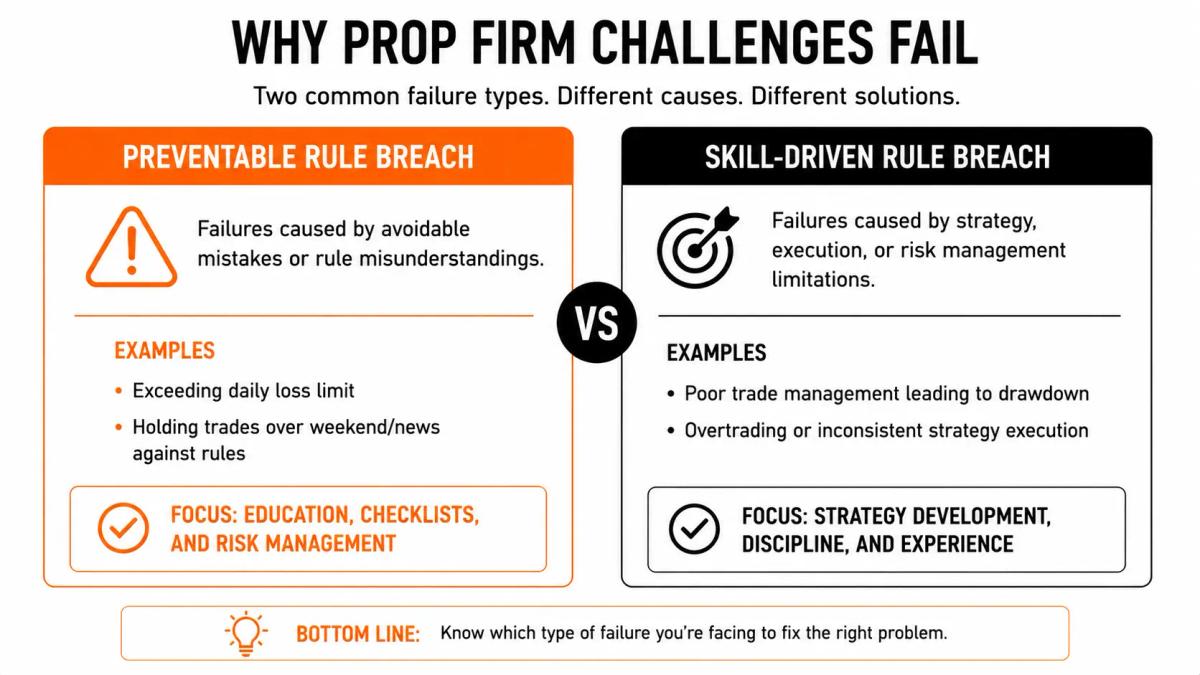
Rule Violations vs Skill Deficits
Failures split broadly into two camps. Some traders fail because they break a specific rule, often a drawdown or consistency limit, even while trading reasonably. Others fail because of a genuine skill gap that no rule set would have saved. Distinguishing these matters for your own assessment, because a rule-violation failure and a skill-deficit failure call for very different responses.
The Role of Drawdown Rules in Failure Rates
Drawdown rules are the most common executioner of challenge attempts, and one detail decides how harsh they are. A balance-based drawdown counts only closed-trade losses against your limit, while an equity-based drawdown also counts unrealized losses on open positions. An equity-based rule can end your attempt on a temporary swing that a balance-based rule would have ignored. Two firms advertising the same percentage limit can present very different real difficulty because of this single mechanic.
Trader Behaviour Patterns That Predict Failure
Certain behaviours show up repeatedly in failed attempts, based on reported community patterns:
- Oversizing positions to hit the target faster
- Overtrading after an early loss to make it back
- Ignoring the daily loss limit during a volatile session
- Treating the challenge as a sprint rather than a controlled process
Recognizing these patterns in your own trading is the first practical step toward avoiding them. The flip side is just as instructive: what do the traders who pass actually do differently?
What Separates Passing Traders from the Rest
The minority who pass are not lucky outliers. They tend to share habits that you can identify and, with work, adopt.
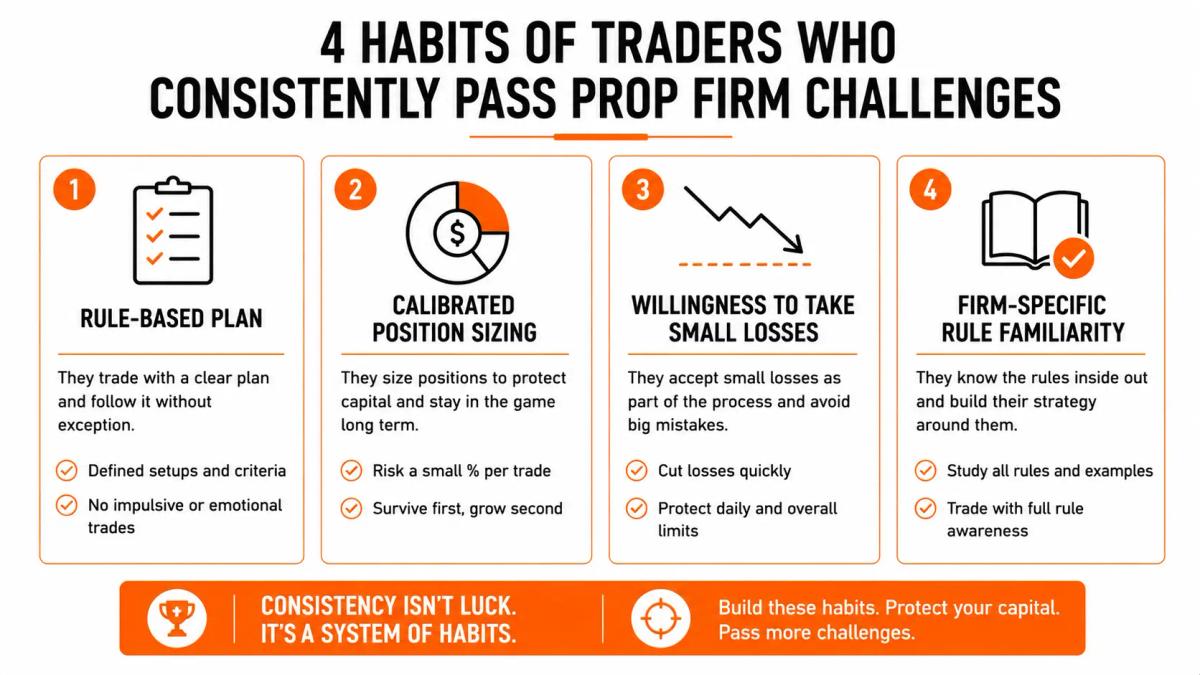
Verified Traits and Habits of Challenge Passers
Reported patterns among traders who pass point consistently to a few habits:
- Conservative position sizing that keeps them well inside drawdown limits
- A defined plan executed with patience rather than urgency
- Acceptance of a slower path to the profit target
- Disciplined handling of losing days instead of attempts to recover immediately
These are habits, not guarantees, and they describe tendencies rather than a formula.
The Impact of Preparation and Risk Management
The single biggest separator appears to be risk management. Traders who treat the drawdown limit as the binding constraint, and size their positions accordingly, survive long enough for an edge to play out. Preparation matters too: understanding the exact rules before starting prevents the avoidable breaches that end so many attempts. MonkeyTrade's position sizing and drawdown mechanics guides cover the fundamentals here.
All of this leads to the question that actually matters for you: what are your own odds?
How to Assess Your Own Realistic Odds
Industry averages describe a crowd. Your odds depend on your specific trading history and how well it matches the challenge you are considering.
Benchmarking Your Trading History
Start with your own data. Look at your historical maximum drawdown, your typical risk per trade, and your consistency over a meaningful sample. If your normal drawdown already brushes against a firm's limit, your odds of breaching it are high before you even begin. An honest benchmark against your real records tells you more than any industry estimate.
Matching Your Style to the Right Firm and Challenge
Your odds also depend on fit. A trader whose style produces frequent open-position swings will struggle under an equity-based drawdown rule and may do far better under a balance-based one. Matching the firm's rules and structure to how you trade is one of the few levers genuinely in your control. You can compare those rules across providers using MonkeyTrade's prop firm comparison.
Frequently Asked Questions
What is the average pass rate for prop firm challenges across the industry?
There is no single verified industry figure, because firms count attempts differently and rarely disclose their methodology. Commonly reported estimates place full-evaluation pass rates in the single digits to low double digits as a percentage, but these should be treated as estimates rather than confirmed facts.
Why do prop firms not publish their pass rate data?
Prop firms operate largely outside the regulation that would require disclosure, and they have little commercial incentive to publish unfavorable numbers. The result is an absence of standardized, audited pass rate data across the industry.
Is Phase 2 harder to pass than Phase 1?
The two phases fail for different reasons rather than one being uniformly harder. Phase 1 often catches aggressive sizing aimed at hitting the target, while Phase 2, with a typically lower target, can catch traders who become too cautious or breach consistency rules. The combined pass rate is lower than either phase alone.
Does the type of challenge affect pass rates?
Yes. One-phase, two-phase, and instant-funding models apply their filters differently, so their pass rates are not directly comparable. Instant funding, for example, often shifts difficulty to the funded stage rather than removing it.
Does low pass rate data mean challenges are designed to fail traders?
The data raises this as a fair question rather than answering it definitively. Low pass rates are consistent with a fee-driven business model, but they are also consistent with genuinely demanding rules that many traders are not prepared for. The honest position is that the incentive structure and trader skill both contribute, and it varies by firm.
How can I calculate my own realistic odds of passing?
Benchmark your own trading records, particularly your maximum drawdown, risk per trade, and consistency, against the specific rules of the challenge you are considering. If your normal behaviour already approaches a firm's limits, your realistic odds are lower regardless of the industry average.
Does attempting a challenge multiple times improve pass probability?
Repeated attempts can help if you genuinely correct the cause of previous failures, since you learn the rules and your own weak points. They do not improve your odds on their own, and repeated attempts driven by the same uncorrected mistakes mainly add to your costs. This article is for educational purposes only and does not constitute financial or investment advice.
About the authors


0 comments